Sample Category Title
Trade Idea Update: EUR/USD – Buy at 1.0870
EUR/USD - 1.1933
Original strategy :
Buy at 1.1870, Target: 1.1970, Stop: 1.1835
Position : -
Target : -
Stop : -
New strategy :
Buy at 1.1870, Target: 1.1970, Stop: 1.1835
Position : -
Target : -
Stop : -
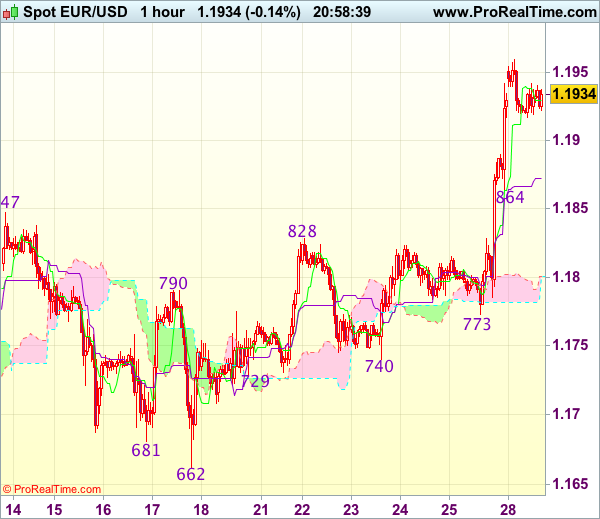
The single currency finally rallied on Friday and upmove gathered momentum after breaking indicated resistance at 1.1828 (now support) and euro eventually surged above recent high at 1.1910, adding credence to our bullish view for a resumption of recent upmove, hence upside bias remains for further gain to 1.1970-80, however, near term overbought condition should limit upside to 1.1200-10 and reckon 1.1250-60 would hold from here.
In view of this, would not chase this rise here and would be prudent to reinstate long on pullback as the Kijun-Sen (now at 1.1873) should limit downside and bring another upmove. Only below previous resistance at 1.1828 (now support) would abort and suggest a temporary top is possibly formed, risk test of 1.1800 but break of support at 1.1773 (Friday’s low) is needed to confirm.
Sterling Recovers as Markets Eye Third Round of Brexit Negotiation
Sterling recovers broadly today as markets are looking at the third round of Brexit negotiation between UK and EU in Brussels.. There are talks that selloff of the Pound is overdone, in particular against Euro. Technically that's a valid view as the cross, currently at 0.9240, is reasonably close enough to key resistance level at 0.9304 (2016 high). But the recovery in the Pound is so far rather weak and it's staying near term bearish against Euro, Dollar and Yen. There are still a lot of uncertainties over the outcome of Brexit and we believed that the worst is not priced in yet. There might be renewed selling in Sterling should there be no positive news coming our from the Brexit negotiators.
Davis called for flexibility and imagination
UK's Brexit secretary David Davis called for "flexibility and imagination" in the talks. And he emphasized that UK wants a Brexit deal "that works in the best interests of both". EU chief Brexit negotiator Michel Barnier warned in an article that UK will have "very practical consequences including on defence and security" after Brexit. Barnier noted that "the British defence minister will no longer be able to sit at the council of defence ministers, London will leave the European Defence Agency and Europol". Neither party touched on one of the biggest deadlock in the negotiation, the divorce bill. It's reported that EU officials have requested Davis to provide details on their side of the calculation on the bill but so far nothing is provided.
BCC and DIHK urge focus on practical business concerns
The British Chambers of Commerce (BCC) and the Association of German Chambers of Commerce (DIHK) issued a joint statement urging UK and EU to focus on shared economic interests in Brexit negotiations. BCC director general Adam Marshall said that "as Brexit talks continue, it's clear that companies in the UK and on the continent all want economic issues to rise to the top of the negotiations agenda. There is real business appetite from both sides for a focus on practical, day-to-day business concerns, and a desire for clarity on future trading arrangements." DIHK head Martin Wansleben said that "the terms of exit are still completely unclear. Many of our members are reporting that they are already shifting investments away from the UK in anticipation of these barriers."
BoJ Kuroda: Less need to purchase JGBs ahead
BoJ Governor Haruhiko Kuroda said in a television interview that 4% growth cannot be sustained and "around 2% growth is likely" for the country. He hailed the yield curve control frame work as "well managed" and noted that "despite the wide fluctuation of long-term interest rates in Europe and the United States, Japanese 10-year JGB interest rate has been very flat, around 0 percent." He also noted that the JGB markets are "functioning quite well" in spite of the central bank's massive asset purchase program. Meanwhile, he pointed out that "since JGBs remaining in the market is going to decline, that means that with one unit of JGB purchase, the impact on the interest rate could be bigger." Hence, "in coming months there will be less and less need to purchase JGBs in order to maintain the yield curve."
On the data front
US trade deficit widened slightly to USD -65.1b in July. Wholesale inventories rose 0.4% in July. Eurozone M3 rose 4.5% yoy in July.
GBP/USD Mid-Day Outlook
Daily Pivots: (S1) 1.2816; (P) 1.2852; (R1) 1.2911; More...
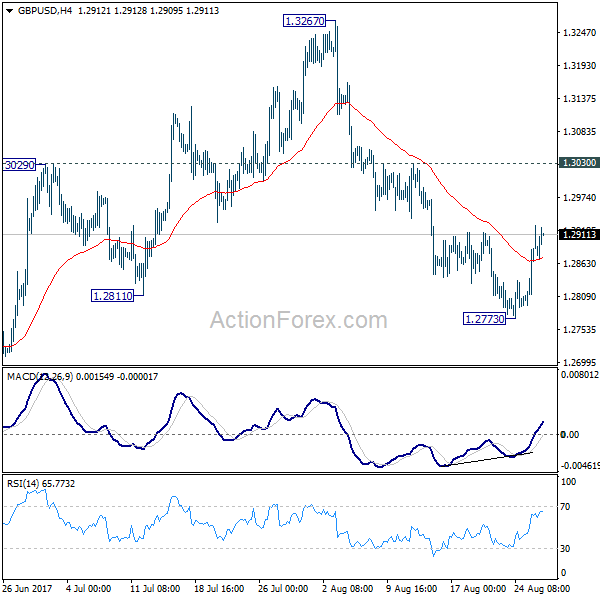
GBP/USD's recovery from 1.2773 continues today but it's staying well below 1.3030 resistance so far. Intraday bias remains neutral with mildly bearish near term outlook. We're favoring the case that correction from 1.1946 is completed at 1.3267. Below 1.2773 will target 1.2588 key near term support first. Decisive break of 1.2588 will confirm our view and target a test on 1.1946 low. Though, break of 1.3030 will dampen this bearish view and turn bias back to the upside for retesting 1.3267.
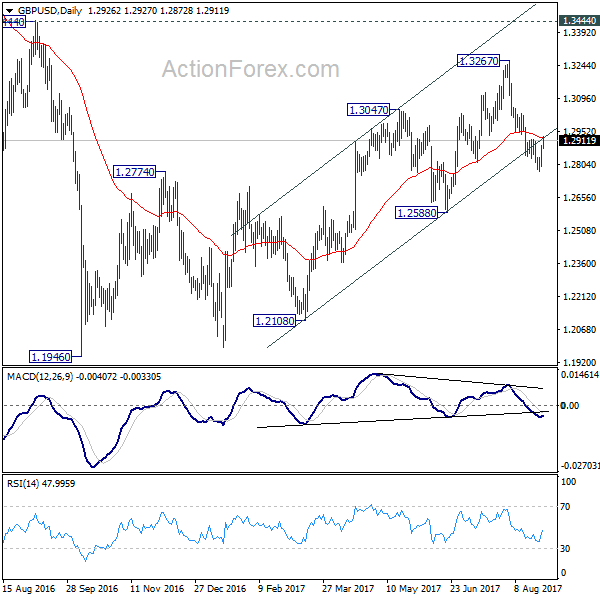
In the bigger picture, overall, price actions from 1.1946 medium term low are seen as a corrective pattern. While further rise cannot be ruled out, larger outlook remains bearish as long as 1.3444 key resistance holds. Down trend from 1.7190 (2014 high) is expected to resume later after the correction completes. And break of 1.2588 will indicate that such down trend is resuming.
Economic Indicators Update
| GMT | Ccy | Events | Actual | Forecast | Previous | Revised |
|---|---|---|---|---|---|---|
| 08:00 | EUR | Eurozone M3 Y/Y Jul | 4.50% | 4.90% | 5.00% | |
| 12:30 | USD | Wholesale Inventories Jul P | 0.40% | 0.30% | 0.70% | |
| 12:30 | USD | Advance Goods Trade Balance Jul | -65.1B | -64.5B | -64.0B |
Trade Idea Update: USD/JPY – Hold long entered at 109.25
USD/JPY - 109.33
Original strategy :
Bought at 109.25, Target: 110.25, Stop: 108.90
Position : - Long at 109.25
Target : - 110.25
Stop : - 108.90
New strategy :
Hold long entered at 109.25, Target: 110.25, Stop: 109.00
Position : - Long at 109.25
Target : - 110.25
Stop : - 109.00
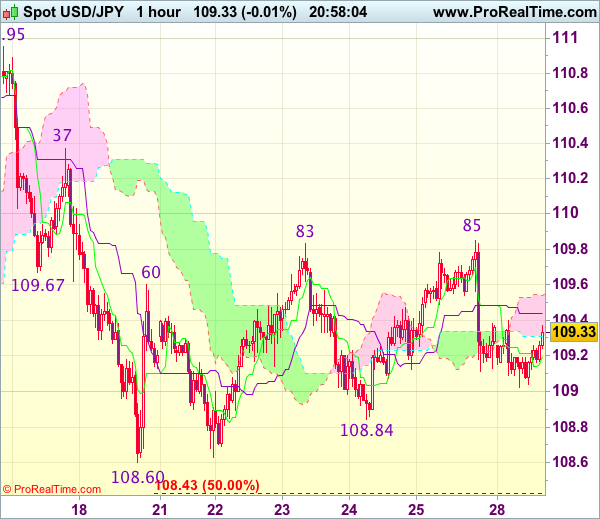
Although the greenback retreated quite sharply after Friday’s marginal rise to 109.85, outlook remains consolidative, reckon downside would be limited to 109.00 and bring rebound later, above 109.50-55 would bring test of said resistance at 109.85, break there would extend the erratic rise from 108.60 low to 110.00, then towards resistance at 110.37 which is likely to hold from here.
In view of this, we are holding on to our long position entered at 109.25. Only below said support at 108.84 would abort and bring retest of said support at 108.60, break there would revive bearishness and confirm recent decline has resumed for further weakness to 108.30 (1.618 times projection of 110.95-109.67 measuring from 110.37), then towards 108.00.
USDJPY Back Under Pressure
The USDJPY pair remains under selling pressure as the new trading week begins, with price action hovering just above the 109 level, following Friday's strong rejection from the 109.84 level.
Technically, the USDJPY is strongly bearish, with the pair now trading back below all key short, medium and long-term moving averages, with price now risking extended losses towards fresh 2017 lows, below the key 108.13 level.
Later today the Japanese economy releases household spending data and the July unemployment rate, with the U.S economic calendar remaining fairly light, the upcoming Japanese data points should impact the USDJPY.
Key upside technical resistance is found at the weekly pivot point, at 109.28, and the daily pivot point, at 109.42. Above 109.42, the 109.59 level comes back into focus, with the 109.80 level again the key to further upside above the 110 level.
To the downside, the triple bottoms created on the lower time-frame charts come into focus, with support layered below the 109 level, at 108.86, 108.69 and 108.60.
GBPUSD Battles Daily Trendline Resistance
The GBPUSD pair has moved back above the 1.2900 level, as traders continue to buy British pounds and sell U.S dollars, in a busy Monday session, despite many London trading desks closed for the UK Summer Bank Holiday.
At present, sterling is finding strong technical resistance from the daily time frame, upsloping trendline, which began at the 1.2108 price low, and is found currently capping price action at the 1.2906 level.
Going forward, the 100-day moving average, at 1.2920 should define the GBPUSD pairs trading action, ahead of the UK Inflation Report Hearings on Wednesday.
Key intraday technical support below the 1.2900 level, is found at the channel top, at 1.2890, and the current weekly price low, at 1.2872.
Key GBPUSD technical resistance above the 1.2920 level, is found at the August 11th price low, at 1.2939, with further upside resistance found at the 38.2 percent Fibonacci retracement of the 1.2774 low to the yearly price high, at 1.2960.
Above 1.2960, the 50-day moving average, at 1.2984, is the final barrier before the crucial 1.3000 level.
Weekly Wave Analysis EUR/USD, GBP/USD, USD/JPY
EUR/USD
The EUR/USD broke above the resistance (dotted red) of the continuation chart pattern and is continuing with the uptrend. The first target is at 1.20 which could cause a retracement, at least on lower time frames, within the uptrend.
Daily chart:
The EUR/USD bullish price action is probably part of a wave 3 (blue) momentum.
Weekly chart:
The EUR/USD bullish momentum could be part of a wave A (brown). The strong bullish momentum seems to indicate that the bearish wave 5 (blue) of wave C (brown) is most likely completed.
Monthly chart:
USD/JPY
The USD/JPY is caught in between a support zone (green) and resistance trend line (orange).
Daily chart:
The USD/JPY is also in a larger triangle chart pattern with support (blue) and resistance (red) nearby.
Weekly chart:

The USD/JPY is most likely in a wave B (green) correction at the moment. Price could test lower Fibs like the 50%-61.8% Fib or show a break above resistance (red) and start wave C.
Monthly chart:
GBP/USD
The GBP/USD is probably building a wave 1-2 (red) wave structure and could complete a potential head and shoulders chart pattern at the resistance zone (orange).
Daily chart:
The GBP/USD seems to be completing an ABC (brown) correction at the resistance trend lines (brown/red). This could be part of a larger wave 4 (purple) correction unless price breaks above the resistance trend line (brown).
Weekly chart:
The GBP/USD could be in a wave 4 (purple) if price manages to break below support and stay below the 61.8% Fibonacci level of wave 4 vs 3.
Monthly chart:
Crude Oil: A Panther Crouching for a Spring
What do we see when we look at the chart with the price behavior of one or another trading instrument? We see the result of several decisions and actions. But decisions aren't made without reason. They are made under the influence of expectations, opinions, and analytical conclusions from observations and calculations. But in addition to that, the chart may show the general feeling of market players.
So, what can the chart with the Brent price dynamics over the last four years tell us? The decline started in February 2013 and stopped in January 2015. Since then, the market has been correcting the previous decline. If the first year of the correction looked like an uptrend, then this year it looks more like a downtrend.
However, inside this descending correctional structure, we can see a local ascending tendency. As a result, we can see the situation, when the newly-formed rising impulse may break the descending tendency on the more global scale. The only deterrent is the level of 54.90 (the high reached on May 25th 2015). It means that after reaching this level, the market may be slightly corrected, but then continue its growth. In this situation, one of the most difficult tasks is to predict upside targets, because this growth is likely to be only mid-term. The closest upside target might be the high reached on January 3rd 2017 at 58.50.
So, what can influence the development of the uptrend in the short-term? According to the EIA (the US Energy Information Administration), the Crude Oil Inventories in the USA lost almost 13%. Also, they reported on the US Oil Rig Count, which reduced as well. May be the decline in the oil prices forced American drilling companies to slow down a bit. In addition to that, there were some speculations that Exxon Mobil Corp. Would close one of its largest oil refineries in the USA. Some political issues in Venezuela, which may result in the oil delivery interruptions, probably supported the growth of the prices. Reports of the oil extraction suspension in the largest fields of Libya, the Sharara field, affected traders and investors as well. The Crude Oil Inventories in the USA are steadily decreasing and it probably means that there is some kind of balance on the market. If this dynamics continues, the outlook for the oil will be "bullish", taking into account the decrease of the oil extraction by Russia and the OPEC countries. The Afghanistan strategy, presented by Donald Trump, the US president, was due in no small part to that. The strategy implied that the American soldiers would stay in the country, but at the same time Trump promised to implement a heavy-handed and pragmatic approach to support the government in Kabul. In the wake of the above-said, one may assume that market players, traders and investors snatched at every opportunity to benefit from the oil process increase.
Also, we may assume that the OPEC's comments about the oil extraction suspension due to the excessive supply on the market are not taken seriously. And the fulfillment of obligations relating to the oil production decrease by the members of the organization leaves a lot to be desired. However, in the short-term it might serve as a deterrent. In the long-term, the oil market will reduce under the influence of progressing technologies and less expensive energy resources.
Technical Outlook: WTI Oil – Fresh Weakness Threatens Daily Cloud Top
WTI Oil edged lower on Wednesday, after limited upside action in early Asian trading stalled under strong barrier provided by 20SMA at $48.29.
Oil price showed no impact from hurricane Harvey that hit Texas over the weekend and caused disruption of oil production in a number of refineries.
Persisting concerns about global oversupply keep oil price under pressure, as rising US shale oil production offsets attempts of OPEC and non-OPEC oil producers to stabilize oil prices by slashing the oil production by 1.8 million barrels per day until March 2018.
Near-term outlook is turning negative and shifting focus towards strong support at $47.01 (daily cloud top) which contained two attacks last week.
Cloud is also twisting this week and may attract for fresh weakness.
Penetration into daily cloud would expose key n/t support at $46.44 (17 Aug trough).
Broken Tenkan-sen and Kijun-sen lines now act as resistances at $47.58 and $47.90 respectively, guarding south-turning 20SMA at $48.29.
Res: 47.58, 47.90, 48.15, 48.29
Sup: 47.22, 47.01, 46.44, 46.22
Technical Outlook: Spot Gold – Extended Bullish Acceleration Eyes $1300 Pivot
Spot Gold extended rally in the second straight day on Monday, responding to weaker dollar and pressures former spike high of 18 Aug at $1300 on fresh acceleration higher.
Fresh bullish sentiment on weaker dollar that was strongly disappointed after Fed Yellen did not mention monetary policy or unwinding a massive portfolio, maintains strong demand for the yellow metal.
Scenario of firm break above $1300 pivot is becoming more realistic, with lift above it to open way towards $1315 (Fibo 76.4% of larger $1375/$1122 descend) and $1331 (Fibo 138.2% projection of the upleg from $1204).
Rising bull-channel trendline offers solid support at $1288 which should contain corrective dips.
Res: 1298, 1300, 1310, 1315
Sup: 1293, 1291, 1288, 1280
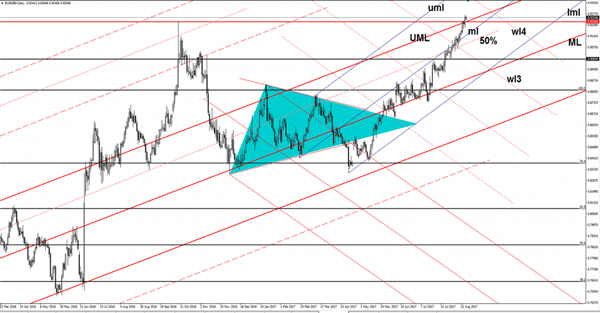
EUR/GBP Crucial Breakout
EUR/GBP has managed to break through the confluence area formed at the intersection between the upper median line (UML) of the ascending pitchfork with the 0.9226 long term resistance. Breakout still needs confirmation, a retest of the broken levels will attract more buyers, which should lead the rate towards the fourth warning line (wl4).