
Sample Category Title
Trade Idea : EUR/USD – Buy at 1.2000
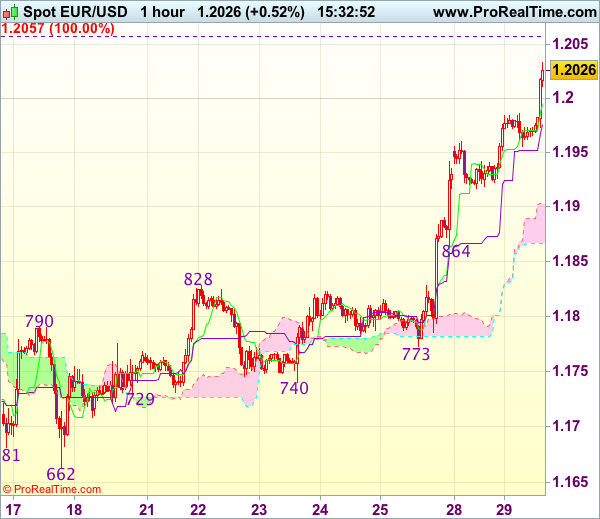
EUR/USD - 1.2041
Most recent candlesticks pattern : N/A
Trend : Up
Tenkan-Sen level : 1.2000
Kijun-Sen level : 1.1982
Ichimoku cloud top : 1.1903
Ichimoku cloud bottom : 1.1867
Original strategy :
Buy at 1.1870, Target: 1.1970, Stop: 1.1835
Position : -
Target : -
Stop : -
New strategy :
Buy at 1.2000, Target: 1.2100, Stop: 1.1965
Position : -
Target : -
Stop : -
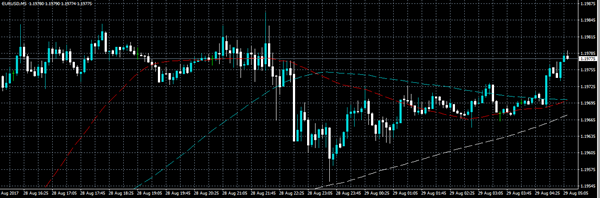
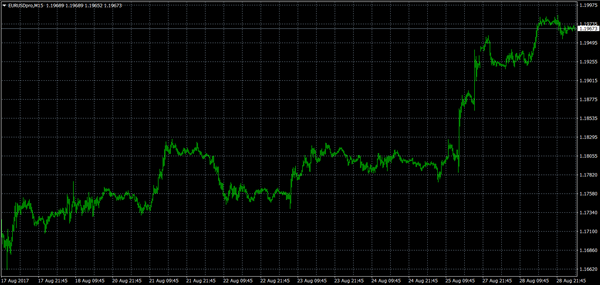
As euro’s upmove has accelerated after last week’s anticipated rally above previous resistance at 1.1910 (now support), adding credence to our bullish view that recent upmove is still in progress and may extend headway to 1.2055-60 and then 1.2095-00, however, near term overbought condition should limit upside and reckon 1.2150-55 (61.8% projection of 1.1119-1.1910 measuring from 1.1662) would hold from here, bring retreat later.
In view of this, would not chase this rise here and would be prudent to reinstate long on pullback as the Tenkan-Sen (now at 1.2000) should limit downside. Only below intra-day support at 1.1955 would defer and risk correction to 1.1930 but said previous resistance at 1.1910 should limit downside.
EUR/USD: M3 Money Supply
The European Central Bank published its monthly report showing the total change in M3 Money Supply as well as in private loans, which caused a modest fall in the EUR/USD exchange rate. A decrease was initially offset, suggesting stronger bullish sentiment for the Euro, which held the pair above the 1.1930 level in the early Monday's session.
The ECB released its monthly figures on the amount of money in circulation. According to the Central Bank's report, the M3 Money Supply dropped 4.5% on an annual basis over the course of July, following the prior month's 5.0% and missing forecasts for a decline of 4.9%. However, private lending grew 2.6%, matching the previous month's pace, providing an additional bullish signal for the future of the EU economy.
Yen Soars On North Korean Tensions
The Japanese Yen has moved to a four-month trading high against the U.S dollar, hitting 108.33, after North Korea fired a missile that flew over directly over Japan, further escalating tensions in the Korean peninsula.
At present, the USDJPY pair is trading around the 108.80 level, with traders now awaiting a response to North Korea's provocation, as fundamental developments dictate the directional bias of risk-assets.
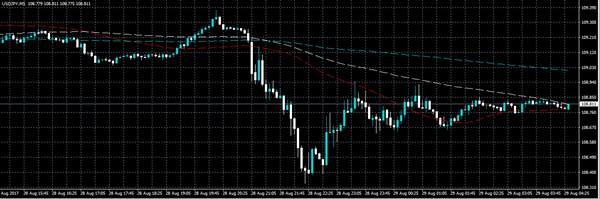
From a technical perspective, the USDJPY remains strongly bearish below the 109 level, with traders now watching higher-time frame price closes below the 108.60 support level.
Key technical support below the 108.60 level is found at, 108.33, the April 17th price low, at 108.13, and the 61.8 percent Fibonacci retracement of the 118.66 swing high to the 98.99 swing low, at 106.60.
To the upside, key intraday resistance for the USDJPY pair is found at the daily pivot point, at 108.99. Above the 109 level, the 50-hour moving average is located, at 109.20, with the weekly pivot point just above, at 109.28.
Trade Idea : USD/JPY – Sell at 109.15
USD/JPY - 108.62
Most recent candlesticks pattern : N/A
Trend : Near term down
Tenkan-Sen level : 108.76
Kijun-Sen level : 108.87
Ichimoku cloud top : 109.44
Ichimoku cloud bottom : 109.32
Original strategy :
Bought at 109.25, stopped at 109.00
Position : - Long at 109.25
Target : -
Stop : - 109.00
New strategy :
Sell at 109.15, Target: 108.15, Stop: 109.50
Position : -
Target : -
Stop : -
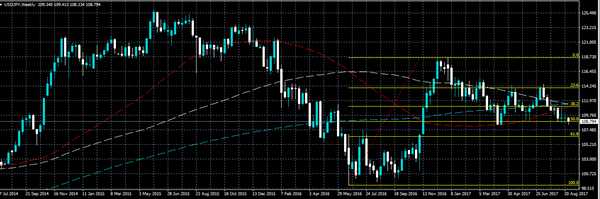
Dollar’s initial selloff below previous support at 108.60 signals recent decline from 114.50 is still in progress and further weakness to previous chart support at 108.13 (this year’s low) would be seen, break there would confirm early decline from 118.66 top has resumed and bring subsequent fall to 108.05-06 (50% projection of 114.50-108.73 measuring from 110.95) but reckon near term oversold condition would limit downside to 117.70 and 117.35-40 (61.8% projection) would hold from here, bring rebound later.
In view of this, would not chase this fall here and would be prudent to sell dollar on subsequent rebound as resistance at 109.41 (yesterday’s high) would cap upside and bring another decline. Only break of resistance at 109.85 would abort and signal a temporary low is formed instead.

EURO Edges Closer To 1.20 Level
The euro has moved to yet another 2017 trading high against the U.S dollar, hitting 1.1986 in late Monday trading, with price edging ever closer to the psychological 1.20 level.
In early Tuesday trading, the EURUSD pair is trading around the 1.1970 region, finding support from 1.1955 level. The single currency now looks poised to move above for the key 1.20 level, for the first time since December 2014.
EURUSD traders should pay close attention to the continuing decline in the greenback, with the U.S dollar index now approaching historical support from the 91.62 level, which represents the ten-year time frame, 20 period moving average.
Key intraday technical resistance is found at the psychological 1.2000 level, with the 50 percent Fibonacci retracement of the all-time EURUSD price high to low, at 1.2030. The July 2012 monthly swing price low, also adds strong resistance, at 1.2041.
The daily pivot point offers support, at 1.1960, as does the former EURUSD swing price high, at 1.1910.
GBP/JPY Daily Outlook
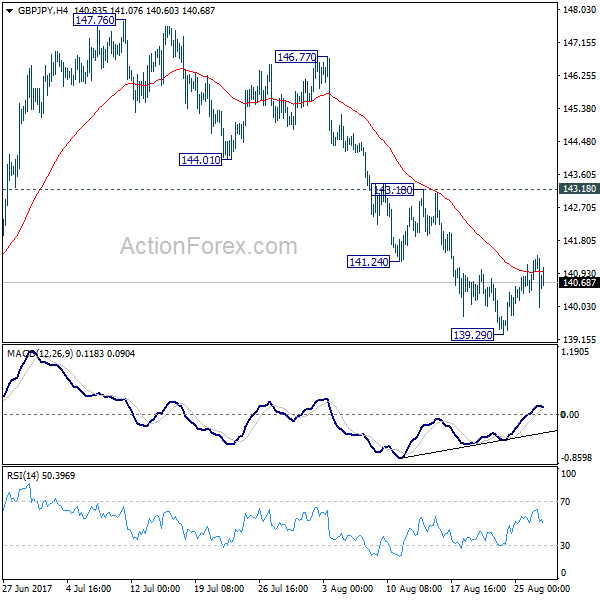
Daily Pivots: (S1) 140.66; (P) 141.04; (R1) 141.64; More
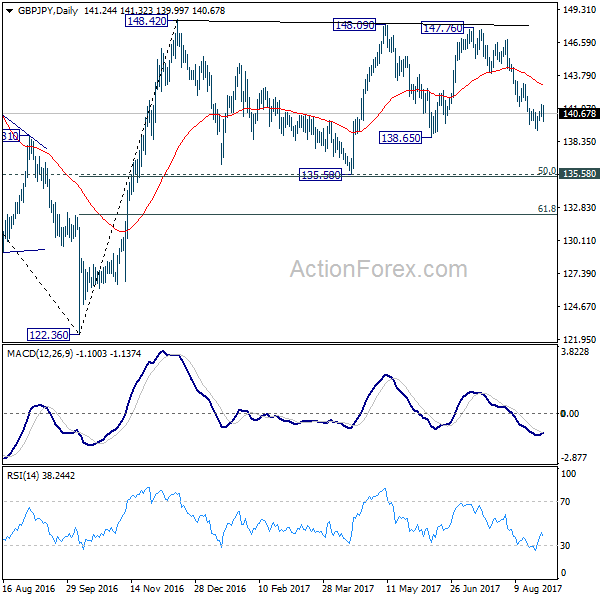
GBP/JPY is staying in consolidation above 139.29 temporary low and intraday bias remains neutral. Near term outlook stays bearish as long as 143.18 resistance holds and deeper decline is in favor. Below 139.29 will target 135.58 key support level. At this point, price actions from 148.42 are seen as a sideway consolidation pattern. Hence, we'll expect strong support from 135.58 to contain downside and bring rebound. Meanwhile, break of 143.18 will indicate short term reversal and turn bias back to the upside.
In the bigger picture, the sideway pattern from 148.42 is extending with another leg. We'd expect strong support from 135.58 and 50% retracement of 122.36 to 148.42 at 135.39 to contain downside. Medium term rise from 122.36 is still expected to resume later. And break of 38.2% retracement of 196.85 to 122.36 at 150.43 will carry long term bullish implications. However, firm break of 135.58/39 will dampen the bullish view and turn focus back to 122.36 low.
Tuesday’s Session Sees Calm Before The Storm
From a data perspective, Tuesday has only a small handful of releases that could impact the financial markets. That will change in a hurry on Wednesday and for the remainder of the week leading up to the penultimate US nonfarm payrolls on Friday.
The first major report of the day will be released at 06:00 GMT when GfK reports on German consumer confidence. The forward-looking indicator is expected to remain unchanged for the month of September.
Later in the European morning, France will unveil revised second quarter GDP data, as well as the latest consumer spending figures.
In North America, Statistics Canada will report on industrial production at 12:30 GMT. The report could provide some direction for the Canadian dollar.
A half hour later, Standard & Poor's will release the S&P/Case-Shiller Home Prices Indices. The monthly indicator provides a snapshot of housing market conditions in the world's largest economy. Analysts are projecting year-over-year growth of 5.7%, following an identical increase the previous month.
Energy traders will also be keeping tabs on the American Petroleum Institute's weekly crude oil report, which will make its way through the financial markets at 20:30 GMT. The official inventory report courtesy of the US Energy Information Administration (EIA) will be unveiled the following morning.
The US dollar index plunged to 19-month lows on Monday, as the euro climbed to its highest level since January 2015. The dollar index (DXY), an exchange-weighted average of the greenback against a basket of six currencies, settled at 92.21 on Monday.
EUR/USD
The euro's dramatic rally reached a higher level on Monday, with the EUR/USD setting a new 31-month high. The pair came within a mere 18 pips of the all-important 1.20 level and was last seen trading at 1.1968. The common currency has broken sharply to the upside, and is testing immediate resistance at the psychological 1.20 barrier. Above that level, traders are eyeing the July 2012 high of 1.2042. On the opposite side of the spectrum, support lies at 1.1960, followed by the daily low of 1.1915.
GBP/USD
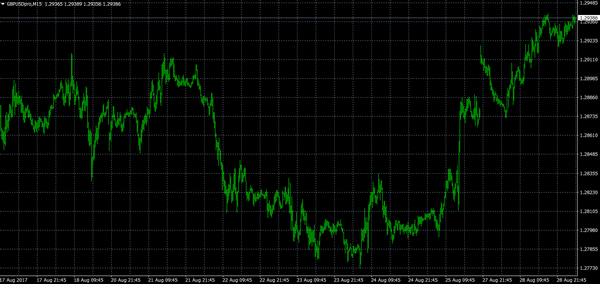
The British pound also participated in the uptrend on Monday. Cable was last seen trading near multiweek highs at 1.2938. The pair is trading above the 55-day moving average of 1.2929. Over the medium term, prices are expected to face downward pressure. Immediate resistance sits at 1.3126, according to analysts at Commerzbank. On the flipside, the 1.2775 provides a strong support zone.
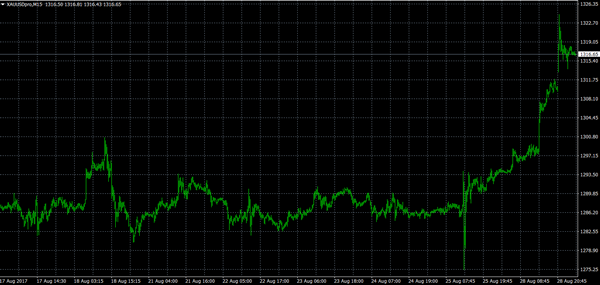
GOLD
A weak dollar triggered a massive rally in precious metals on Monday, with gold prices reaching their highest level since September 2016. Bullion continued higher in the Asian session, where it approached $1,320.00 a troy ounce. Risk sentiment will continue to bolster precious metals in the medium term.
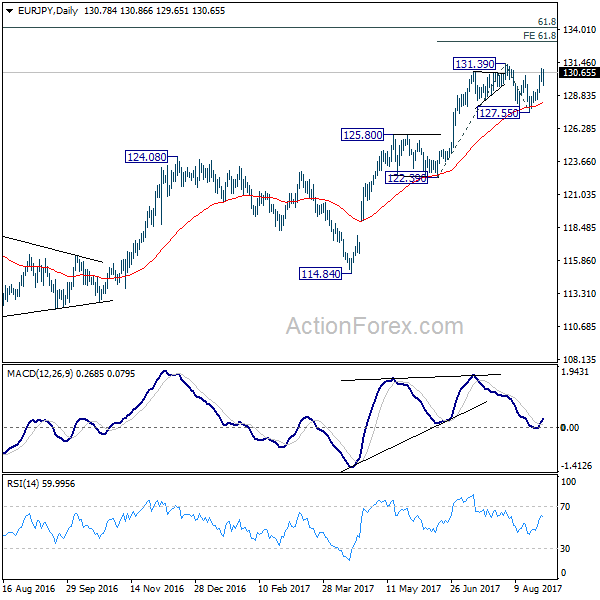
EUR/JPY Daily Outlook
Daily Pivots: (S1) 130.22; (P) 130.60; (R1) 131.22; More...
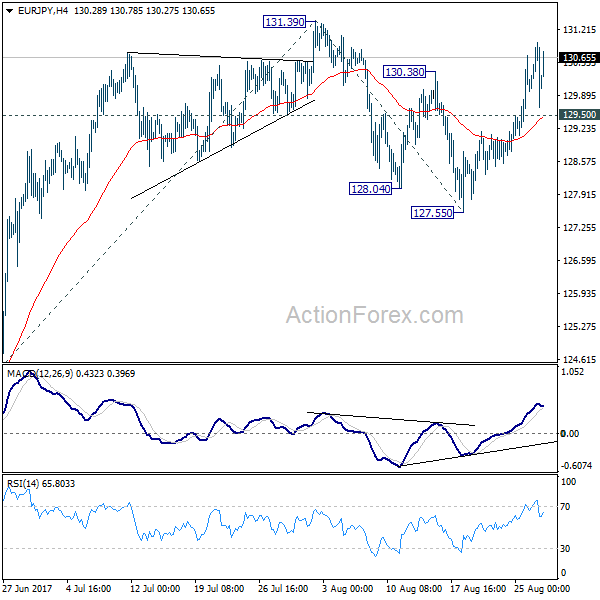
Intraday bias in EUR/JPY remains on the upside for 131.39 high. Correction from 131.39 has completed at 127.55 already, after hitting 55 day EMA. Firm break of 131.39 will resume larger rally and target 61.8% projection of 122.39 to 131.39 from 127.55 at 133.11 next. On the downside, below 129.10 minor support will dampen this bullish view and turn focus back to 127.55 support instead.
In the bigger picture, the down trend from 149.76 (2014 high) is completed at 109.03 (2016 low). Current rally from 109.03 should be at the same degree as the fall from 149.76 to 109.03. Further rise is expected to 61.8% retracement of 149.76 to 109.03 at 134.20. Sustained break there will pave the way to key long term resistance zone at 141.04/149.76. Medium term outlook will remain bullish as long as 124.08 resistance turned support holds. However, firm break of 124.08 will argue that rise from 109.03 is completed and turn outlook bearish.
Forex Technical Analysis: EUR/USD, USD/JPY, GBP/USD
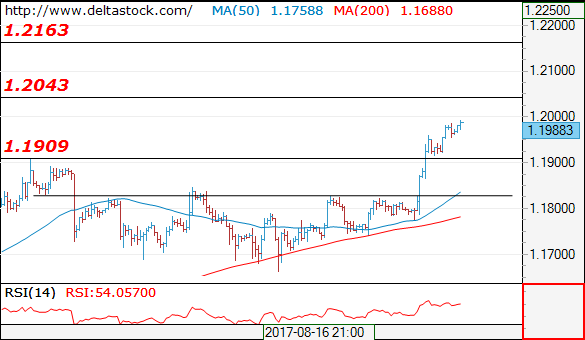
EUR/USD
Current level - 1.1988
The uptrend is absolutely intact, heading towards 1.2040, en route to 1.2160 area. Key static support lies at 1.1909.
| Resistance | Support | ||
| intraday | intraweek | intraday | intraweek |
| 1.2040 | 1.2040 | 1.1909 | 1.1830 |
| 1.2160 | 1.2160 | 1.1830 | 1.1580 |
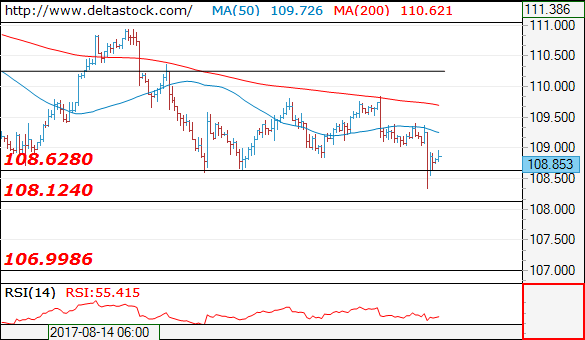
USD/JPY
Current level - 108.85
The bias is bearish below 109.00 minor resistance, for a slide towards 108.10, en route to 107.00 area. Crucial on the upside is 109.40.
| Resistance | Support | ||
| intraday | intraweek | intraday | intraweek |
| 109.00 | 111.00 | 108.10 | 108.10 |
| 109.80 | 112.20 | 107.00 | 107.00 |
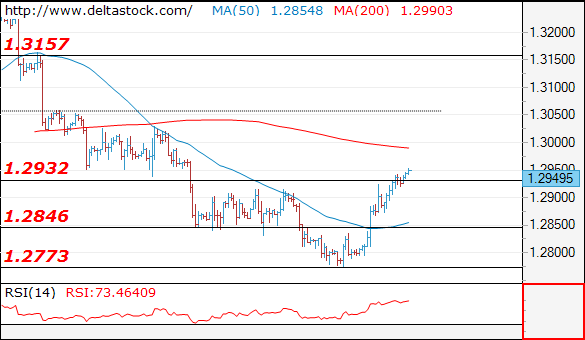
GBP/USD
Current level - 1.2945
My outlook here remains bullish, for a rise towards 1.3050, en route to 1.3160. Key support is projected at 1.2846.
| Resistance | Support | ||
| intraday | intraweek | intraday | intraweek |
| 1.3050 | 1.3157 | 1.2846 | 1.2773 |
| 1.3160 | 1.3260 | 1.2773 | 1.2606 |
British Pound On Recovery Mode Vs Japanese Yen
Key Highlights
- The British Pound after declining towards 139.50 against the Japanese Yen found support.
- The GBPJPY pair broke a major bearish trend line at 140.20 on the 4-hours chart to initiate a recovery.
- Japan's Unemployment Rate remained at 2.8% in July 2017.
- The Jobs to application ratio in July 2017 increased from the last reading of 1.51 to 1.52.
GBP/JPY Technical Analysis
The British Pound declined heavily during the past few weeks and traded as low as 139.32 against the Japanese Yen. The GBP/JPY pair is currently recovering and might trade towards 141.70-142.00.
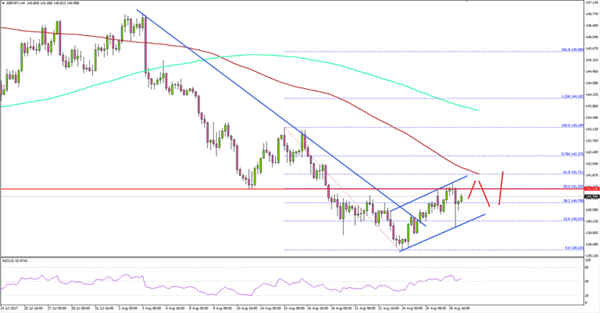
After trading as low as 139.32, the pair started correcting higher. During the upside move, it broke a major bearish trend line at 140.20 on the 4-hours chart. The pair also climbed above the 38.2% Fib retracement level of the last decline from the 143.18 high to 139.32 low.
An ascending channel with support at 140.20 is forming, which could take the pair higher. On the upside, an initial hurdle is near the 50% Fib retracement level of the last decline from the 143.18 high to 139.32 low.
Above 141.25, the channel resistance at 141.70 is positioned with the 100 simple moving average (H4). Therefore, it the pair extend gains, it is likely to face strong offers near 141.70 or 142.00. On the downside, the channel support at 140.20 is a key buy zone.
Japan's Unemployment Rate
Japan today saw the release of the Unemployment data for July 2017. The Unemployment Rate for July 2017 from the Ministry of Health, Labour and welfare (published by the Japan Statistics Bureau) posted no change from the last 2.8%.
On the other hand, the Jobs to application ratio in July 2017 rose from the last reading of 1.51 to 1.52. Looking at the number of employed persons in July 2017, there was a rise of 590 thousand (+0.9%) in the count to 65.63 million compared with the same month a year ago.
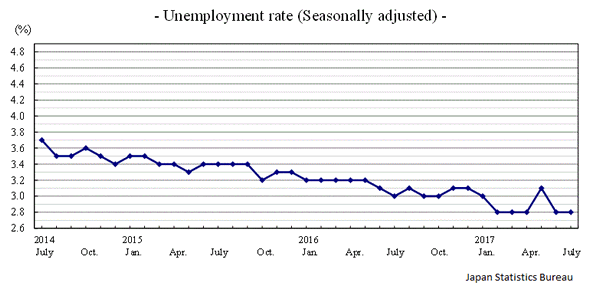
Furthermore, the number of unemployed persons in July 2017 were down by 120 thousand (5.9%) to 1.91 million compared with the same month a year ago.
Overall, there are chances of GBP/JPY moving higher towards 141.70 as long as the 140.20 support is intact.