Sample Category Title
Trade Idea: AUD/USD – Hold long entered at 0.7895
AUD/USD – 0.7954
Original strategy :
Bought at 0.7895, Target: 0.8050, Stop: 0.7865
Position: - Long at 0.7895
Target: - 0.8050
Stop: - 0.7865
New strategy :
Hold long entered at 0.7895, Target: 0.8050, Stop: 0.7900
Position: - Long at 0.7895
Target: - 0.8050
Stop:- 0.7900
Although the pair retreated yesterday from 0.7973, as aussie found renewed buying interest at 0.7905 and has rebounded, retaining our near term bullishness and consolidation with upside bias remains for another rebound, above said resistance at 0.7973 would add credence to our view that low has possibly been formed at 0.7808 earlier this month, bring a stronger rebound to 0.8000, however, break there is needed to signal the pullback from 0.8066 top (wave iii peak) has ended at 0.7808 (wave iv) and bring eventual retest of this level.
In view of this, we are holding on to our long position entered at 0.7895. Below said support at 0.7905 would risk test of indicated previous support at 0.7865-67, break there would dampen this bullish scenario and suggest the rebound from 0.9808 has ended, bring another test of this level, below there would signal the wave iv correction from 0.8066 is still in progress for weakness to 0.7786 support, however, oversold condition should prevent sharp fall below 0.7750 and price should stay above i top at 0.7712, bring rebound later. We are keeping our latest bullish count that recent impulsive waves is unfolding as (1 2, (i)(ii), i ii) and may extend headway towards 0.8150.
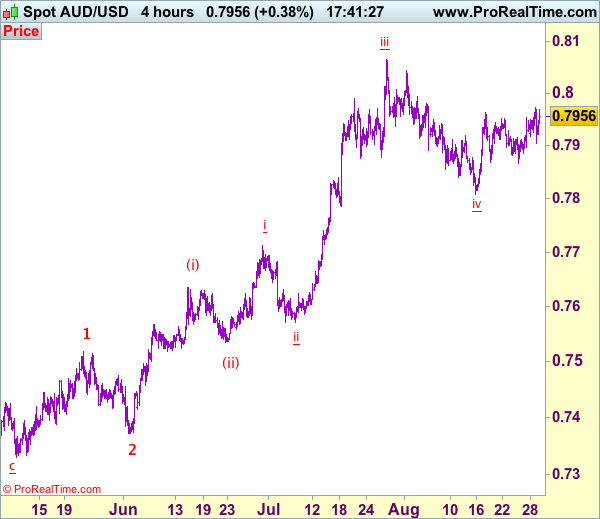
On the 4-hour chart, the move from 0.8066 is the wave 5 with i: 0.8860, ii: 0.8315, wave iii is an extended move ended at 1.0183, iv: 0.9706 and wave v has ended at 1.1081 (also the top of entire wave 5). The subsequent selloff is the major correction which is unfolding as ABC-X-ABC and 2nd A leg has ended at 0.8848, followed by a-b-c wave B which ended at 0.9758, hence, 2nd C wave is now in progress and indicated downside target at 0.7000 and 0.6950 had been met, so further fall to 0.6710-20 cannot be ruled out.
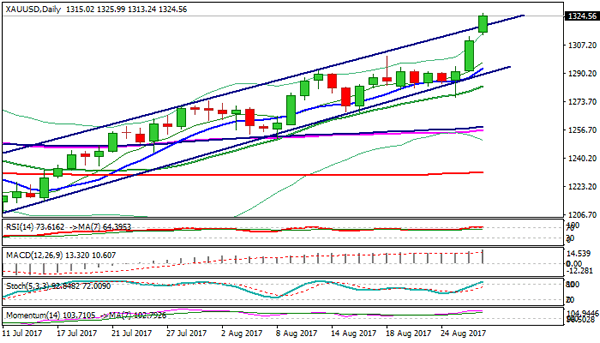
Technical Outlook: Spot Gold – Fresh Bullish Acceleration Eyes Next Target At $1337
Spot Gold extends strong bullish acceleration from Monday which resulted in eventual break above key $1300 barrier. The yellow metal received fresh boost from deteriorating geopolitical situation over North Korea that strongly increased demand for safe-haven assets.
Yesterday's close above $1300 barrier was strong bullish signal for today's fresh bullish acceleration which extended above initial target at $1315 and broke above bull-channel upper boundary at $1319, to meet next target at $1325 (Fibo 200% projection of the upleg from $1276). Bulls are eyeing next barrier at $1337(09 Sep 2016 spike high).
Strong bullish sentiment continues to drive the price higher, ignoring overbought conditions of daily studies, which suggest corrective action that could be expected in coming sessions.
Res: 1331, 1337, 1343, 1352
Sup: 1319, 1313, 1300, 1296
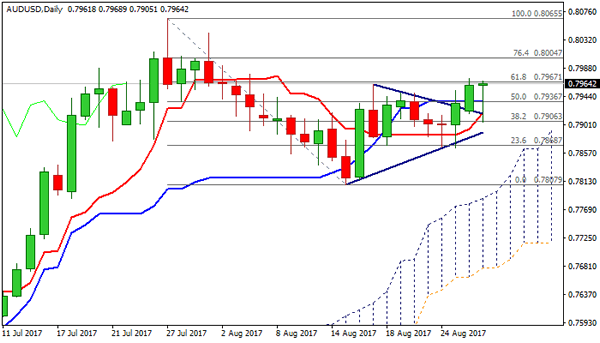
Technical Outlook: Fresh Strength Looks For Clear Break Above Key Fibo 61.8% Barrier At 0.7967
The Aussie dollar regained traction and recovered the most of overnight's losses, maintaining overall bullish tone. Strong two-day bullish acceleration was capped by Fibo 61.8% of 0.8065/0.7807 pullback at 0.7970 zone yesterday, with overnight's pullback triggered by North Korea news, as strong sales of AUDJPY dragged lower the AUDUSD pair. Dip was contained by the base of thickening hourly cloud which continues to underpin recovery which returned near yesterday's high and neutralized downside threats. However, break and close above Fibo barrier at 0.7967 is required to confirm bullish continuation towards 0.80000/65 targets, signaled by yesterday's break above the triangle pattern. Meanwhile, overbought slow stochastic on daily chart may trigger extended consolidation before bulls resume. Plethora of strong supports at 0.7930 zone, comprising of hourly cloud top / converged 10/30SMA's and daily Tenkan-sen, should keep the downside protected.
Res: 0.7973, 0.8000, 0.8042, 0.8065
Sup: 0.7936, 0.7927, 0.7905, 0.7864
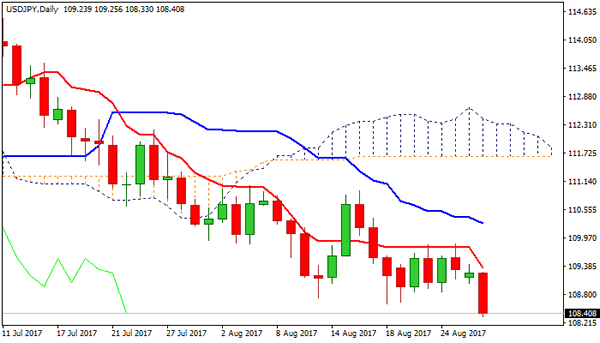
Technical Outlook: USDJPY – Fresh weakness eyes key support at 108.11 (2017 low)
The pair fell to fresh multi-month low at 108.33 overnight, as rising geopolitical tensions put the greenback under pressure. Break below supports at 108.70/60 zone which kept downside attempts in past two weeks limited, opens way towards key med-term support at 108.11 (2017 low posted on 17 Apr). Sustained break here would generate strong bearish signal for continuation of larger downtrend from 118.66 (15 Dec 2016 peak). Strong bearish sentiment and firmly bearish technical studies are supportive for further weakness, however, hesitation ahead of 108.11 pivot could be anticipated. Daily cloud is going to twist next week and may attract for some corrective action before final push through 108.11 trigger. Former lows at 108.60/70 now act as immediate barriers, followed by falling 10SMA (109.30) and 20SMA (109.70) which should cap extended upticks.
Res: 108.70, 109.00, 109.70, 110.00
Sup: 108.11, 107.49, 107.00, 106.71
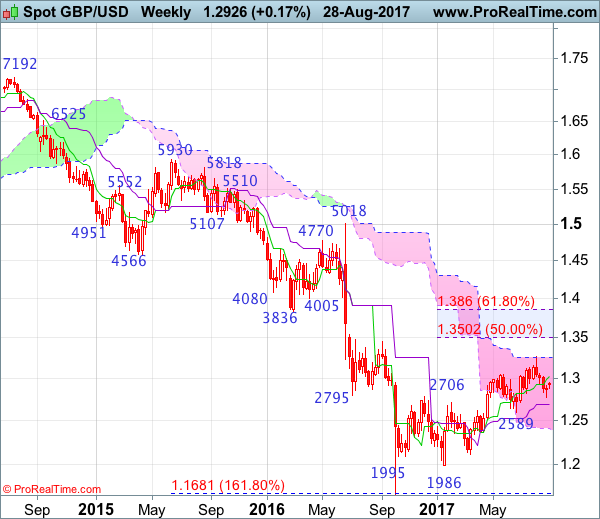
GBP/USD Candlesticks and Ichimoku Analysis
Weekly
• Last Candlesticks pattern: Long white candlestick
• Time of formation: 16 Jan 2017
• Trend bias: Down
Daily
• Last Candlesticks pattern: Long white candlestick
• Time of formation: 18 Apr 2017
• Trend bias: Near term up
GBP/USD – 1.2963
As cable found good support at 1.2774 and has staged a strong rebound, suggesting decline from 1.3269 has formed a temporary low there, hence consolidation with upside bias is seen for gain to the Kijun-Sen (now at 1.3020), however, upside should be limited to 1.3032 resistance and reckon 1.3080 (61.8% Fibonacci retracement of 1.3269-1.2774) would hold, bring retreat later to 1.2900, then 1.2870-75, having said that, said support at 1.2774 should continue to hold and bring another rebound later.
On the upside, whilst initial recovery to the Kijun-Sen (now at 1.3020) cannot be ruled out, reckon upside would be limited to 1.3050-55 and dynamic resistance at 1.3080 (61.8% Fibonacci retracement of 1.3269-1.2774) should hold, bring retreat later. A daily close above 1.3080 would risk a stronger rebound to 1.3120 and possibly towards 1.3165-70, however, we are keeping our view that a temporary top has been formed at 1.3269 earlier this month, reckon upside would be limited to 1.3200 and price should falter well below said resistance, bring another corrective decline later.
Recommendation: Sell at 1.3050 for 1.2850 with stop above 1.3150 or buy at 1.2875 for 1.3020 with stop below 1.2775.
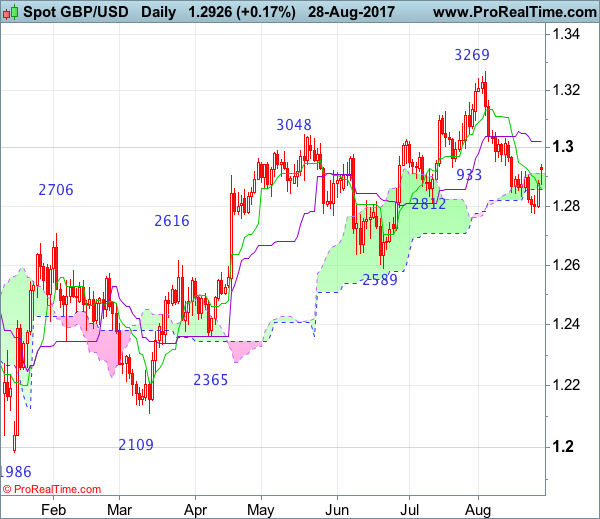
On the weekly chart, as the British pound has rebounded on back of the rally in euro, suggesting first leg of decline from 1.3269 top has ended at 1.2774, hence initial upside bias is seen for the rebound from 1.2774 to extend gain to the Tenkan-Sen (now at 1.3021), however, reckon upside would be limited to 1.3080 (61.8% Fibonacci retracement of 1.3269-1.2774) and price should falter below 1.3165-70, bring another decline later, above there would bring a retest of 1.3269 but only break there would shift risk back to upside and extend early erratic rise from 1.1986 low to 1.3330-40 and later towards 1.3400-10.
On the downside, expect pullback to be limited to 1.2900 and cable should find renewed buying interest at 1.2873, bring another rebound later. Below 1.2800 would bring retest of 1.2774, break there would signal the fall from 1.3269 top is still in progress for retracement of recent upmove to the Kijun-Sen (now at 1.2689), however, reckon downside would be limited to previous support at 1.2589 and bring rebound later. Looking ahead, only a sustained breach below 1.2589 would signal the entire correction from 1.1986 has ended at 1.3269, bring further decline to 1.2500, then towards support at 1.2365.
USD/CHF Candlesticks and Ichimoku Analysis
Weekly
• Last Candlesticks pattern: Shooting star
• Time of formation: 7 Mar 2017
• Trend bias: Sideways
Daily
• Last Candlesticks pattern: Morning star
• Time of formation: 9 May 2017
• Trend bias: Near term up
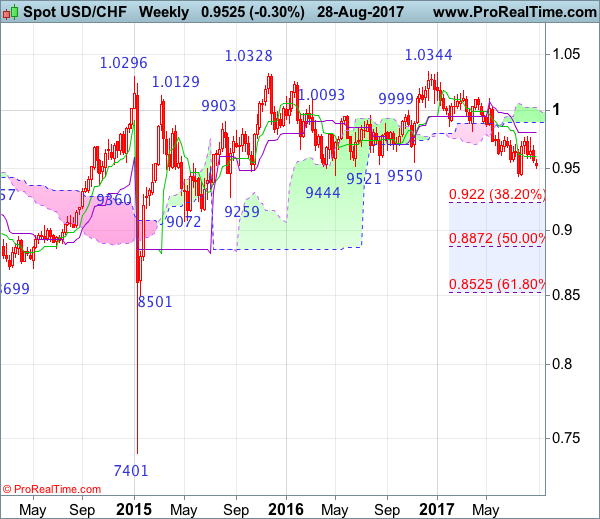
USD/CHF – 0.9468
As the greenback has remained under pressure after breaking below indicated previous support at 0.9583, adding credence to our bearish view that the erratic decline from 0.9773 is still in progress, hence test of another previous support at 0.9438 would be seen, break there would signal early fall from 1.0344 (2016 high) has resumed and extend weakness to 0.9390-00, then towards 0.9330-35, having said that, near term oversold condition should prevent sharp fall below previous support at 0.9259 and reckon 0.9220 (38.2% Fibonacci retracement of entire rise from 0.7401-1.0344) would hold, risk from there is seen for a rebound to take place later.
On the upside, whilst recovery to 0.9530-40 cannot be ruled out, said previous support at 0.9583 should turn into resistance and limit dollar’s upside and bring another decline to aforesaid downside targets. Above 0.9620 would defer and risk a stronger rebound to 0.9663 and possibly test of resistance at 0.9698, however, upside should still be limited and price should falter below said resistance at 0.9773, bring another selloff next month.
Recommendation: Sell at 0.9520 for 0.9320 with stop above 0.9620
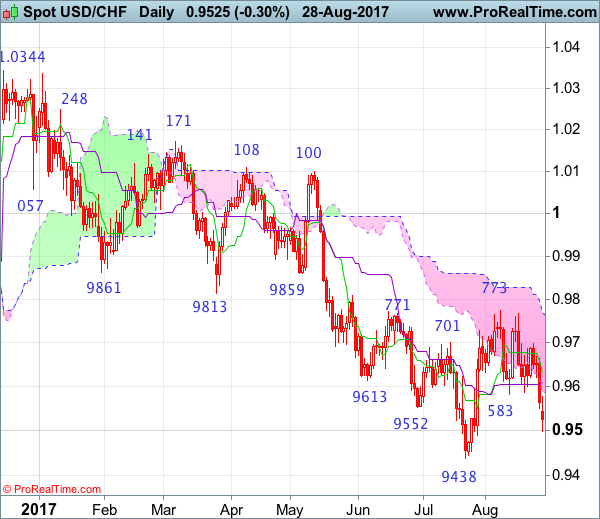
On the weekly chart, the greenback opened lower this week after breaking below previous support at 0.9583, suggesting the erratic decline from 1.0344 top has resumed and break of another previous support at 0.9438 would confirm and extend the aforesaid fall for further weakness to 0.9350, then towards previous support at 0.9259, however, near term oversold condition should prevent sharp fall below 0.9220 (38.2% Fibonacci retracement of 0.7401-1.0344) and reckon 0.9150 would hold from here, risk from there is seen for a rebound later.
On the upside, expect recovery to be limited to 0.9530-40 and said previous support at 0.9583 should turn into resistance and limit upside. A weekly close above the Tenkan-Sen (now at 0.9606) would defer and risk a stronger recovery to 0.9698 resistance, however, still reckon upside would be limited and resistance at 0.9773 should remain intact, bring another decline. Only a break of the Kijun-Sen (now at 0.9805) would abort and signal a temporary low is formed instead, bring a stronger rebound to the lower Kumo (now at 0.9894) but upside should be limited to the upper Kumo (now at 1.0023), price should falter well below resistance at 1.0100.
Geopolitics Reignites Risk Off Mode | Hurricane Harvey Impacting Oil And Dollar
Oil And Dollar To Gain From Harvey
More Bullish Move Still On Cards
Stock markets have rattled over in Asia and things are looking ugly over in Europe as well. It is a risk off mode and safe havens such as gold and the Japanese Yen extended their gains due to the recent escalation of tensions over in Asia. Investors have panicked after the North Korean missiles have flown over Japan and the president of Japan has called the action reckless. The Asian markets have felt the pain of this event and we are expecting this pain to become even starker as the counter-reaction from the US would make investors only more nervous. Statements such as "fire and fury" are the most worrying.
US futures are trading sharply lower because investors are either staying on the side lines for this dust to settle or are booking their gains.
Oil And Dollar To Gain From Harvey
The effects of Hurricane Harvey are still going to remain prominent as the flooding process continues over in the US. Less and less refineries can work and this is pushing the price of the refined products higher. Both Brent and crude oil are still holding on to their gains and we still do expect them to score more gains.
In currencies, the dollar weakness continues and the aftermath of the Jackson Hole meeting is still very much influencing the price of the dollar index. The index is more likely to continue its journey to the 91 mark and the Euro-dollar pair could touch the likes of 1.25 by the end of the third quarter.
Hurricane Harvey is going to have some serious economic impact and just how large that would be is still unclear. However, the upcoming jobs reports are likely to show one element which is that more people would be filing for unemployment benefits. If history serves us correctly, it is that in the past when a similar catastrophe occurred, the initial jobless claims spiked in the following weeks. We need to have a strong number when it comes to the labour market as that would continue to support the dollar but in the absence of such, it simply means more weakness for the dollar index.
More Bullish Move Still On Cards
The yellow metal has rallied to the highest point this year due to the geopolitical tensions and the dollar weakness. We have witnessed the highest intraday price level of 1322.41 which had not been seen since Nov 9. The price could easily touch the level of 1350 because the worst is still to come, which would be a reaction from the US. If North Korea decides to retaliate further to that reaction, it would only add fuel to the fire.
Another Wave Of Escalation In North Korean Crisis
This morning, North Korea fired what was likely to have been an intermediate range ballistic missile over Japan into the Pacific. After a short period of calm, the North Korean crisis is again escalating.
How serious is this? The missile test is clearly a strengthening show of force from North Korea to show it is not bending to US demands. That the missile is flying over Japanese territory is a clear provocation, although not the first time it has happened. As recently as 2016, North Korea fired a rocket over Okinawa. At the same time, North Korea did not go through with its plans to send the missiles close to the waters of Guam as indicated on 9 August. Kim Jong-un had said he was reconsidering this and the missiles into the Pacific could be seen as a moderation compared to the initial plans. Japanese Foreign Minister Taro Kono said the launch to the east rather than to the south towards Guam was a sign that Pyongyang had ‘flinched' in the face of US warnings.
North Korea had warned that the annual military exercises of US and South Korea taking place during these weeks would trigger a reaction. The so-called Ulchi-Freedom Guardian military exercises started earlier this month. It is not unusual that these exercises escalate tensions. Last year, North Korea launched a missile from a submarine around the time of the exercises and put its military on high alert. China asked the US and South Korea to suspend the drills this year in order to ease the conflict and pave the way for diplomatic talks.
What's next? Following today's launch, Japan has asked the United Nations Security Council to hold an emergency meeting. More sanctions may be imposed but we still see war as a very low probability as the risks involved on both sides are simply too big. Ultimately, we believe that we will have talks between the involved parties. However, before this, both sides will need to illustrate a big show of force to strengthen the positon at the negotiating table. What the response might be from the US this time is not clear. However, a military strike does not seem likely.
A diplomatic solution will be difficult to find as it will involve on the one hand North Korean demanding an end to the annual military exercises, which will be difficult to obtain given that the US and South Korea see a big threat from North Korea. Similarly, the demand from the US for North Korea to back down from its nuclear ambition is also difficult as long as North Korea sees the US as a major threat. However, a diplomatic solution would be the best outcome, as a military conflict would entail severe losses on both sides. The road will not be easy and we are likely to see continued waves of escalations before the parties are finally pushed to the negotiating table.
Market outlook. The markets reacted again with the usual safe haven flows sending equities and bond yields lower. Asian stocks took a hit again as after the recent escalation. However, things are likely to calm down again soon and markets will recover. Overall, though, the crisis is keeping risk appetite dented as long as we see these continued waves of escalation. In combination with the looming US debt limit deadline coming closer, there is a risk that markets will find it hard to gain real momentum despite positive growth numbers overall at the moment.
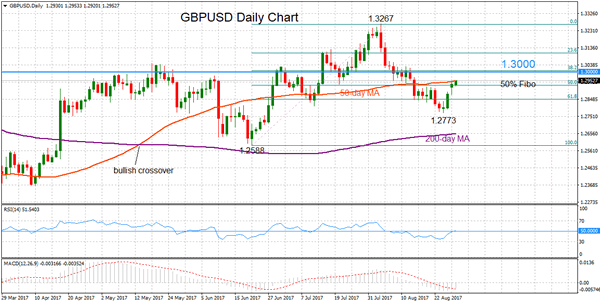
GBPUSD Tests 2-Week Highs, Neutral Outlook Remains For Medium-Term
GBPUSD is testing fresh 2-week highs at 1.2951. The pair has made a sharp recovery following a bounce from 1.2773 last week but has met resistance at the 50-day moving average (MA). The broader picture on the daily chart shows that the market is neutral.
GBPUSD is currently at a critical level with immediate support at 1.2925 – the 50% Fibonacci retracement level of the upleg from 1.2588 to 1.3267. As long as resistance holds at the 50-day MA, prices are expected to resume the downtrend from 1.3267 (August 3 high).
A move below 1.2925 would shift focus to the downside to target 1.2773 (August 24 low) and from here the next target would be the 200-day MA at 1.2655 before reaching 1.2588 (June 21 low). Such a move would shift the medium-term outlook from neutral to bearish.
Alternatively, a sustained move above the current level of the 50-day MA at 1.2953 would target the key psychological level at 1.3000. This would favor further strength with the potential to re-test the August 3 peak at 1.3267.
The neutral outlook for the medium-term is expected to hold as long as GBPUSD remains capped by the 50-day MA and if upside momentum fades. RSI has been rising towards the 50 level. A continued move higher by the indicator into bullish territory would indicate risk is to the upside for GBPUSD.
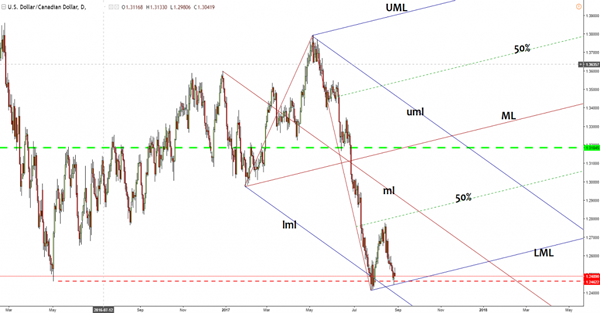
USD/CAD Another Leg Higher?
USD/CAD decreased again in the last hours and erased the early morning gains, could come back down to retest the 1.2460 static support. I’ve drawn an ascending pitchfork hoping that I’ll catch another leg higher. Price has come down and retested the lower median line (LML) and closed much above it, signaling a rebound. Only a valid breakdown below the LML will confirma further drop in the upcoming period.