Sample Category Title
Trade Idea: EUR/JPY – Stand aside
EUR/JPY - 129.35
New strategy :
Stand aside
Position: -
Target: -
Stop:-
Although the single currency has continued edging higher after staging a rebound from 127.56 last week and near term upside risk remains for gain to 129.60-70, reckon upside would be limited to 130.00 and only a break of indicated resistance at 130.40 would revive bullishness and signal the fall from 131.40 has ended, then headway to 130.90-00 would follow.
On the downside, whilst pullback to 128.90-00 cannot be ruled out, reckon 128.50-55 would hold and bring another rebound. Below 128.30-35 support would suggest the rebound from 127.56 has ended, bring weakness to 128.10-15, however, break of support at 127.84 is needed to confirm and bring retest of this level, break there would signal the fall from 131.40 top has resumed for retracement of early upmove to 127.00, then towards 126.50-60. As near term outlook is mixed, would be prudent to stand aside for now.
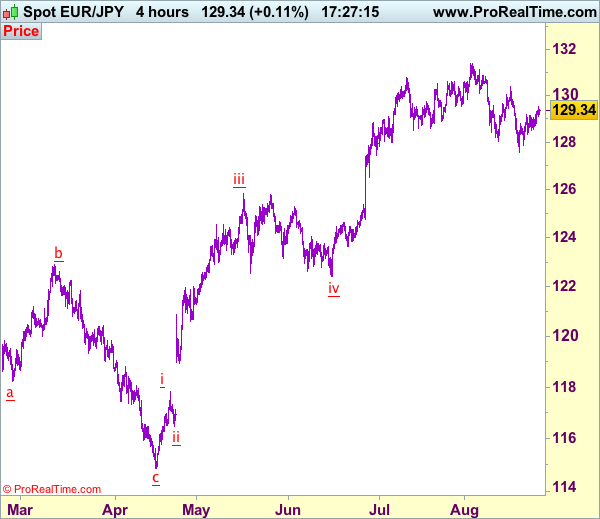
Our latest preferred count is that wave (ii) is ABC-X-ABC which ended at 123.33 and wave (iii) is unfolding with wave iii ended at 100.77, followed by wave iv at 111.57 and wave v as well as the wave (iii) has ended at 97.04, followed by wave (iv) at 111.43 and wave (v) has ended at 94.12 which is also the end of the larger degree v, this also implied the major wave (C) has also ended there, hence major correction has commenced from there with (A) leg unfolding in its lower degree wave c which has possibly ended at 145.69. Under this count, A-B-C wave (B) has commenced with A leg ended at 136.23, wave B at 143.79 and wave C has possibly ended at 149.79.
Our larger degree count is that the decline from 139.26 is wave (C) and is sub-divided into a diagonal triangle i-ii-iii-iv-v with wave i - 105.44, wave ii- 123.33, wave iii - 97.03, wave iv - 111.43, followed by the final wave v as well as the end of wave (C) at 94.12, this also mark the bottom of larger degree wave B. Under this count, major rise in wave C has commenced as an impulsive wave with minor wave III ended at 145.69, wave V is still in progress for further gain to 150.00. Having said that, this so-called wave V could well be the first leg of larger degree 5-waver wave C and this wave C should bring at least a retest of wave A top at 169.97 (July 2008).
Trade Idea: AUD/USD – Hold long entered at 0.7895
AUD/USD – 0.7913
Recent wave: Wave 5 ended at 1.1081 and major correction has commenced for fall to 0.7000 and then towards 0.6500-10
Trend: Near term up
Original strategy :
Bought at 0.7895, Target: 0.8050, Stop: 0.7865
Position: - Long at 0.7895
Target: - 0.8050
Stop: - 0.7865
New strategy :
Hold long entered at 0.7895, Target: 0.8050, Stop: 0.7865
Position: - Long at 0.7895
Target: - 0.8050
Stop:- 0.7835
Although aussie slipped briefly to 0.7867, the subsequent rebound has retained our near term bullishness and consolidation with upside bias remains for another rebound to indicated resistance at 0.7963, break there would add credence to our view that low has possibly been formed at 0.7808 early last week, bring a stronger rebound to 0.8000, however, break there is needed to signal the pullback from 0.8066 top (wave iii peak) has ended at 0.7808 (wave iv) and bring eventual retest of this level.
In view of this, we are holding on to our long position entered at 0.7895. Below said support at 0.7865-67 would dampen this bullish scenario and suggest the rebound from 0.9808 has ended, bring another test of this level, below there would signal the wave iv correction from 0.8066 is still in progress for weakness to 0.7786 support, however, oversold condition should prevent sharp fall below 0.7750 and price should stay above i top at 0.7712, bring rebound later. We are keeping our latest bullish count that recent impulsive waves is unfolding as (1 2, (i)(ii), i ii) and may extend headway towards 0.8150.
On the 4-hour chart, the move from 0.8066 is the wave 5 with i: 0.8860, ii: 0.8315, wave iii is an extended move ended at 1.0183, iv: 0.9706 and wave v has ended at 1.1081 (also the top of entire wave 5). The subsequent selloff is the major correction which is unfolding as ABC-X-ABC and 2nd A leg has ended at 0.8848, followed by a-b-c wave B which ended at 0.9758, hence, 2nd C wave is now in progress and indicated downside target at 0.7000 and 0.6950 had been met, so further fall to 0.6710-20 cannot be ruled out.

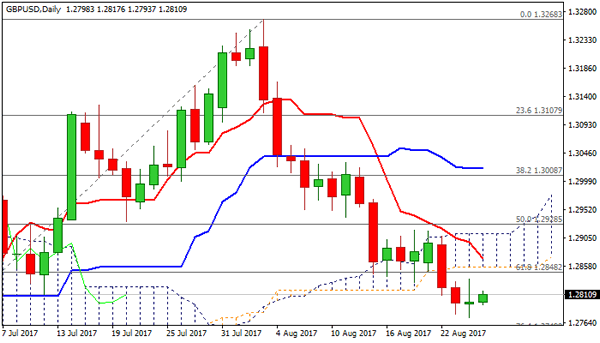
Technical Outlook: Cable – Fresh Selling Opportunities On Bounce Towards Cloud Base
Cable bounced above 1.2800 handle in early Friday's trading after Thursday's action ended in Doji candle and signaling larger bears may take a breather.
The notion is supported by oversold slow stochastic on daily chart, with today's bullish close needed to confirm.
Overall structure remains firmly bearish and sees upticks as selling opportunity for extension of larger downtrend towards targets at 1.2749 (Fibo 76.4% of 1.2588/1.3268), weekly Kijun-sen (1.2688) and 200SMA (1.2652).
Daily cloud base (1.2857) reinforced by falling 10SMA, marks solid resistance which is expected to cap recovery attempts.
Res: 1.2836, 1.2857, 1.2871, 1.2912
Sup: 1.2793, 1.2773, 1.2749, 1.2715
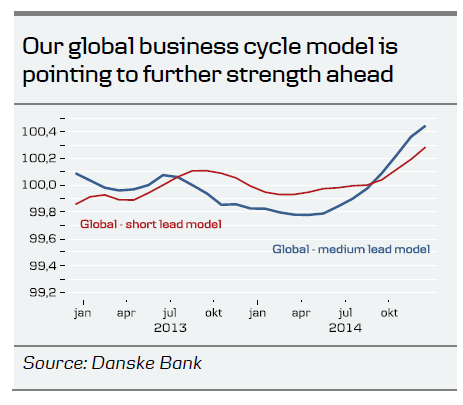
Strategy: How Mature Is The Global Business Cycle Really?
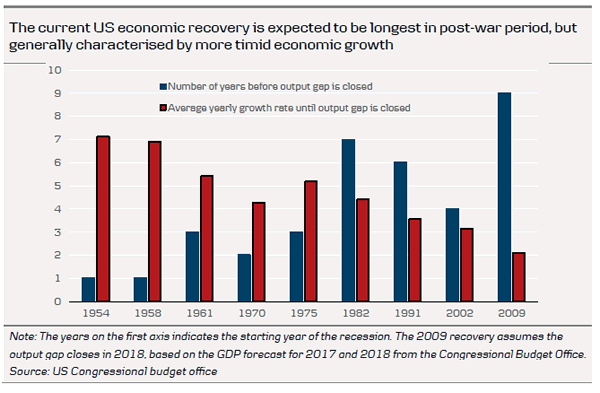
When the world central bank leaders meet at the Jackson Hole these days, they are faced with a unique situation: still, after years of recovery and despite sizeable political uncertainty in the US, global growth momentum seems to be getting stronger. The ongoing economic expansion in the US (which in one sense is more mature than the recovery in the euro area) has now lasted eight years, which makes it the third longest expansion of the post-war era. If it continues until spring 2019, which we think it could, it will be the longest non-stop economic expansion of the post-war period.
The economic expansion has been followed by a sizeable reduction in unemployment rates in key advanced economies such as the US, Germany, Sweden. Yet, inflation pressures in these countries remain relatively muted. As a result, central banks do not appear in a hurry to scale back the extraordinary monetary policy measures implemented over the past few years, which could put an end to the expansion. At the Jackson Hole meeting, we expect Fed Governor Janet Yellen to continue to signal a gradual tightening cycle, with the next rate hike likely to be in December, followed by one-two hikes next year. Similarly, as we have stated previously, Mario Draghi is likely to sound slightly on the dovish side, as he is wary of the impact of the stronger euro on inflation in the eurozone in coming years.
A key question is why the US recovery seems to be having a longer duration this time than in the past? Three features stand out: first, the depth of the crisis in 2008-09 was much greater than for most of the past recessions in the US; second, the US economy did not see as strong an immediate rebound as after other recessions. In the years since the crisis, the economy has expanded at a generally slower pace than in normal recovery phases, probably due to overinvestment prior to the crisis, need for deleveraging and a series of global shocks, such as the euro debt crisis, the oil price shock in 2014 and slowdown in Chinese growth in 2014-15. Finally, it is a fallacy that expansions die of old age, and monetary policy has not been as loose as perceived generally, as the neutral rate has declined as well.
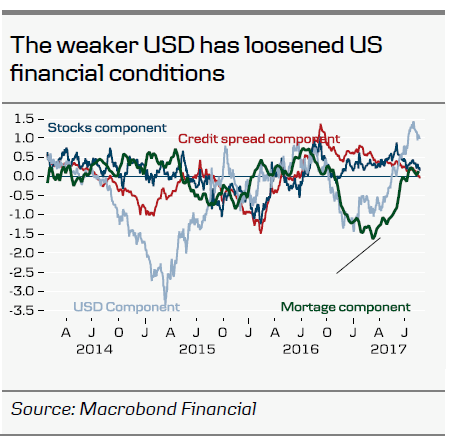
US growth is likely to be supported by the significant loosening of financial conditions, due especially to the weaker USD, while in Europe, the PMIs recently seemed to indicate that European companies are weathering the stronger euro. More globally, capex is set to add support to the global recovery as we pointed out in Strategy: Capex set to add support to global recovery, 4 August 2017.
What are the financial implications? Well, given that the economic expansion in the US and globally seems to have more legs and that global central banks do not appear to be in a hurry to tighten monetary policies as of yet, this will be supportive for risk assets. We see equities as a buy on dips currently, though we are more neutral further ahead. While we expect global bond yields to be in range for the next few months, we expect higher US yields as the output gap closes in 2018.
Expectations on Trump's growth-friendly policies at a minimum
Given that the Trump administration so far has failed to deliver on any significant part of its electoral promises, notably the repeal of Obamacare over the summer, we think most in the markets have lowered their expectations on any sizeable fiscal stimulus to a minimum. We have from the start been quite sceptical about both the timing and scale of these initiatives given the sizeable disagreement in the Republican Party. In June, we discounted any boost from Trump's growth-friendly policy agenda on economic growth in 2017-18. However, with the failure on repealing Obamacare, the Republicans in Congress and President Trump are doubling up on efforts to push tax cuts through. However, we remain sceptical that such an agreement can be found given the sizeable disagreement in the Republican Party regarding financing and in light of the upcoming difficult negotiations surrounding the debt ceiling, which may actually be a risk to global market risk sentiment.
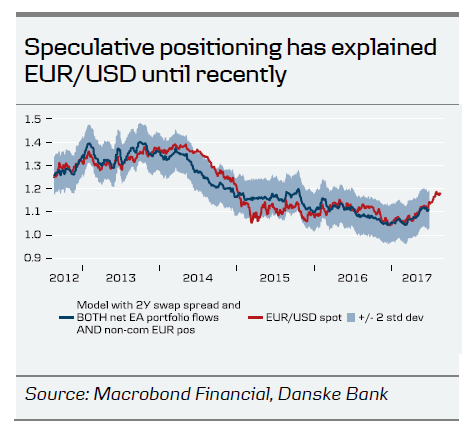
EUR/USD to stay in range near term, looking at 1.30 long term
One of the most striking features in the financial markets over the past months has been the rise in the EUR/USD. This week, we published a research note. digging a bit deeper into the reasons for the rise. One of our clear findings was that the recent optimism about the outlook for the euro area has spurred sizeable equity flows and speculative positioning, lending support to the euro. While we think that the EUR/USD will trade in range near term as these flows abate somewhat, we think the eventual pricing of an ECB exit and sizeable euro area current account surpluses will send the cross towards 1.30 in coming years. Hence, we recommend that clients with receivables in USD should look to hedge their exposure using longer-dated forwards and speculative investors to be long EUR/USD.
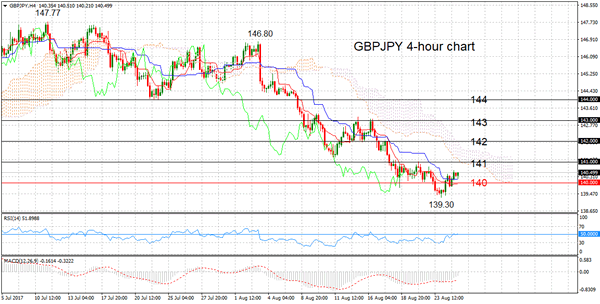
GBPJPY In Consolidation Phase Around 140 In Near-Term, Bearish Picture Below Ichimoku Cloud
GBPJPY remains under pressure but is consolidating around a key level at 140.00. The trend from early August turned increasingly bearish, with a sequence of lower highs and lower lows.
In the immediate term, momentum signals are neutral based on a lack of clear direction from the RSI and MACD. The flat Tenkan-sen and Kijun-sen lines are confirming a neutral phase the market has entered into now.
Near-term resistance is expected at the key 141.00 level. Breaking it would shift the focus to the upside to other key levels that would provide resistance at 142.00 and 143.00. A move to 144.00 would indicate a change from the bearish short-term market structure to a neutral-bullish one.
Immediate support lies at the key 140.00 level and from here the August 24 low of 139.30 is within sight. A break below this would risk pushing GBPJPY to levels last seen on June 12 at 138.66.
A deeper decline from 138.66 would shift the overall trend on the daily chart to bearish from neutral. The broader technical picture remains overwhelmingly bearish based on the alignment of daily trend and momentum indicators. The market is below the daily Ichimoku cloud and the Tenkan-sen is below the Kijun-sen line.
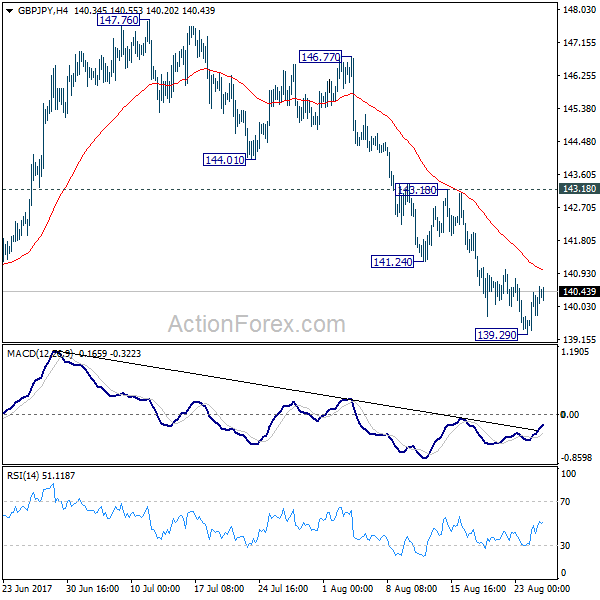
GBP/JPY Daily Outlook
Daily Pivots: (S1) 139.50; (P) 139.97; (R1) 140.66; More
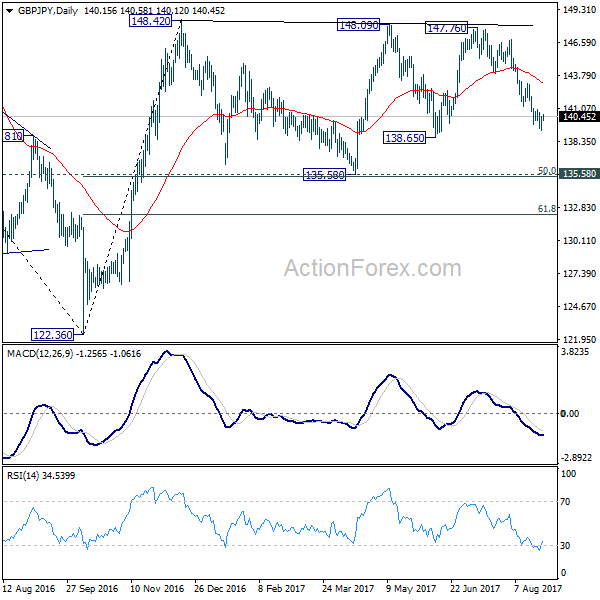
A temporary low is in place at 139.39 and intraday bias is turned neutral first. Deeper decline is mildly in favor as long as 143.18 resistance holds. Fall from 147.76 could extend through 138.65 support towards 135.58 key support level. At this point, price actions from 148.42 are seen as a sideway consolidation pattern. Hence, we'll expect strong support from 135.58 to contain downside and bring rebound. Meanwhile, break of 143.18 will indicate short term reversal and turn bias back to the upside.
In the bigger picture, the sideway pattern from 148.42 is extending with another leg. We'd expect strong support from 135.58 and 50% retracement of 122.36 to 148.42 at 135.39 to contain downside. Medium term rise from 122.36 is still expected to resume later. And break of 38.2% retracement of 196.85 to 122.36 at 150.43 will carry long term bullish implications. However, firm break of 135.58/39 will dampen the bullish view and turn focus back to 122.36 low.
EUR/JPY Daily Outlook
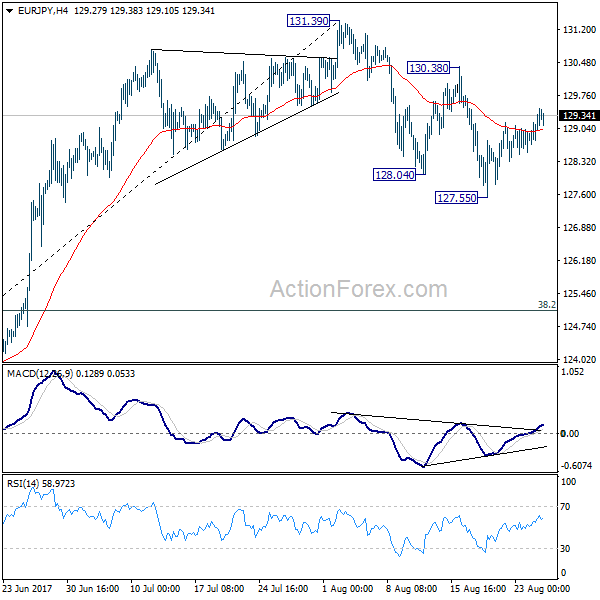
Intraday bias in EUR/JPY remains neutral for the moment. As long as 130.38 resistance holds, deeper decline is expected in the cross. As noted decline from 131.39 is seen as correcting whole rise from 141.84. Below 127.55 will target 38.2% retracement of 114.84 to 131.39 at 125.05. Nonetheless, break of 130.38 will argue that the pull back is completed and turn focus back to 131.39 high.
Daily Pivots: (S1) 128.73; (P) 129.04; (R1) 129.55; More...
Intraday bias in EUR/JPY remains neutral for the moment. As long as 130.38 resistance holds, deeper decline is expected in the cross. As noted decline from 131.39 is seen as correcting whole rise from 141.84. Below 127.55 will target 38.2% retracement of 114.84 to 131.39 at 125.05. Nonetheless, break of 130.38 will argue that the pull back is completed and turn focus back to 131.39 high.
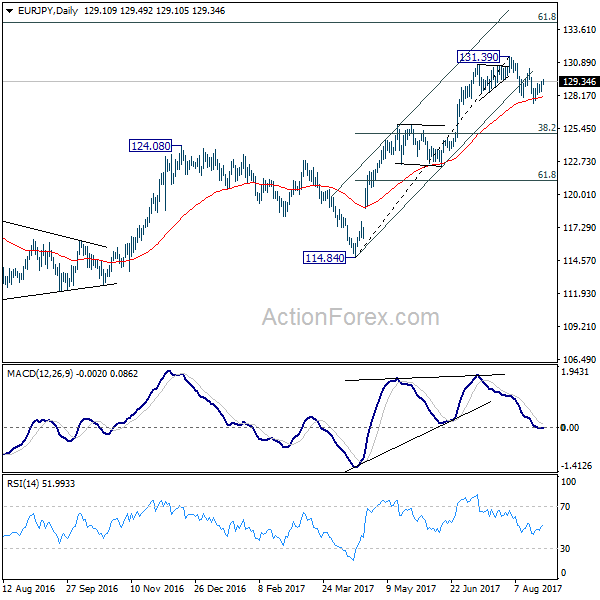
In the bigger picture, the down trend from 149.76 (2014 high) is completed at 109.03 (2016 low). Current rally from 109.03 should be at the same degree as the fall from 149.76 to 109.03. Further rise is expected to 61.8% retracement of 149.76 to 109.03 at 134.20. Sustained break there will pave the way to key long term resistance zone at 141.04/149.76. Medium term outlook will remain bullish as long as 124.08 resistance turned support holds. However, firm break of 124.08 will argue that rise from 109.03 is completed and turn outlook bearish.
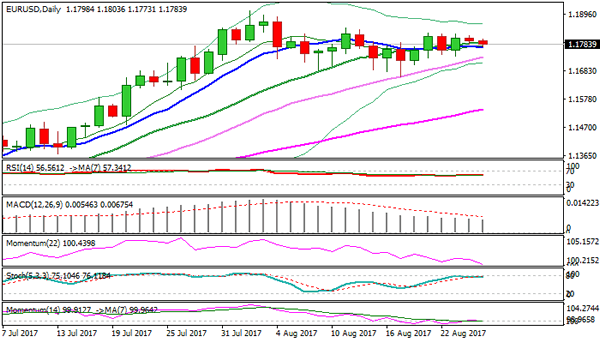
Technical Outlook: EURUSD – Draghi’s Speech In Jackson Hole Is The Key Event Today
The Euro holds within tight range for the second day, as focus turns on speeches of Fed chief Janet Yellen and ECB's Mario Draghi on Jackson Hole symposium, which are due later today.
Overall bullish structure remains intact and keeps focus at 1.2000 target, with recent pullback from 1.1910 high seen as correction of broader uptrend.
The Euro has been driven by strong bullish sentiment in the recent months and approached psychological 1.2000 barrier after key resistances at 1.1613 and 1.1712/35 (former tops of Aug 2015/May 2016 and Fibo 38.2% of larger 1.3992/1.0340 fall) have been taken out.
Weakening US dollar also helped the Euro's advance.
Traders are now looking for further signals from the ECB about the start of policy tightening and tapering QE programme.
It is important to mention that Mario Draghi has signaled the start of quantitative easing at his appearance at Jackson Hole three years ago. Draghi has laid the groundwork for the new program that was created to fight serious threats of deflation in the Eurozone, high unemployment and slow economic growth in the bloc.
The measures showed good results and eliminated those threats and the ECB can now start winding down the program.
However, most of observers and sources close to the ECB expect Draghi to stay on hold today, as bond-buying in past three years, worth 2 trillion Euros, gave good results, but stubbornly low inflation continues to worry ECB policymakers.
Draghi will try to avoid scenario of sending strong hawkish messages which could be misunderstood and trigger stronger movements in the market.
Possible scenarios on Draghi's comments today are for 1.2000+ rally in case of stronger hawkish tone from the ECB chief, which is quite unlikely, according to the expectations that Draghi will stick to the theme of the event: ‘Fostering a Dynamic Global Economy'.
On the other side, neutral/dovish tone from Draghi, which could be expected as ECB's chief wouldn't declare mission accomplished until all required parameters are positive (inflation is still well below target) would have negative impact on single currency's near-term action and send the price lower.
The EURUSD pair faces initial support at 1.1772 (10SMA), followed by rising 30SMA (1.1735) and key support at 1.1662 (17 Aug correction low).
Break of the latter would generate stronger bearish signal for extended pullback from 1.1910 (02 Aug high).
Bullish scenario sees lift above initial barriers at 1.1828/46 for retest of 1.1910 and final push towards 1.2000 target.
Res: 1.1803, 1.1828, 1.1846, 1.1910
Sup: 1.1772, 1.1735, 1.1708, 1.1662
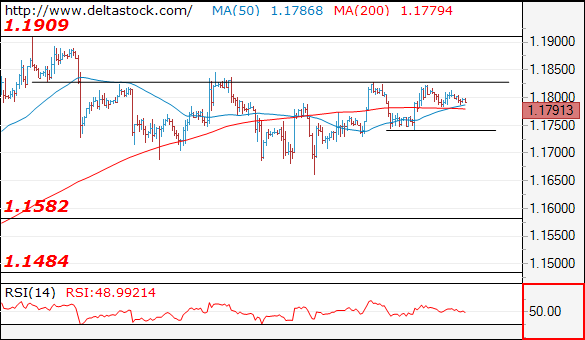
Forex Technical Analysis: EUR/USD, USD/JPY, GBP/USD
EUR/USD
Current level - 1.1791
My outlook here remains bearish, for a break through 1.1740 key low, towards 1.1580. Important resistance remains projected around 1.1830-50 area.
| Resistance | Support | ||
| intraday | intraweek | intraday | intraweek |
| 1.1830 | 1.1909 | 1.1740 | 1.1580 |
| 1.1850 | 1.2000 | 1.1580 | 1.1480 |
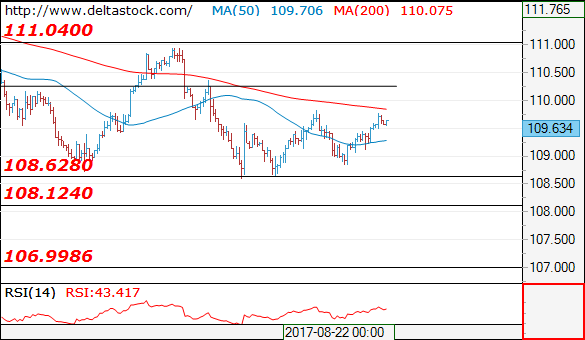
USD/JPY
Current level - 109.63
My intraday outlook is counter-trend, for a reversal and slide towards 108.10 area.
| Resistance | Support | ||
| intraday | intraweek | intraday | intraweek |
| 109.80 | 111.00 | 108.60 | 108.10 |
| 110.30 | 112.20 | 108.10 | 107.00 |
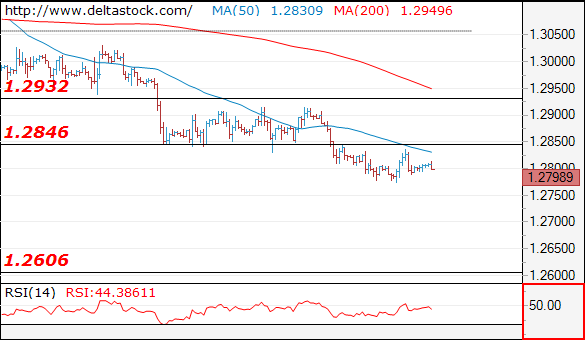
GBP/USD
Current level - 1.2798
The downtrend is underway, capped at 1.2840 and next target lies at 1.2606 area. Crucial on the upside is 1.2915.
| Resistance | Support | ||
| intraday | intraweek | intraday | intraweek |
| 1.2840 | 1.3260 | 1.2705 | 1.2606 |
| 1.2930 | 1.3500 | 1.2606 | 1.2480 |
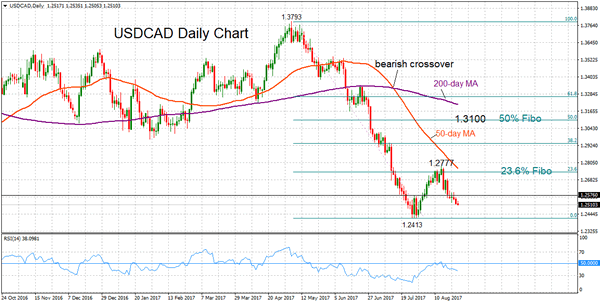
USDCAD Bearish With Increasing Risk For Further Downside
USDCAD maintains a bearish market structure and is at risk of falling to the July 27 low of 1.2413, a level not seen since June 2015. The pair has been recording lower highs and lower lows since the May 5 high of 1.3793.
The short-term picture is neutral to bearish. After USDCAD attempted to bounce from 1.2413, the rally faded roughly at the 23.6% Fibonacci retracement (1.2735) of the decline from 1.3793 to 1.2413. USDCAD is down over 2% so far after reversing from the August 15 high of 1.2777.
Support is expected at 1.2413 ahead of the next lows at 1.2127 and 1.1919. Immediate resistance is at the round level of 1.2600, which was respected earlier this week. A break above this level would target the 23.6% Fibonacci (1.2735) and 1.2777 high. From here, further barriers exist at 1.2939 (38.2% Fibonacci). Next comes the 50% Fibonacci at 1.3100, above which the trend is likely to change.
The underlying trend remains bearish for the medium term with increasing risk to the downside as RSI is below 50 and declining. The 50-day and 200-day moving averages are negatively aligned following a bearish crossover on July 13.