Sample Category Title
EUR/USD: Existing Home Sales
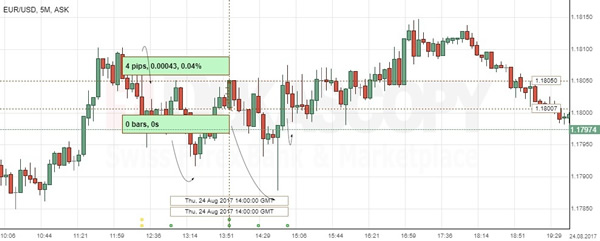
Home resales in the US disappointed market expectations, falling to the lowest level of 2017. However, the report had a little impact on the EUR/USD currency pair, where the Greenback lost against the Euro only 4 base points or 0.04%, but rapidly revenged losses and continued the Friday's session below the 1.1800 level.
The National Association of Realtors reported that the US existing home sales dropped 1.3% to a seasonally adjusted yearly rate of 5.44M in July, missing expectations for an increase to 5.55M units. A decrease was caused by the lack of available properties for sale, which limited the housing market recovery and forced price surge to notable outpace wage growth, while overall demand for housing remained strong.
GBP/USD: Second Estimate GDP
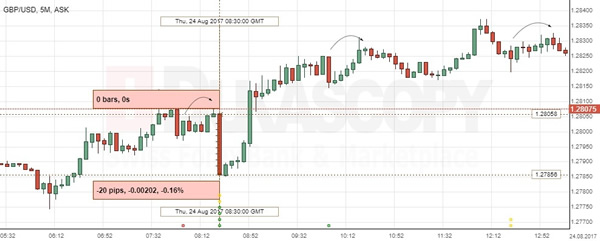
The combination of the UK economic reports contributed to the initial fall of the GBP/USD, though losses were offset immediately. The Sterling weakened against the US Dollar by 20 base points or 0.16% to rebound from the 1.2785 mark and continue moving upward.
The Office for National Statistics reported that the preliminary estimate for the Britain's economic growth in the June quarter was confirmed at 0.3% in line with the previous release. The GDP figures revealed that the UK economy expanded at the slowest pace amongst the G7 this year, as the Brexit uncertainty caused dampening business investment, which missed expectations being flat in the reported period. Meanwhile, the weaker Pound hurt consumer spending more than supported exporters.
Foreign Exchange Market Commentary: EUR/USD, USD/JPY, GBP/USD, GOLD, WTI CRUDE, DJIA, FTSE100, DAX
EUR/USD
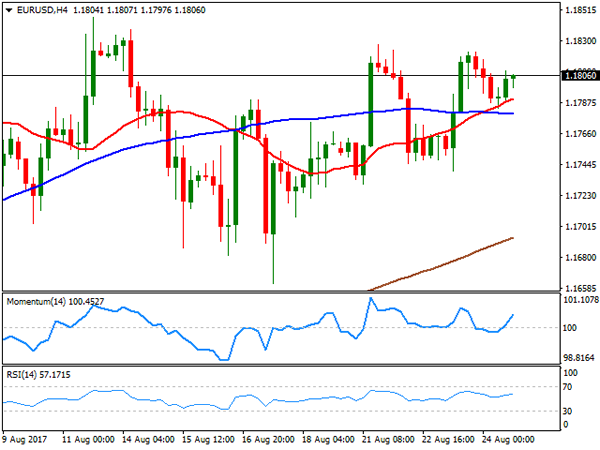
Majors were confined to tight daily ranges this Thursday, with no big events in the macroeconomic calendar and all eyes on Draghi and Yellen's speeches within the Jackson Hole central bankers' meeting this Friday. Still, the greenback lost ground against its major rivals, with the EUR/USD pair settling at the upper end of its latest weekly range, a few pips above the 1.1800 level. Data coming from the US was mixed, as following an encouraging weekly unemployment claims report, showing that claims fell to 234K in the week ended August 18th, existing home sales fell to their lowest for the year in July, at a seasonally adjusted annual rate of 5.44 million.
There are lots of speculation on what the heads of the Fed and the ECB would say tomorrow. Investors go into the speeches generally believing that ECB's Draghi will be cautious, not making any major statements, while Mrs. Yellen from the US is expected to talk normalization through reducing the balance sheet. Market's reaction will depend on how much the speeches' outcomes diverge from these preconceptions, with the hawker the tone, the bullish the currency.
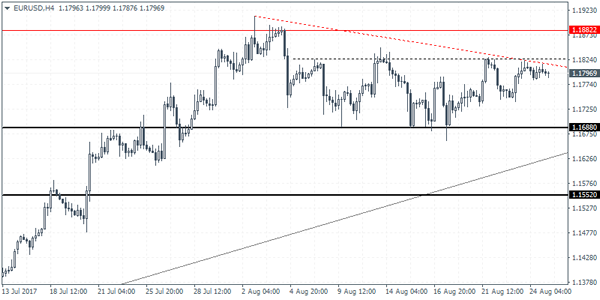
In the meantime, the neutral stance persist in the EUR/USD pair, having traded within a well-defined 100 range ever since the week started. In the 4 hours chart, the price is a few pips above its 20 and 100 SMAs, both directionless and converging in a tight range, a clear reflection of the ongoing range, while the RSI indicator in the mentioned chart holds pat around 56. The Momentum indicator in the mentioned time frame aims higher within positive territory, but the pair would need to break above 1.1860 to actually gain upward traction, whilst bears will take the grip only on a break below the 1.1680/90 region.
Support levels: 1.1770 1.1730 1.1685
Resistance levels: 1.1825 1.1860 1.1910
USD/JPY
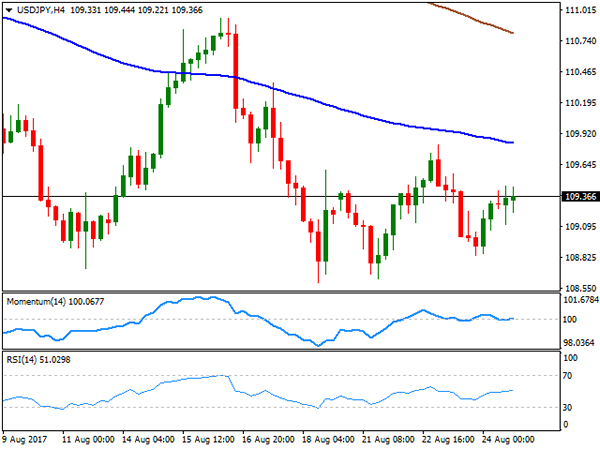
The USD/JPY pair rose up to 109.45, this Thursday, having spent most of the US session consolidating some 20 pips below the level, to end the day around 109.36. The Japanese yen eased against its American rival ever since the day started, weighed by soft local data and falling JGB yields. According to official data, Japan's leading index improved less than initially estimated in June, climbing to 105.9 in June from 104.7 in May, and downwardly revised from 106.3. The coincident index that reflects the current economic activity rose to 117.1 in June from 115.8 in the prior month. US yields traded at fresh 2-month lows, but recovered during US trading hours, maintaining the pair afloat, with the 10-year note yield settling around 2.19% after trading as low as 2.17%. The short term picture for the pair is neutral, given that in the 4 hours chart, the price remains well below its 100 and 200 SMAs, both maintaining their bearish slopes, while technical indicators head nowhere around their mid-lines. Nevertheless, the risk remains towards the downside, with another attempt of breaking below 108.80 probably resulting in a test of the year low set last April at 108.12.
Support levels: 108.80 108.45 108.10
Resistance levels: 109.60 110.00 110.45
GBP/USD
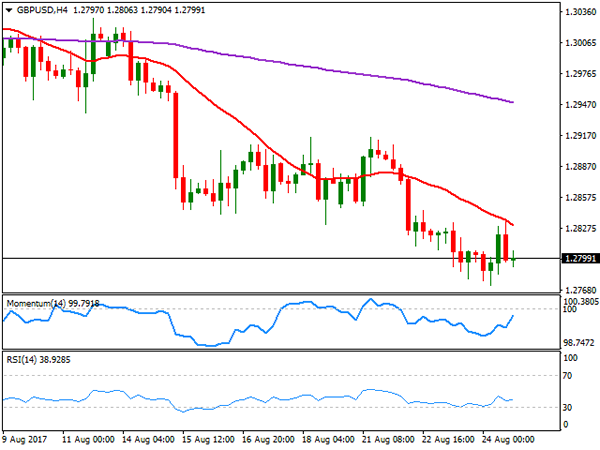
The GBP/USD settled around 1.2800 this Thursday, pretty much unchanged daily basis, despite an early attempt to regain the upside. A broadly weaker greenback helped the pair advance up to 1.2836, but the pair was once again rejected by selling interest around the 1.2830 region. The UK Q2 GDP revision came in unchanged at 0.3%, but consumer spending and business total business investment during the same period fell strongly, with the first up by 0.1% in the quarter, and the second standing at 0.0%. Furthermore, the CBI Distributive Trades Survey indicated a major slide in the volume of sales in August, from previous 22% to -10%, a worrisome picture for the UK economic future. The 4 hours chart for the pair shows that the early advance was contained by a bearish 20 SMA, while technical indicators in the mentioned chart have recovered from oversold territory, but remain below their mid-lines, limiting the upward potential of the pair. Given that the pair has set a lower low for the week, this time at 1.2773, the risk remains towards the downside, with the market still looking to test the 1.2700/20 region.
Support levels: 1.2770 1.2725 1.2690
Resistance levels: 1.2835 1.2870 1.2920
GOLD
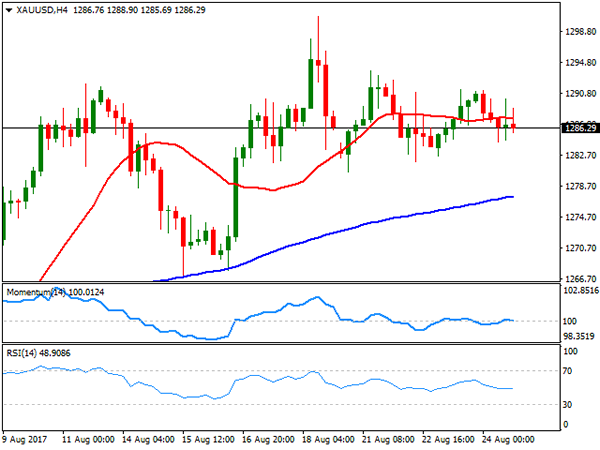
Spot gold remained within its early week range, ending this Thursday with modest losses at $1,286.29 a troy ounce. The commodity has been struggling for direction ever since the week started, as investors wait for clues from Jackson Hole's key speeches from Fed's Yellen and ECB's Draghi. Nevertheless, the commodity remains near the yearly high set August at 1,300.72, underpinned by US political jitters. The daily chart shows that the intraday trading range has been shrinking since the beginning of the week, resulting in technical indicators losing their upward momentum, but anyway holding well above their mid-lines, as the price holds far below a still bullish 20 DMA, all of which indicates that selling interest is well limited. Shorter term, the 4 hours chart maintains a neutral stance, with the price settling a few pips below a horizontal 20 SMA, the Momentum indicator heading nowhere around its 100 level, and the RSI heading modestly lower around 47. The weekly low has been set at 1,280.56, now the immediate support, with a break below it exposing the metal to a deeper correction, towards the 1,274.00 region first, but towards 1,260.00 later.
Support levels: 1,280.55 1,273.95 1,261.20
Resistance levels: 1,293.70 1,300.90 1,309.25
WTI CRUDE OIL
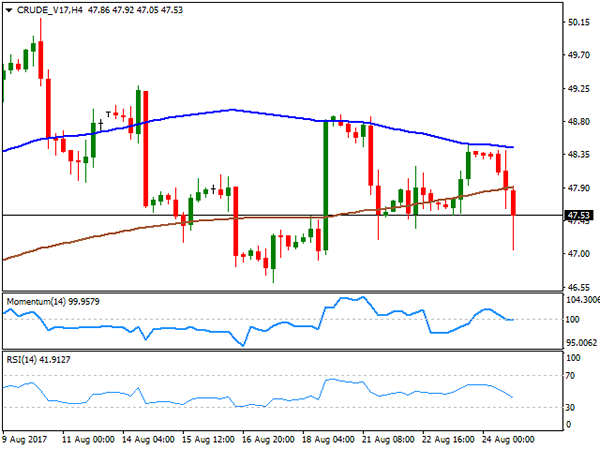
Crude oil prices plunged this Thursday, with West Texas Intermediate futures settling at $47.52 a barrel after printing a fresh weekly low of 47.05. There was no clear catalyst for this late slump, but seems speculative interest has taken profits out from the recent advance, still wary about the market's conditions and ahead of key events later this week. The fact that, despite US stockpiles keep shrinking, US production remains at its highest in over two years, helps keeping oil prices subdued. The commodity is at risk of falling further, although would need to extend its slide below the mentioned daily low to confirm a bearish extension, as in the daily chart, the price managed to settle above a marginally bearish 100 SMA, whilst technical indicators present modest bearish slopes within negative territory, but above previous weekly lows. In the 4 hours chart, the price settled below its moving averages, whilst technical indicators entered bearish territory, now with limited downward strength, but also favoring a bearish extension for this Friday.
Support levels: 47.05 46.60 46.00
Resistance levels: 47.90 48.50 49.10
DJIA
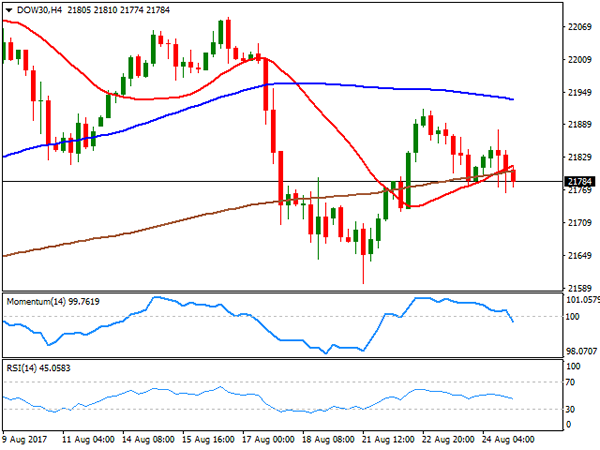
Following Wednesday's advance, Wall Street resumed its decline this Thursday, with all of the three major indexes closing in the red. The Dow Jones Industrial Average opened 40 points higher on improved results from retail sales, but ended the day 28 points lower at 21,783.40. The Nasdaq Composite shed 7 points, to settle at 6,271.33, while the S&P closed at 2,438.97, down 5 points or 0.21%. Grocery stocks plunged after Amazon vowed to cut Whole Foods prices after purchasing the company for $13.7 billion. As it happened across the financial world, trading was limited to tight intraday ranges, as investors wait for Draghi and Yellen's speeches to take place this Friday in the US afternoon. Cisco System was the best performer, up 1.02%, while Merck added 0.84%. Wal-Mart led decliners, shedding 2.13%, followed by United Technologies that shed 1.58%. For the Dow, the daily chart shows that early gains were contained by a modestly bearish 20 DMA, whilst technical indicators have lost directional strength, but hold within negative territory. In the same chart, the index is far above bullish 100 and 200 DMAs, leaving the latest retracement from record highs as barely corrective. In the 4 hours chart, the index settled below all of its moving averages, whilst technical indicators entered bearish territory with strong bearish slopes, but limited momentum, favoring a bearish extension particularly on a break below the daily low of 21,764.
Support levels: 21,764 21,725 21,672
Resistance levels: 21,814 21,850 21,892
FTSE100
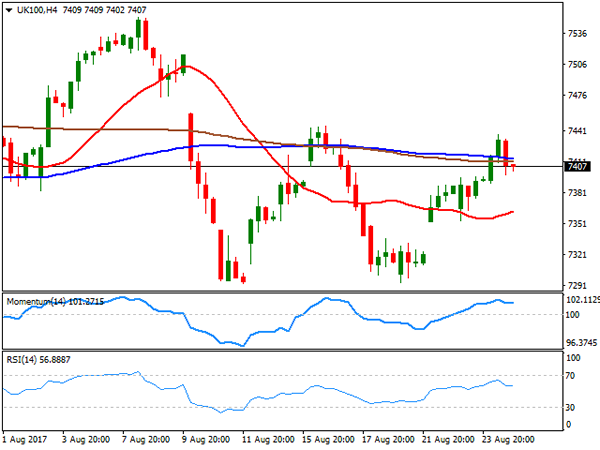
The FTSE 100 gained 24 points or 0.33% to end the day at 7,407.06, help by a continued recovery in Provident Financial, as the share added 13.16% following a similar advance on Wednesday, but after plummeting over 66% the day before. Lackluster UK data released early London kept the upside limited in the index, which traded as high as 7,438 intraday. EasyJet was the worst performer, ending the day 4.41% lower, followed by Whitbread that lost 2.60%. The daily chart for the index shows that it still trapped around its 20 and 100 DMAs converging horizontally within a tight range, while the Momentum indicator maintains its bearish slope within negative territory as the RSI consolidates around 50, all of which limits chances of a steeper advance. In the 4 hours chart, however, the index presents a more constructive outlook, having set well above its 20 SMA that gains upward strength, whilst technical indicators aim to regain the upside well above their mid-lines and after correcting oversold conditions.
Support levels: 7.396 7,353 7,309
Resistance levels: 7,444 7,482 7,533
DAX
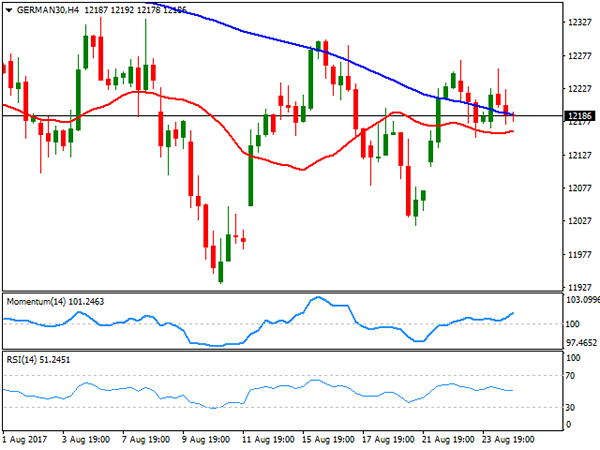
European indexes managed to close the day in the green, with the German DAX adding 6 points to 12,180.83, backed by an advance in the automotive sector. Trading, however, was choppy as investors were in cautious mode ahead of Friday's central bankers speeches. Within the German benchmark, Daimler was the best performer, ending the day up 1,23%, followed by Fresenius, which added 1.10%. On the negative side, Commerzbank was the worst performer, shedding 0.92%, and followed by ProSiebenSat.1 Media, which lost 0.88%. The daily chart for the index retains the negative tone seen on Wednesday, as the benchmark is barely holding above a horizontal 20 DMA and trapped between the larger ones, whilst technical indicators present modest bearish slopes within neutral territory. In the 4 hours chart, technical outlook is neutral, as the index is hovering around its 20 and 100 SMAs, both with bearish slopes but quite close to each other, the RSI indicator heads lower around its 50 level, whilst the Momentum indicator diverges higher within bullish territory.
Support levels: 12,153 12,110 12,065
Resistance levels: 12,222 12,263 12,301
Currencies: Yellen And Draghi To Decide On Next Directional USD Move
Sunrise Market Commentary
- Rates: Markets (too) dovish positioned ahead of JH?
Expectations of pre-announced policy changes by Draghi and/or Yellen at the Jackson Hole economic symposium seem too low. Therefore, we think that the market reaction will be bigger in case of a hawkish hint (initiate sell-on-upticks) than in case of keeping the dovish line (test of contract highs). - Currencies: Yellen and Draghi to decide on next directional USD move
FX traders will focus on the Jackson Hole speeches. Fed's Yellen giving more weight to financial stability risks might support the dollar, especially if Draghi refrains from given concrete details on the scaling back of APP. However, several other scenarios are possible.
The Sunrise Headlines
- US equities ended up to 0.2% lower yesterday with investors mainly waiting on comments from the central bankers meeting in Jackson Hole. Overnight, most Asian stock markets manage to eke out some gains.
- US President Trump has blamed the two most powerful Republican leaders in Congress for a looming crisis over the debt ceiling that must be raised this autumn in order to prevent the US from defaulting on its national debt.
- Japan's core consumer prices rose 0.5% Y/Y in July to mark a seventh straight gaining month, a sign the economy is making steady but painfully slow progress toward meeting the central bank's 2% inflation target. The August Tokyo core CPI rose by 0.4% Y/Y, beating 0.3% Y/Y expectations.
- A Gulf of Mexico storm rapidly intensified spinning into the potentially biggest hurricane to hit the mainland United States in 12 years and taking aim at the heart of nation's oil refining industry.
- German FM Schaeuble said the ECB should raise rates 'sooner rather than later.' He added that the EMU needs a common economic and finance policy to fix a shortcoming that's plagued the union from the start.
- Dallas Fed Kaplan has warned against watering down the stress tests on America's biggest banks, saying it would be hazardous to loosen regulation at a time of soaring asset prices.
- Today's eco calendar contains German Ifo business sentiment and US durable goods orders. Fed chair Yellen and ECB president Draghi take centre stage at the economic symposium in Jackson Hole.
Currencies: Yellen And Draghi To Decide On Next Directional USD Move
Yellen and Draghi to decide on next USD move
Yesterday, the dollar was little changed against the euro and regained marginally ground against the yen as the impact from Tuesday's comments of president Trump faded. Investors refrained from placing big bets ahead of today's Jackson Hole speeches. EUR/USD held near the 1.18 pivot. USD/JPY reversed Wednesday's Trump-related setback and finished the day at 109.56.
Overnight, most Asian equity markets trade with a positive bias counting down to the speeches of Fed's Yellen and ECB's Draghi in Wyoming. The dollar records marginal gains. EUR/USD is changing hands just below 1.18. USD/JPY trades in the 109.60 area. All eyes are on Jackson Hole, but maybe markets are also growing a bit more confident that a US government shutdown can be avoided. This is slightly supportive for risky assets and for the dollar. Japan inflation trended cautiously higher in July (0.5% Y/Y for the measure ex Fresh food). However, the data are no reason to expect a change in BOJ tactics anytime soon.
The eco calendar is interesting today even as main attention will go to central bankers. In Germany the Q2 GDP and the IFO business sentiment will be published. July IFO sentiment was at the highest level since the unification. We don't predict further gains, but the German August PMI's showed still progress. In the US, July headline durable orders are expected sharply down after a transportation-induced gain in June. The underlying measures should show a modestly constructive increase. Positive eco data, higher yields and a constructive risk sentiment might be marginally USD supportive. However, the attention will go to Yellen's speech on financial stability. The start of the tapering of the balance sheet is key, but the Fed's views on the missing link between a strong labour market and ongoing soft prices are also important. If Yellen suggests asset valuations are high, financial risks might get more weight in policymaking. This would be a signal that the Fed still intends to raise rates manifold. It is a slippery slope though as she need to contain the market reaction too. Regarding the ECB, the outlook for the tapering of APP matters most. Inflation and the strength of the euro are crucial. Both Yellen and Draghi can bring unexpected elements. However, if Yellen gives more weight to risks of financial stability and if Draghi keeps the options open on the timing and the pace of reducing APP, this scenario might be positive for the dollar. Several different combinations can come to the forefront as well.
Broader context and technical picture. Late June, EUR/USD started a new up-leg as investors anticipated a reduction of ECB bond buying. The Fed was expected to remove policy stimulation only in a very gradual way as US inflation remains soft. Uncertainty on the policy of the Trump administration was a secondary negative factor for the dollar. EUR/USD set a new correction top north of 1.19 before consolidating in a narrow 1.1662/1.1910 range. If US data remain ok (as most were this month) and if Draghi gives little information on next ECB steps, there might be room for a modest USD comeback. A return of EUR/USD to the 1.15/16 area is possible. Pockets of US political risk are negative for the dollar.
A downward correction in core yields supported the yen in August. USD/JPY declined from mid-114 mid-July to 108.60. The April correction low (108.13) remains the line in the sand. This level won't be easy to break as quite some USD bad news is discounted after the recent protracted setback. A cautious buyon- dips approach (with stop-loss protection below 108) may be considered
EUR/USD: awaiting clearer CB guidance
EUR/GBP
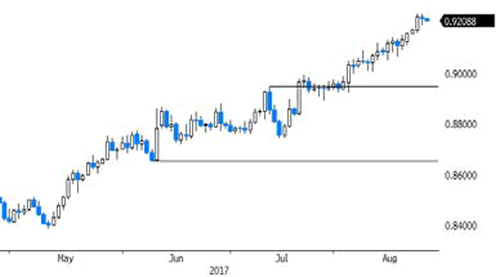
EUR/GBP rally slows, at last
The longstanding decline of sterling (against the euro) finally took a breather yesterday. EUR/GBP came slightly off the recent top around 0.9235. Cable returned north of 1.28. The UK data couldn't explain the pause in the sterling decline, as they disappointed. There was no high profile news from the Brexit negotiations. Immigration data indicated that net migration to the UK fell significantly in the year to March. Whatever, the market apparently found itself a bit too much sterling short and needed a pause. The move was already partially reversed later in the session, indicating that the global picture for sterling didn't change. EUR/GBP closed the session at 0.9218. Cable finished the day at 1.2801.
There are no important UK data today. Sterling trading will be driven by technical considerations and global factors. If the Jackson Hole speeches result in a rebound of the dollar (Fed giving more weight to financial stability risks), it will evidently also be negative for cable. The impact on EUR/GBP is less clear. A setback in EUR/USD might also inspire some further correction in EUR/GBP. Headlines on Brexit ahead of the next round of negotiations remain a wildcard. Will markets build on yesterday's ‘correction' of EUR/GBP?
From a technical point of view, EUR/GBP cleared 0.8854/80 resistance (top end June), opening the way for further gains. The move was the result of euro strength (strong EMU data and expectations of APP tapering). Simultaneously, UK price data were soft enough to keep the BoE side-lined as the Brexit negotiations continue. MT, we maintain a buy EUR/GBP on dips approach as we expect the combination of relative euro strength and sterling softness to persist. The 0.9415 ‘flash-crash spike' is the next target on the charts. However, we don't jump on the up-trend anymore after the recent rally and wait for a correction, e.g. to the technical support in the 0.88/89 area
EUR/GBP: uptrend slows, at last…?
EUR/JPY Candlesticks and Ichimoku Analysis
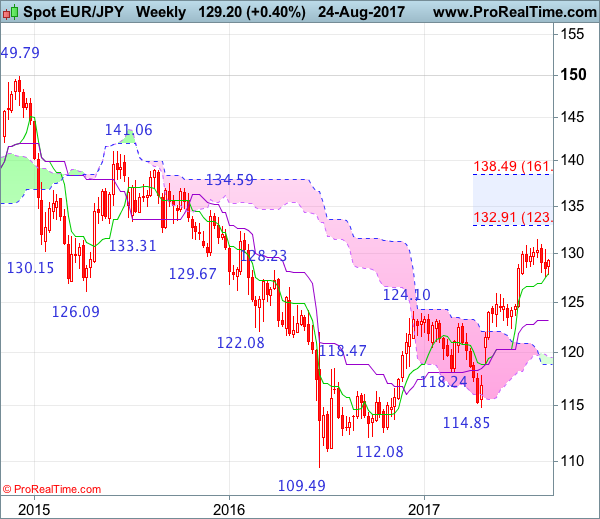
Weekly
• Last Candlesticks pattern: Window
• Time of formation: 24 April 2017
• Trend bias: Up
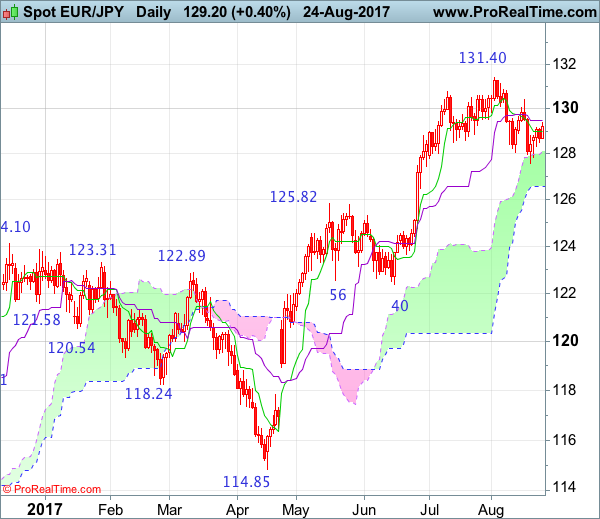
Daily
• Last Candlesticks pattern: Hammer
• Time of formation: 18 May 2017
• Trend bias: Up
EUR/JPY – 129.15
Although the single currency extended the fall from 131.40 to 127.56 late last week, the subsequent rebound suggests consolidation above said support would be seen and test of the Kijun-Sen (now at 129.48) cannot be ruled out, however, a daily close above there is needed to signal low has been formed, bring further gain to 130.00 but resistance at 130.40 should remain intact. Only a daily close above this level would signal the fall from 131.40 has ended, bring further gain to 131.00, then towards this recent high.
On the downside, below 128.30-35 would suggest the rebound from 127.56 has possibly ended, bring weakness to 127.84 but break there is needed to revive bearishness and extend the fall from 131.40 top for retest of 127.56, break there would bring further fall to 126.85-90 (50% Fibonacci retracement of 122.38-131.40), then test of the lower Kumo (now at 126.59), however, downside should be limited to 126.00-10 and reckon 125.80-85 (61.8% Fibonacci retracement) would hold from here, brig rebound later.
Recommendation: Exit short entered at 129.50 and stand aside for this week.
On the weekly chart, as the single currency has retreated after rising to 131.40 earlier, retaining our view that consolidation below this level would be seen and downside bias remains, break of support at 127.56 (last week’s low) would bring retracement of recent upmove to 126.85-90 (50% Fibonacci retracement of 122.38-131.40), then towards 126.00-10 but previous resistance at 125.81 (also 61.8% Fibonacci retracement) should turn into support and limit euro’s downside, reckon 124.50 would remain intact, bring rebound later.
On the upside, expect recovery to be limited to 129.50 and 130.00 would hold, bring another decline. Above resistance at 130.40 (last week’s high) would bring recovery to resistance at 130.83 which is likely to hold, bring another retreat later. Only break of 130.83 would bring retest of 131.40 but break there is needed to revive bullishness and extend major upmove from 109.49 low to 131.90-00, then test of previous chart resistance at 132.33, however, overbought condition should limit upside to 133.00-10, risk from there is seen for a retreat to take place later.
UK Economy Grows By 0.3% In Q2
On Thursday, the UK Office for National Statistics released Q2 GDP showing that it increased 0.3%, unrevised from the preliminary estimate. The latest pace of growth was slightly better than the 0.2% expansion posted in Q1. However, there was a slowdown in both UK household spending and business investment. Year-on-year, GDP growth came in at 1.7%, in line with market forecasts. Consumer spending growth slowed to 0.1%, its worst since Q4 of 2014.
The US Labour Department released Initial Jobless Claims, showing that initial claims for state unemployment benefits increased 2K to a seasonally adjusted 234K for the week ended Aug. 19, which was in line with expectations. The release marks 129 consecutive weeks where claims have been below 300K (regarded as the threshold of a strong labour market). Markets are generally quiet as they await key speeches from Central Bankers at the Jackson Hole Symposium later today. The markets do not anticipate any major statements, but they will be scrutinizing any comments for any signs that could indicate a change in policy in the months to come. The CME FedWatch tool has expectations for a rate hike in December at just 37.6%.
EURUSD was little changed, currently trading at 1.1798.
USDJPY made a slight recovery on Thursday. Currently, USDJPY is trading around 109.60.
GBPUSD was also little changed on Thursday, currently trading around 1.2810.
Gold remains in a tight trading range, currently trading around $1,287.525.
WTI dropped to $47.22pb on Thursday, a 2.5% decline on the day. Currently, WTI is trading around 0.4% higher at $47.95pb.
At 09:00 BST, The CESifo Group releases German business sentiment index (IFO). IFO – Business Climate, Expectations & Current Assessment for August will all be released. Consensus calls for slightly lower figures in all 3 releases compared to the previous data. If the data is significantly lower it is likely the markets will sell EUR – the converse being true also.
At 13:30 BST, the US Census Bureau will release Durable Goods Orders for July, along with data that excludes Transportation. Main Durable Goods consensus calls for a significant -6.0% for July compared to the last reading of 6.5%. Durable Goods ex. Transportation is expected to come in at 0.4% compared to the previous reading of 0.1%.
At 17:00 BST, Fed Chair Janet Yellen is scheduled to speak at the Jackson Hole Symposium.
At 20:00 BST, ECB President Mario Draghi is scheduled to speak at the Jackson Hole Symposium.
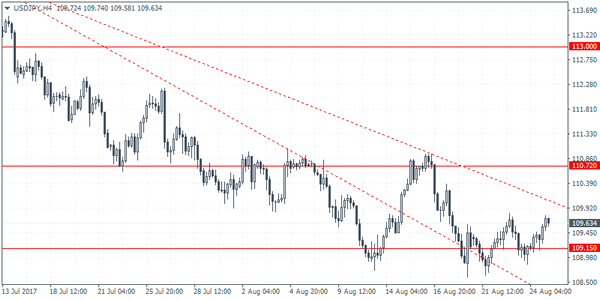
USDJPY Intraday Analysis
USDJPY (109.63): The USDJPY was seen bouncing off the price level near 109.15. Price action has been showing strong consolidation at this level for the past five trading sessions. This could suggest a near term breakout to the upside. However, resistance at 110.72 is likely to cap any gains. USDJPY could, therefore, be seen trading within the current range of 110.72 and 109.15. The newly drawn falling trend line will be in focus as a breakout above this level is required to maintain the gains.
GBPUSD Intraday Analysis
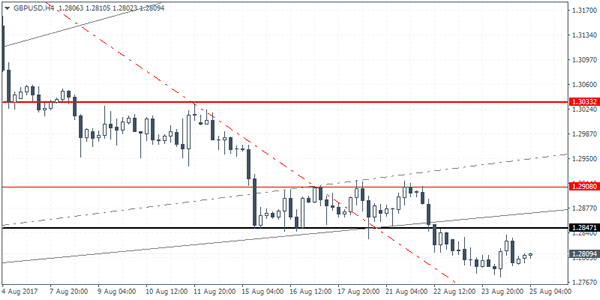
GBPUSD (1.2809): The British pound closed with a doji pattern yesterday below the support level of 1.2874. Price action could see a short-term reversal if the British pound manages to close back above this support. A retest back to 1.3033 cannot be ruled out if the retracement begins. On the 4-hour chart, the support level remains in focus. Any short term gains could see GBPUSD retest this level for resistance which will keep the bias to the downside. The next main support level is seen at 1.2628
USD/CAD Candlesticks and Ichimoku Analysis
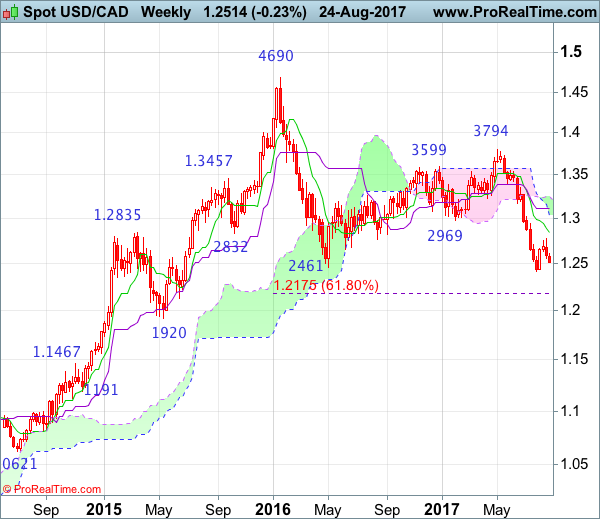
Weekly
• Last Candlesticks pattern: Shooting doji
• Time of formation: 01 May 2017
• Trend bias: Sideways
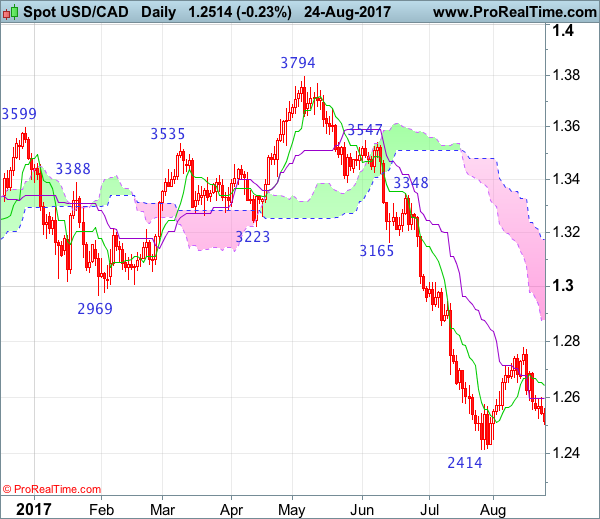
Daily
• Last Candlesticks pattern: Bearish engulfing
• Time of formation: 5 May 2017
• Trend bias: Down
USD/CAD – 1.2536
As the retreat from 1.2778 has kept the greenback under pressure, suggesting the correction from 1.2414 has possibly ended and consolidation with mild downside bias remains for further weakness to 1.2450-55, however, a daily close below there is needed to add credence to signal view and signal recent decline has resumed for retest of 1.2414. Looking ahead, once this support is penetrated, this would confirm resumption of early downtrend to 1.2350-60 and later towards 1.2300 but price should stay well above 1.2240-50, risk from there has increased for a rebound to take place later.
On the upside, whilst recovery to 1.2550-60 cannot be ruled out, reckon the Tenkan-Sen (now at 1.2649) would limit upside and bring another decline later. Above 1.2700-10 would defer and risk another bounce towards said resistance at 1.2778, having said that, only break of this level would abort and risk a stronger rebound to 1.2810-20 but price should falter below previous support at 1.2859 (now resistance) and bring another decline later. Looking ahead, only a sustained breach above this level would signal a temporary low is formed instead, bring retracement of recent decline to the lower Kumo (now at 1.2875), then 1.2900-05 but price should falter well below resistance at 1.3015, bring another selloff later.
Recommendation: Sell at 1.2640 for 1.2440 with stop above 1.2740.
On the weekly chart, as the greenback met resistance at 1.2778 and has retreated, suggesting the rebound from 1.2414 has possibly ended there and retest of said support cannot be ruled out, however, break there is needed to confirm the selloff from 1.4690 top has resumed and extend weakness to 1.2300-10 but oversold condition should prevent sharp fall below 1.2240-50 and price should stay above 1.2175 (61.8% Fibonacci retracement of 1.0621-1.4690), risk from there is seen for another corrective rebound to take place later.
On the upside, whilst minor recovery to 1.2640-50 cannot be ruled out, price should falter below 1.2700-10 and bring another decline later. A break of said resistance at 1.2778 would prolong consolidation above 1.2414 and risk a stronger corrective bounce to 1.2805-10 resistance, then test of previous support at 1.2859 (now resistance), above there would suggest a temporary low has been formed, bring a stronger rebound to 1.2900, then towards resistance at 1.2944 but upside should be limited to psychological level at 1.3000 and price should falter below the Kijun-Sen (now at 1.3104), bring another selloff in late Q3.
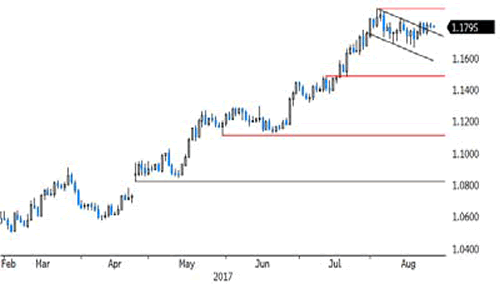
EURUSD Intraday Analysis
EURUSD (1.1796): The EURUSD was trading subdued with price action quite limited. However, the common currency is seen holding up near the 1.1800 level. This tight price action could potentially signal a breakout in the near term. While price action continues to trade in the ascending triangle pattern, there is also a potential inverse head and shoulders continuation pattern forming near the top. Neckline resistance is seen at 1.1825 on the 4-hour chart. A breakout above this level could potentially push EURUSD to the upside, initially to test the previous resistance at 1.1882. Further gains can be expected on a breakout above this level.