
Sample Category Title
Euro Awaits IFO And Draghi Speech
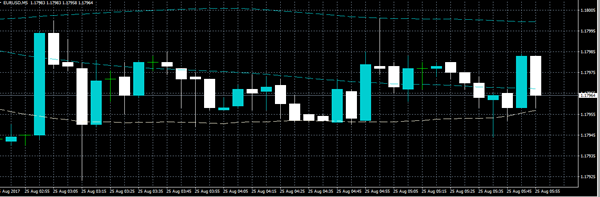
The EURUSD pair remains close to the key 1.1800 level, as the single currency awaits the release of the August German IFO survey, and comments from ECB President Mario Draghi, at Jackson Hole later this evening.
Sources close to the ECB have suggested that Mario Draghi will refrain from making any new comments about future monetary policy. However, the euro could become volatile, should Mario Draghi strike an overly dovish or hawkish tone.
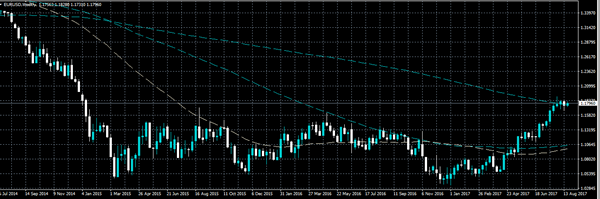
The euro remains neutral on an intraday basis, with the pair still strongly bullish in the medium and long-term. Weekly time frame price closes above or below the 200-week moving average should be watched closely.
Key intraday technical support is found at the 1.1783 and 1.1765 levels. A loss of the 1.1765 level should accelerate EURUSD selling towards 1.1741 and 1.1713.
To the upside, the 1.1815 and 1.1828 levels remain intraday resistance areas. The former swing price high at 1.1847, and the 1.1900 offer strong weekly resistance.
Janet Yellen To Address Jackson Hole
The annual Jackson Hole Symposium is once again the centre of attention on Friday, with Federal Reserve Chairwoman Janet Yellen scheduled to deliver a speech on financial stability.
Although economists aren't expecting much news from Yellen's speech, it will nevertheless generate plenty of discussion amid speculation that President Donald Trump is looking to replace her. With Yellen's four-year term set to expire in February, the Commander-In-Chief is said to be considering multiple candidates to head the all-powerful Fed. Various reports indicate that Gary Cohn, director of the National Economic Council, is the favourite.
Yellen will deliver her speech at 14:00 GMT.
Five hours later, European Central Bank (ECB) President Mario Draghi will deliver a speech to Jackson Hole. Like Yellen, the ECB head is not expected to unveil any new information.
Investors can also expect a steady stream of economic data throughout the day. Action begins at 06:00 GMT with revised German GDP data. The German economy is forecast to grow 0.6% in the second quarter, matching the initial estimate.
Later in the session, the CESifo Group will release its business sentiment indicators covering current conditions, expectations and the overall business climate. All three indicators are forecast to ease in August.
The start of New York trading features a high-profile report on US durable goods orders. Orders for manufactured goods meant to last three years or more are forecast to plunge 6% in July, partially offsetting the previous month's gain of 6.5%. Excluding transportation, orders are expected to climb 0.4%.
Energy traders will also be keeping tabs on weekly rig-count data courtesy of Baker Hughes Inc. The report is widely regarded as a proxy for the US shale industry.
USD/JPY
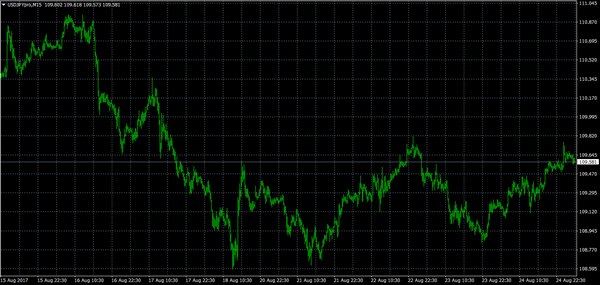
The Japanese yen was little changed versus the dollar on Friday, as investors digested the latest batch of inflation data from Tokyo. Japan's national consumer price index (CPI) rose 0.4% annually in July. So-called core inflation, which strips away volatile food prices, climbed 0.5% annually. The USD/JPY exchange rate was trading at 109.60. Prices are trading well below the 100-day and 200-day SMAs, based on the 4-hour interval.
EUR/USD
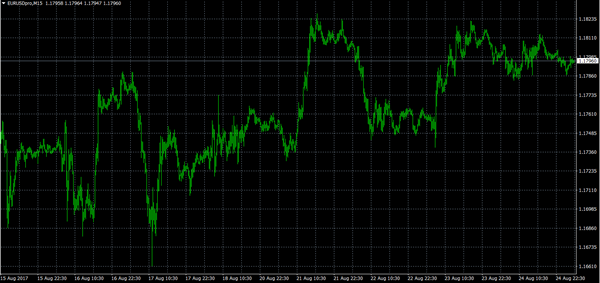
The EUR/USD was little changed on Friday, as prices clung on to the 1.18 level. The pair could generate volatility between Yellen and Draghi. At the time of writing, the EUR/USD faces immediate support at 1.1770. On the opposite side of the ledger, resistance is seen at 1.1825.
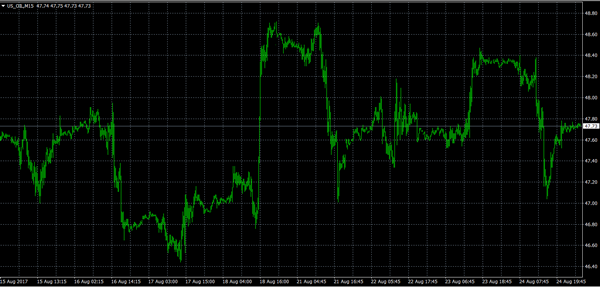
WTI OIL
Oil prices traded higher on Friday following a highly volatile week in the market. West Texas Intermediate (WTI) was up 0.7% at $47.76 a barrel during the Asian session. Despite the increase, the outlook on crude remains neutral, based on hourly readings of the RSI and MACD indicators.
US Dollar Faces Strong Offers Near 110.00 Vs Japanese Yen
Key Highlights
- The US Dollar recovered from 108.60 against the Japanese Yen, but faces an uphill task near 110.00.
- There is a major resistance zone forming near 109.75-110.00 on the 4-hours chart of USD/JPY.
- Japan's National Consumer Price Index for July posted a 0.4% rise (YoY), similar to the last +0.4%.
- Tokyo's Consumer Price Index in August 2017 increased 0.5% (YoY), more than the +0.3% forecast.
USD/JPY Technical Analysis
The US Dollar tested the 108.60 support on a few occasions against the Japanese Yen. The USD/JPY pair formed a decent base and started an upside towards a major hurdle at 110.00.
The pair has recovered above the 38.2% Fib retracement level of the last decline from the 110.94 high to 108.60 low. However, on the upside, there is a major resistance zone forming near 109.75-110.00 on the 4-hours chart of USD/JPY.
There are two bearish trend lines and the 100 simple moving average (H4) positioned near 109.75-110.00. At the moment, the pair is struggling to clear the 50% Fib retracement level of the last decline from the 110.94 high to 108.60 low at 109.77.
Therefore, it won't be easy for buyers to push the pair above 110.00. There is a chance of a rejection and a downside reaction back towards the 109.20-00 support zone in the near term.
Japan's National CPI and Tokyo's CPI
Recently, there were a few important releases in Japan such as the National CPI for July 2017 and Tokyo's CPI figure for August 2017.
The National Consumer Price Index for July 2017 by the Statistics Bureau was forecasted to increase by 0.4% compared with the same month a year ago. The actual result was as expected, as the CPI in July 2017 rose 0.4%, similar to the last +0.4%.
The National Consumer Price Index Ex-Fresh Food was forecasted to increase by 0.3% compared with the same month a year ago. The actual result came in at +0.5%, but more than the last +0.4%.
Tokyo's Consumer Price Index for August 2017 was forecasted to increase by 0.4% compared with the same month a year ago. The actual result was better than the forecast, as the CPI increased 0.5%, which was also more than the last +0.1%.
Similarly, Tokyo's Consumer Price Index Ex-Fresh Food for August 2017 was forecasted to increase by 0.3% compared with the same month a year ago. The actual result was encouraging, as the CPI increased 0.4%, more than the last +0.2%.
Overall, it seems like the USD/JPY pair might struggle to break the 110.00 resistance zone and likely to trade in a range before the next move.
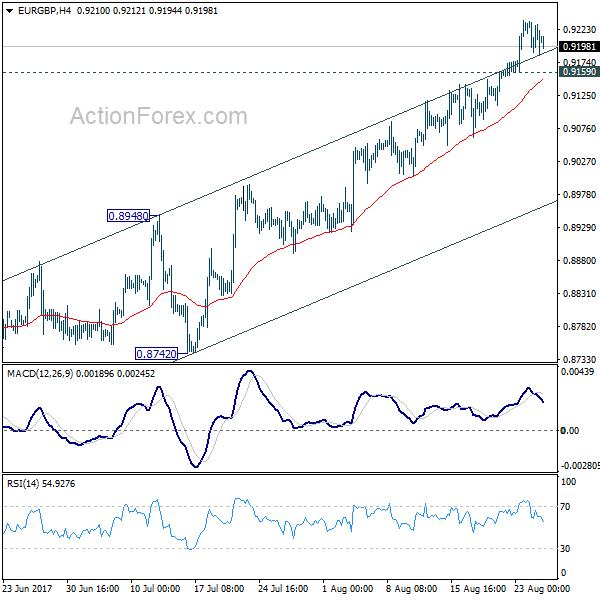
EUR/GBP Daily Outlook
Daily Pivots: (S1) 0.9192; (P) 0.9213; (R1) 0.9237; More
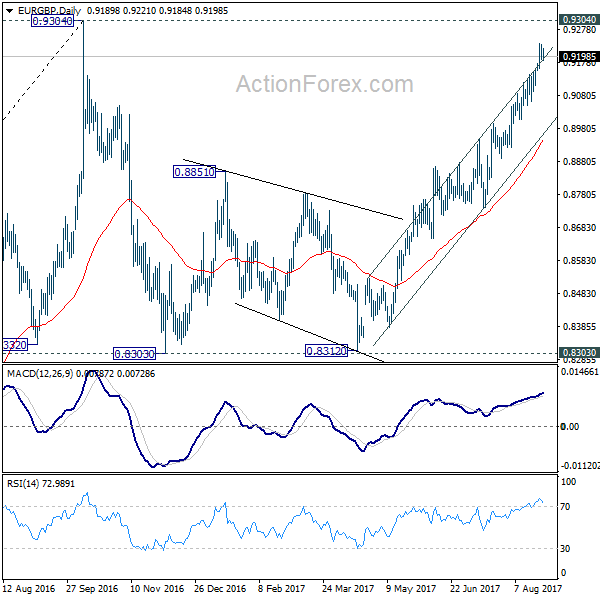
With 0.9159 minor support intact, intraday bias in EUR?GBP remains on the upside. Current rise from 0.8312 is in progress for testing 0.9304 high. At this point, there is still is no clear sign of up trend resumption yet. Hence, we'll be cautious on strong resistance from 0.9304 to limit upside and bring another fall. But firm break of 0.9304 will confirm up trend resumption and pave the way to 0.9799. On the downside, below 0.9159 minor support will turn intraday bias neutral first.
In the bigger picture, price actions from 0.9304 are viewed as a medium term corrective pattern. It's uncertain whether it is finished yet. But in case of another fall, we'd expect strong support from 0.8116 cluster support (50% retracement of 0.6935 to 0.9304 at 0.8120) to contain downside and bring rebound. Whole up trend from 0.6935 is expected to resume after consolidation from 0.9304 completes. In that case, 2008 high at 0.9799 will be the next target.
XAU/USD Analysis: Concentrates In Symmetrical Triangle
The way the bullion is moving against the buck, basically, repeats the path of the Euro, as majority of traders prepare for a speech that will be delivered by Janet Yellen at 16:00 GMT.
Namely, the pair has entered into a short-term symmetrical triangle that continued narrowing down in parallel to the increasing anxiety related to the upcoming fundamental event. From a daily chart perspective, a breakout to the top seems a more likely scenario, as the bullion is expected to reach the upper boundary of a massive long-term ascending channel. But in any case, the further direction will depend solely on content of the above speech.
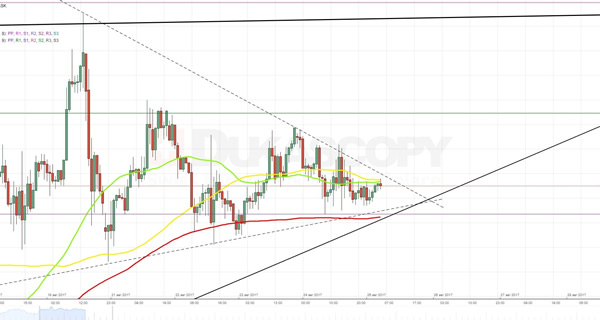
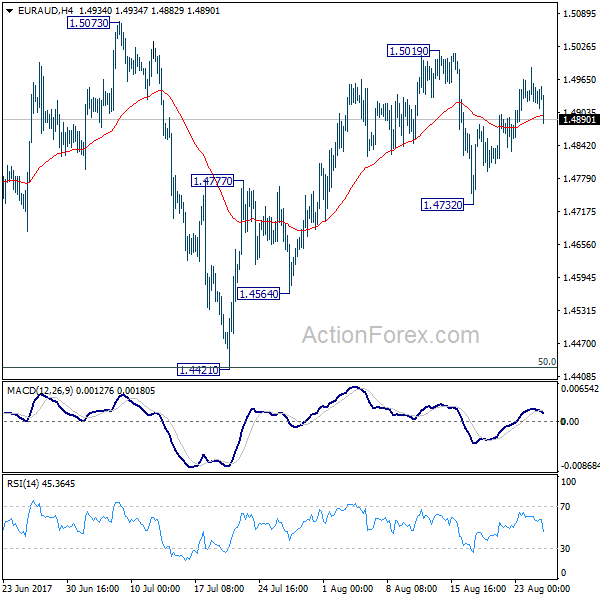
EUR/AUD Daily Outlook
Daily Pivots: (S1) 1.4907; (P) 1.4947; (R1) 1.4973; More...
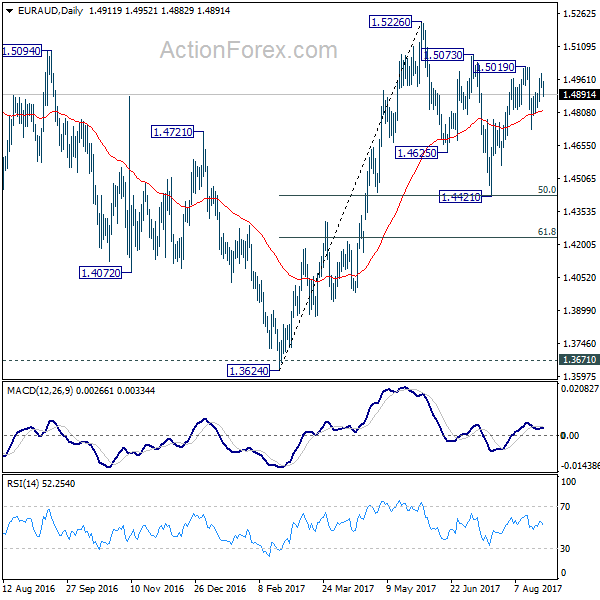
Intraday bias in EUR/AUD remains neutral for the moment. On the upside, above 1.5019 will resume the rise from 1.4421 and target a test on 1.5226 high. On the downside, below 1.4732 will extend the consolidation from 1.5226 with another fall. But we'd expect 1.4421 cluster support (50% retracement of 1.3624 to 1.5226 at 1.4427) to hold and bring rebound.
In the bigger picture, we're holding on to the view that corrective decline from 1.6587 medium term has completed at 1.3624. Rise from 1.3624 is expected to extend to retest 1.6587. The corrective structure of the fall from 1.5226 is affirming this view. Above 1.5226 will target a test on 1.6587 key resistance. However, break of 1.4421 will dampen our view and would drag EUR/AUD lower to retest key support zone around 1.3624.
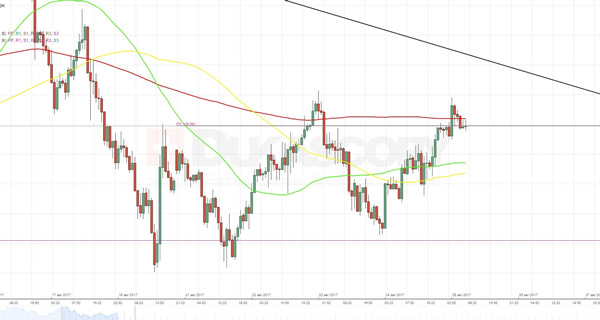
USD/JPY Analysis: Stuck At 109.59
As it was expected, the American Dollar continued to gradually recover against the Japanese Yen in anticipation of the speech that will be delivered today at the Jackson Hole Symposium at 16:00 GMT.
From a technical point of a view, the further surge of the buck is a quite possible scenario, as the pair has an obstacle-free area up until the upper boundary of a senior descending channel. The southern side, in contrast, contains various barriers, such as the 55- and 100-hour SMAs or the monthly S1. However, if remarks from the Fed Chair will be disappointing, none of the above barriers could stop the fall of the rate that will be followed by an active acquisition of the Yen.
GBP/USD Analysis: Tries To Head To The North
In line with expectations, an announcement of the Second Estimate GDP helped the Pound to slightly recover against the American Dollar. In result of the surge, the currency pair has reached the upper boundary of a senior descending channel, but then was forced to make a rebound.
The fact that the pair has subsequently failed to slide through the weekly S1 at 1.2799 indicates that it might make a breakout to the top. However, even if it happens the further movement most likely will be neutralized either by the 100-, or the 200-hour SMA. But in the meantime, there is a need to take into account the impact that will be brought by the upcoming Janet Yellen speech.
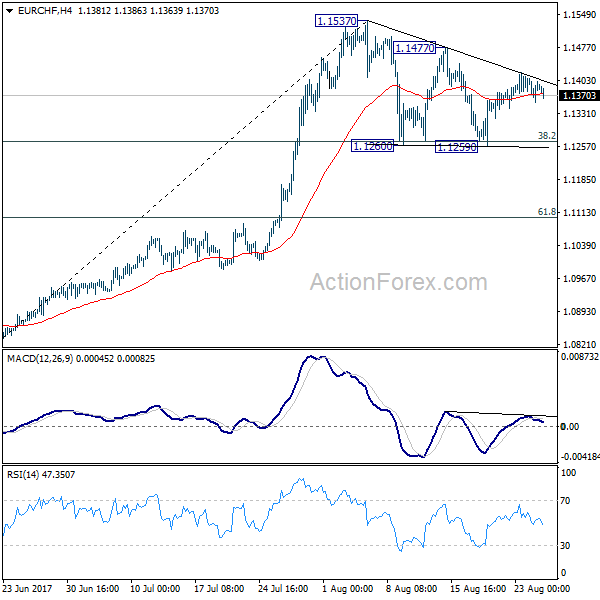
EUR/CHF Daily Outlook
Daily Pivots: (S1) 1.1361; (P) 1.1385; (R1) 1.1415; More...
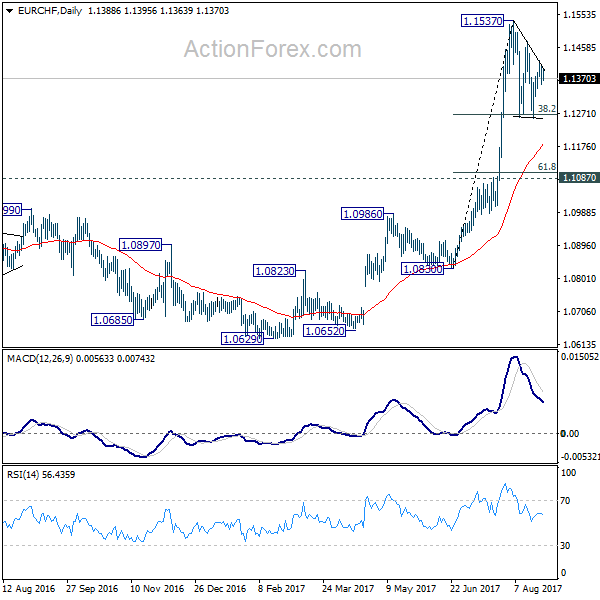
EUR/CHF is still staying in consolidation pattern fro 1.1537 and intraday bias remains neutral. On the upside, break of 1.1477 resistance will argue that the consolidation from 1.1537 has completed and larger rise is resuming. However, firm break of 38.2% retracement of 1.0830 to 1.1537 at 1.1267 will extend the correction to 61.8% retracement at 1.1100 before completion.
In the bigger picture, firm break of 1.1198 key resistance confirms resumption of the long term rise from SNB spike low back in 2015. In this case, EUR/CHF would eventually head back to prior SNB imposed floor at 1.2000. For now, this will be the favored case as long as 1.1087 resistance turned support holds.
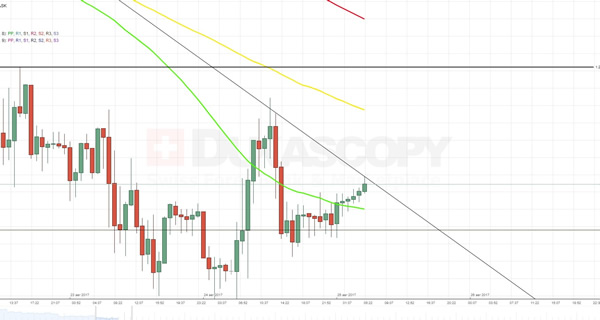
EUR/USD Analysis: Prepares For Draghi And Yellen Speeches
An hourly chart reveals that the Euro is moving against the American Dollar in a short-term symmetrical triangle, as traders await both Mario Draghi and Janet Yellen speeches that will be delivered later this day at the Jackson Hole Symposium.
From a technical perspective, a breakout to the northern direction seems more possible, as the currency pair experiences pressure from the 55- and 100-hour SMAs from the bottom. In addition, the upper area lacks any notable resistance barriers in the next 45-pip range.
However, if the downfall happens, then in the worst case scenario it should be stopped by the 100% Fibonacci retracement level at 1.1714.
