
Sample Category Title
Traders Eye Draghi And Yellen Speeches
The ECB President Mario Draghi and the Federal Reserve Chair, Janet Yellen will be speaking at the Jackson Hole Symposium today. Remarks on monetary policy, from both the central bankers, are expected to be the major market moving events today. However, the risk of not addressing monetary policy also looms which could keep the markets in check.
On the economic front, the UK's second revised estimate was released yesterday. Data from ONS showed that the GDP advanced 0.3% in the second quarter. However, business investment was seen to be flat, missing estimates of a 0.2% increase. In the US existing home sales rose 5.44 million, slower than the month before.
Looking ahead, the economic calendar today will see the US durable goods orders and the German Ifo business climate.
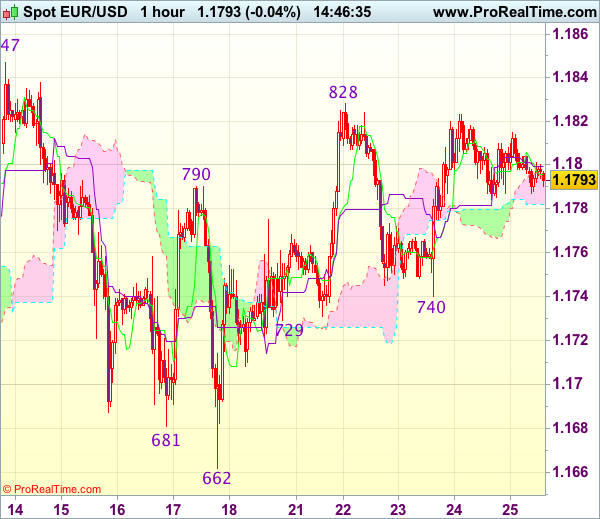
Trade Idea : EUR/USD – Hold long entered at 1.1765
EUR/USD - 1.1779
Most recent candlesticks pattern : N/A
Trend : Sideways
Tenkan-Sen level : 1.1789
Kijun-Sen level : 1.1794
Ichimoku cloud top : 1.1794
Ichimoku cloud bottom : 1.1782
Original strategy :
Bought at 1.1765, Target: 1.1865, Stop: 1.1770
Position : - Long at 1.1765
Target : - 1.1865
Stop : - 1.1770
New strategy :
Hold long entered at 1.1765, Target: 1.1865, Stop: 1.1770
Position : - Long at 1.1765
Target : - 1.1865
Stop : - 1.1770
Euro’s retreat after faltering below resistance at 1.1828 suggests caution on our bullishness and minor consolidation would be seen, however, as long as 1.1765-70 holds, mild upside bias remains for another rebound, above said resistance at 1.1828 would extend the rise from 1.1662 low to resistance at 1.1847, break there would provide confirmation that the pullback from 1.1910 has ended and encourage for headway to 1.1870-80 but reckon said resistance at 1.1910 would hold from here.
In view of this, we are holding on to our long position entered at 1.1765. Only below 1.1740 support would abort and suggest the rebound from 1.1662 has ended instead, risk weakness to 1.1695-00 first.
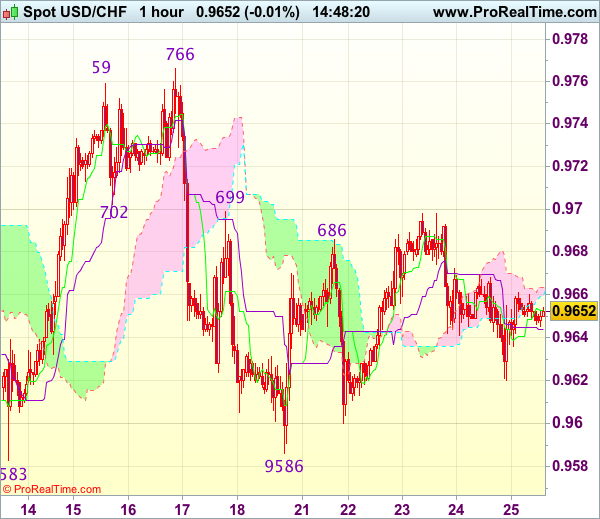
Trade Idea : USD/CHF – Hold long entered at 0.9620
USD/CHF - 0.9660
Most recent candlesticks pattern : N/A
Trend : Sideways
Tenkan-Sen level : 0.9654
Kijun-Sen level : 0.9644
Ichimoku cloud top : 0.9663
Ichimoku cloud bottom : 0.9663
Original strategy :
Bought at 0.9620, Target: 0.9720, Stop: 0.9585
Position : - Long at 0.9620
Target : - 0.9720
Stop : - 0.9585
New strategy :
Hold long entered at 0.9620, Target: 0.9720, Stop: 0.9595
Position : - Long at 0.9620
Target : - 0.9720
Stop : - 0.9595
Although the greenback retreated after faltering below resistance at 0.9699, outlook remains consolidative and reckon yesterday’s low at 0.9620 would limit downside, bring another rebound later, above indicated resistance at 0.9699 would signal the fall from 0.9766 has ended at 0.9586 last week and mild upside bias is seen for gain to 0.9720, then 0.9740, having said that, reckon resistance at 0.9766-73 would cap upside and bring further consolidation. Only a break of 0.9773 would retain bullishness and signal early rise from 0.9438 has resumed and extend gain to 0.9800.
In view of this, we are holding on to our long position entered at 0.9620. Below 0.9600 would risk test of strong support at 0.9583-86 but only break there would signal a downside break of recent broad range has occurred, bring subsequent fall to 0.9550.
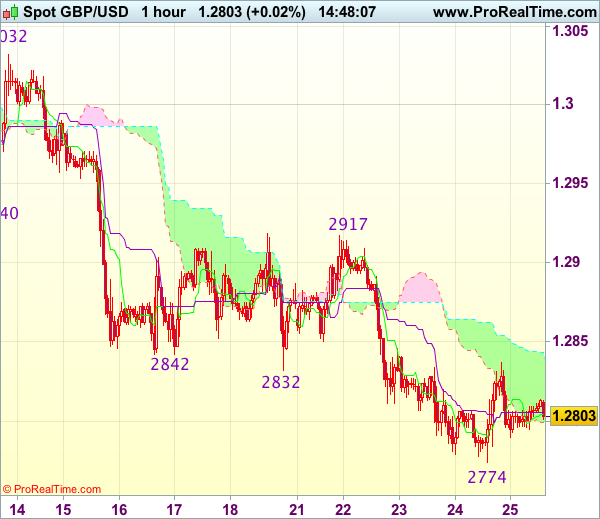
Trade Idea : GBP/USD – Buy at 1.2755
GBP/USD - 1.2804
Most recent candlesticks pattern : N/A
Trend : Near term down
Tenkan-Sen level : 1.2805
Kijun-Sen level : 1.2806
Ichimoku cloud top : 1.2838
Ichimoku cloud bottom : 1.2799
Original strategy :
Buy at 1.2760, Target: 1.2860, Stop: 1.2725
Position : -
Target : -
Stop : -
New strategy :
Buy at 1.2755, Target: 1.2855, Stop: 1.2720
Position : -
Target : -
Stop : -
As cable has retreated again after meeting resistance at 1.2837, retaining our view that near term downside risk remains for recent selloff to extend one more fall, however, loss of downward momentum should prevent sharp fall below 1.2750-55, risk from there has increased for a rebound to take place soon, above 1.2845-50 would suggest a temporary low is possibly formed, bring a stronger recovery to 1.2870, break there would add credence to this view, then retracement of recent decline would commence for further gain to 1.2900.
In view of this, we are inclined to turn long on next decline. Below 1.2740-50 would risk weakness to 1.2720-25, however, still reckon downside would be limited to 1.2700-05 (100% projection of 1.3269-1.2940 measuring from 1.3032) and risk from there remains for another rebound to take place later.
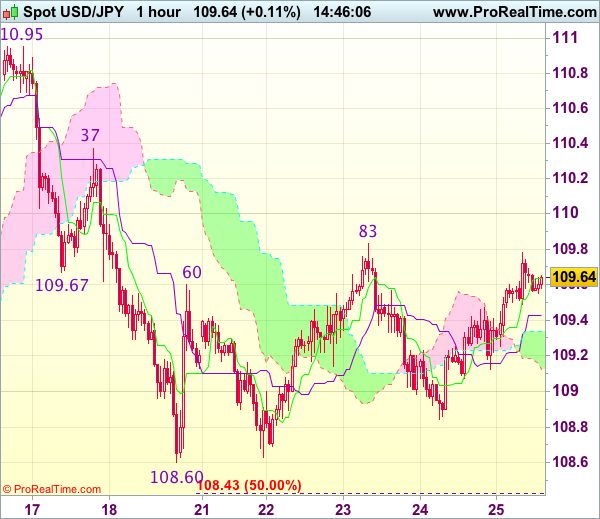
Trade Idea : USD/JPY – Buy at 109.25
USD/JPY - 109.65
Most recent candlesticks pattern : N/A
Trend : Near term down
Tenkan-Sen level : 109.64
Kijun-Sen level : 109.43
Ichimoku cloud top : 109.34
Ichimoku cloud bottom : 109.13
New strategy :
Buy at 109.25, Target: 110.25, Stop: 108.90
Position : -
Target : -
Stop : -
As the greenback found renewed buying interest at 108.84 yesterday and staged another rebound, suggesting a test of resistance at 109.83 (this week’s high) would be seen, break there would signal low has been formed at 108.60 earlier, bring further gain to 110.00 and later towards previous resistance at 110.37 which is likely to hold on first testing due to near term overbought condition.
In view of this, we are looking to buy dollar on dips as 109.20-25 should limit downside. Only below said support at 108.84 would abort and bring retest of said support at 108.60, break there would revive bearishness and confirm recent decline has resumed for further weakness to 108.30 (1.618 times projection of 110.95-109.67 measuring from 110.37), then towards 108.00.
Market Update – Asian Session: Asian Markets Quiet Ahead Of Yellen And Draghi
Asia Summary
Asian equities have been fairly quiet as traders await the Jackson Hole comments from the Fed’s Yellen and ECB’s Draghi. Earnings reports were seen from Qantas and Rusal. Shares of Samsung Electronics are little changed ahead of the expected court ruling in the corruption case involving Lee Jae-yong, who is viewed as the head of the Samsung conglomerate.
Key economic data
(JP) JAPAN JULY NATIONAL CPI Y/Y: 0.4% V 0.4%E; CPI EX FRESH FOOD (CORE) Y/Y: 0.5% V 0.5%E
(JP) Japan Aug Tokyo CPI Y/Y: 0.5% v 0.3%e; CPI Ex-Fresh Food (core) Y/Y: 0.4% v 0.3%e
(JP) JAPAN JUL PPI SERVICES Y/Y: 0.6% V 0.8%E
(KR) South Korea Aug Consumer Confidence: 109.9 v 111.2 prior
Speakers and Press
China
(CN) China NDRC: Urges steel sector to continue cutting overcapacity; to promote steel companies M&A in some regions; To increase effective steel supply to avoid market volatility.
Japan
(JP) Japan Government Official: Will consider reflecting discount smart-phone carrier charges in CPI data starting Jan next year at the earliest
(JP) Japan Chief Cabinet Sec Suga: Economy not in situation now that requires extra budget; To impose additional sanctions against North Korea
Other
(US) Fed's Kaplan (moderate, voter): Has not lost faith inflation will get back to 2%; Does not favor raising 2% inflation target
(PH) Philippines Central Bank Gov Espenilla: Allowed peso to adjust moderately and gradually, but BSP in firm control of peso (PHP) exchange rate; Reiterates confident peso won't go on 'free fall', definitely not in 'fx crisis'
(VE) Venezuela President Maduro names Del Pino as Oil Minister and Nelson Martinez as President of PDVSA
(VE) Under possible US sanctions, Venezuela’s bonds could be removed from the JPMorgan Emerging Market Bond Index – US financial press
Asian Equity Indices/Futures (00:30ET)
Nikkei +0.6%, Hang Seng +0.7%, Shanghai Composite +1.2%, ASX200 +0.3%, Kospi +0.1%
Equity Futures: S&P500 flat; Nasdaq +0.1 , Dax flat , FTSE100 flat
FX ranges/Commodities/Fixed Income (00:30ET)
EUR 1.1788-1.1804; JPY 109.50-109.77; AUD 0.7885-0.7907; NZD 0.7198-0.7218
Aug Gold flat at 1,291/oz; Aug Crude Oil +0.6% at $47.72/brl; Sept Copper -0.1% at $3.03/lb
GLD SPDR Gold Trust ETF daily holdings unchanged at 799.3 metric tons
(CN) China PBoC skips OMO v skipped 7 and 14-day reverse repo prior (2nd straight); Net drain CNY130B, drains net of CNY330B for week
(CN) PBOC SETS YUAN REFERENCE RATE AT 6.6579 V 6.6525 PRIOR
(JP) BoJ announces amounts to buy in QE operation; Cuts planned purchases of 5-10 yr JGBs to ¥410B from ¥440B prior
(AU) Australia sells A$600M in 1.75% 2020 Bonds, avg yield 1.9962%, bid to cover 5.75x
Equities notable movers
Australia
Qantas, QAN.AU, FY17 profits in line and announced dividend and buyback; +2.5%
Sims Metal, SGM.AU FY17 EBITDA above ests and declared a special dividend; +5%
Super Retail Group, SUL.AU FY17 profits rose; +8%
Hong Kong/China
Li & Fung, 494.HK H1 profits rose by 40% and above ests; +14.5%
PetroChina, 857.HK H1 profits above estimates; +3.5%
Rusal, 486.HK Q2 results above ests; -0.9%
US markets on close: Dow -0.1%, S&P500 -0.2%, Nasdaq -0.1%, Russell +0.3%
Best Sector in S&P500: Health Care +0.3%
Worst Sector in S&P500: Consumer Staples -1.4% (Amazon closed acquisition of Whole Foods and announced expected price cuts)
At the close: VIX 12.23 (-0.02 pts); Treasuries: 2-yr 1.338% (+3bps), 10-yr 2.196% (+3bps), 30-yr 2.769% (+2bps)
US Market Summary
Investors continued to remain on the sidelines in anticipation of the Jackson Hole Symposium. Major indices all posted moderate losses again in light trading, with a counter trend for small caps, as the Russell gained 4 points. Crude oil turned south again with a lack of new factors to prop-up price, while gasoline prices rose in advance of Hurricane Harvey. The WTI/gasoline crack spread surged as the predicted path of Harvey aims the storm at refiners, avoiding oil production platforms. Gold continued to hold its ground with low volatility and closing just short of $1,290. Treasuries took some selling pressure today with 10-year yield gaining 2.5 bps, back up at 2.19%, 10s30s curve spread steady at 58 bps.
US Afterhours Movers
ADMS FDA approves GOCOVRI as first and only medication for the treatment of Dyskinesia in Parkinson’s Disease patients; +35.4% afterhours
SPLK Reports Q2 $0.08 v $0.06e, Rev $280M v $268Me; Guides Q3 R$307-309M v $306Me, Non-GAAP op margin 8%; +8% afterhours
AVGO Reports Q3 $4.10 v $4.03e, Rev $4.46B v $4.46Be; Guides Q4 Rev $4.80B +/- $75M v $4.75Be, non-GAAP gross margin 63.0% +/- 1%; -4.2% afterhours
GME Reports Q2 $0.15 v $0.16e, Rev $1.69B v $1.62Be; SSS +1.9% (-1.4% in US, +3.4% internationally); -7.9% afterhours
VEEV Reports Q2 $0.25 v $0.20e, Rev $166.6M v $164Me (1 est.); Guides Q3 $0.21-0.22 v $0.21e, Rev $171-172M v $171Me; -8.4% afterhours
UEPS Reports Q4 $0.20 v $0.44e, Rev $155M v $173Me; Guides initial FY18 EPS at least $1.61 v $1.85e; -11.5% afterhours
ECB In Getting Inflation Higher
Market movers today
Today is the day we've waiting for all week with both ECB President Mario Draghi and Fed President Janet Yellen speaking at the Jackson Hole Symposium. Yellen will speak at 16: 00 CET on the subject of financial stability. It will be interesting to hear her thought s on the how monetary policy plays a role in this. While full employment and inflation at 2% are the Fed's main objectives, financial stability can play a role too. If she gives any policy signals, we expect her to mirror Fed vice President Bill Dudley's comments last week that another rate hike is warranted this year if the economy holds up. If so, it could be interpreted a bit on the hawkish side given the market is pricing in only a third of a likelihood of a hike by end-year.
Tonight focus will turn to Mario Draghi, due to speak at 21:00 CET. We expect him to lean on the dovish side as the euro strength has challenged the ECB in getting inflation higher and is causing some concern within the ECB, according to the minutes from the previous meeting. He may refrain from giving any signals on tapering as signalled by a recent Reuters' story that quoted two ECB sources saying he would not be giving any new policy signals but await the tapering discussion in the ECB Council in the autumn. See also Euro Area: Draghi returns to Jackson Hole with a dovish message 18 August 2017.
On the data front , we have the German ifo index and US durable goods orders today. These will be in the background though, as attention today will be on Jackson Hole.
In Sweden, PPI and household lending data are due to be published. See Scandi Markets on page 2 for more details.
Selected market news
Concerns about the US debt ceiling negotiations increased further yesterday after President Trump last night , in a series of tweets, blamed top Republican leaders for ignoring his advice on raising the debt ceiling and creating a ‘mess'. Earlier this week, Trump threatened to veto any deal and thereby force a government shutdown if Congress did not pay for his proposed border wall to Mexico. Yields on US treasury bills maturing on 12 October spiked 5bp yesterday – the largest intraday move since March – on rising concerns that the government might miss the payment . Congress needs to agree on a spending plan no later than 30 September to avoid a government shutdown and the Congressional Budget Office (CBO) estimates that the Treasury will run out of money sometime in October.
Japanese consumer prices inched slightly higher to 0.5% y/y in July from 0.4% in June. The weak inflation development in Japan, despite solid GDP growth and the fact that the output gap is closed, underscores that the Bank of Japan (BoJ) is still struggling to push up inflation. Given the BoJ's inflation overshooting commitment, where it has promised to continue ease monetary policy until inflation and inflation expectations are above 2% in a stable manner, we expect the BoJ to maintain its current accommodative monetary policy at least throughout our 12-month forecast horizon, support ing the case for a higher EUR/JPY, driven by widening real interest rate spread and continued port folio out flows out of Japan. We target EUR/JPY at 142 in 12 months.
Aussie Dollar Trading A Tad Lower This Morning
For the 24 hours to 23:00 GMT, the AUD declined 0.09% against the USD and closed at 0.7901.
LME Copper prices rose 0.3% or $22.0/MT to $6577.0/MT. Aluminium prices rose 1.1% or $22.5/MT to $2105.0/MT.
In the Asian session, at GMT0300, the pair is trading at 0.79, with the AUD trading marginally lower against the USD from yesterday's close.
The pair is expected to find support at 0.7875, and a fall through could take it to the next support level of 0.7849. The pair is expected to find its first resistance at 0.7918, and a rise through could take it to the next resistance level of 0.7935.
Next week, traders will closely monitor Australia's building approvals and HIA new home sales data.
The currency pair is showing convergence with its 20 Hr and 50 Hr moving averages.

Euro Trading Flat, Ahead Of German Ifo Survey Data
For the 24 hours to 23:00 GMT, the EUR declined 0.12% against the USD and closed at 1.1800.
Macroeconomic data released in the US indicated that existing home sales unexpectedly eased by 1.3% on monthly basis to a level of 5.44 million in July, dipping to an eleven-month low level and offering signs of a slowdown in the nation’s housing sector. Market participants had envisaged existing home sales to rise to a level of 5.55 million, after recording a revised level of 5.51 million in the prior month. Meanwhile, the nation’s initial jobless claims rose less-than-anticipated to a level of 234.0K in the week ended 19 August, compared to market consensus for a rise to a level of 238.0K. Initial jobless claims had recorded a level of 232.0K in the previous week.
In the Asian session, at GMT0300, the pair is trading at 1.1800, with the EUR trading flat against the USD from yesterday’s close, as investors look forward to remarks from key central bankers at a meeting in Jackson Hole, to get cues on the path of monetary policy.
The pair is expected to find support at 1.1784, and a fall through could take it to the next support level of 1.1769. The pair is expected to find its first resistance at 1.1815, and a rise through could take it to the next resistance level of 1.1831.
Going ahead, investors will look forward to Germany’s Ifo expectations and business climate indices for August along with the final 2Q GDP report, scheduled to release in a few hours. Moreover, the US flash durable goods orders for July, set to release later in the day, will be eyed by traders.
The currency pair is showing convergence with its 20 Hr and 50 Hr moving averages.

UK’s Economic Growth Confirmed At 0.3% In 2Q 2017
For the 24 hours to 23:00 GMT, the GBP marginally declined against the USD and closed at 1.2802.
On the macro front, second estimate of gross domestic product (GDP) rose 0.3% on a quarterly basis in the second quarter of 2017, confirming the flash estimate. In the prior quarter, the nation's GDP had advanced 0.2%. Additionally, the nation's BBA mortgage approvals surged to a five-month high level of 41.59K in July. In the prior month, BBA mortgage approvals had recorded a revised reading of 40.39K.
On the other hand, the nation's preliminary total business investment remained flat on a quarterly basis in the three months to June, meeting market expectations. In the prior quarter, total business investment had climbed 0.6%.
In the Asian session, at GMT0300, the pair is trading at 1.2809, with the GBP trading slightly higher against the USD from yesterday's close.
The pair is expected to find support at 1.2776, and a fall through could take it to the next support level of 1.2744. The pair is expected to find its first resistance at 1.2839, and a rise through could take it to the next resistance level of 1.2870.
Amid a lack of any macroeconomic releases in Britain today, investors will focus on UK's Markit manufacturing PMI, consumer credit and GfK consumer confidence data, all due to release next week.
The currency pair is showing convergence with its 20 Hr and 50 Hr moving averages.
