Sample Category Title
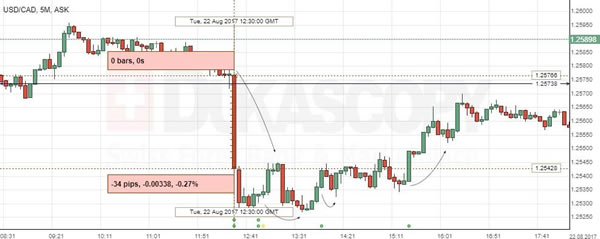
USD/CAD: Retail Sales
Tuesday's reports on Canadian retail sales and core retail sales were in overall strong enough to result in a 34 base points fall of the USD/CAD exchange rate. However, by the end of the session the pair returned to the levels seen before the release. The Greenback is expected to keep trying to get stronger footing against the CAD in the absence of Canadian economic data today.
Statistics Canada said that the country's retail sales growth slowed more than expected to 0.1% in June from a downwardly revised 0.5% rise in the prior month, while the core measure increased strongly 0.7% after 0.1% drop in the same period. The latest report confirmed expectations for the Bank of Canada to raise interest rates once again in October.
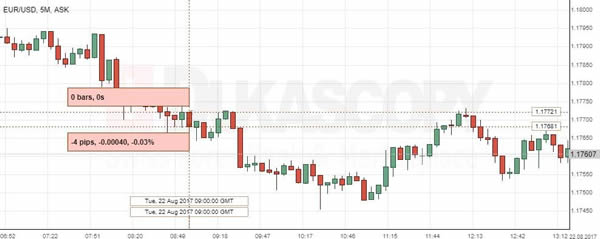
EUR/USD: German ZEW Economic Sentiment
The Euro continued depreciation against the US Dollar, as the ZEW report showed notable weakening in the German investors' confidence. The EUR/USD fell initially just by 4 base points to continue the trading session below the 1.1768 level.
The Mannheim-based Centre for European Economic Research stated that its German Economic Sentiment Index came in at 10.0 points for August, showing a decline for the third consecutive month. A decrease was fuelled by concerns over the further expansion of the Germany's economy, as the scandal in the country's automobile sector was likely to affect the stability of growth. On the contrary, the current situation in the Euro zone was evaluated much higher than expected.
AUD/USD Elliott Wave Analysis
AUD/USD – 0.7885
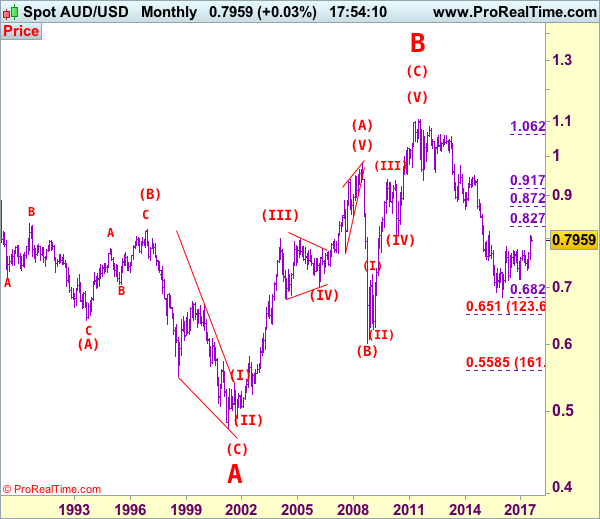
Despite staging a brief bounce to 0.7963 last week, lack of follow through buying and the subsequent retreat suggest consolidation below this level would be seen and test of support at 0.7869 cannot be ruled out, however, reckon downside would be limited to 0.7820-25 and support at 0.7808 (last week’s low) should hold, bring further sideways trading. A drop below this support would signal another leg of corrective fall from 0.8066 temporary top is underway, bring retracement of recent upmove to 0.7760 (61.8% Fibonacci retracement of 0.7571-0.8066) and then test of previous resistance at 0.7712 but reckon downside would be limited to 0.7640-50.
We are keeping our count that top has been formed at 1.1081 (wave 5 of V) and major correction (A-B-C-X-A-B-C) has commenced, indicated downside targets at 0.7945 (61.8% Fibonacci retracement of entire rise from 0.6007-1.1081) and 0.7750 had been met and downside bias is seen for further weakness to 0.6800, then 0.6700 but reckon 0.6500 would hold from here.
Our preferred count is that the rally from 0.6007 to 0.7270 (7 Jan 2009) is marked as wave A, the retreat to 0.6248 (2 Feb 2009) is wave B and the subsequent upmove is labeled as wave C with wave (iii) and wave (iv) ended at 0.8265 and 0.7700 respectively and wave (v) as well as 3 ended at 0.9407, then wave 4 ended at 0.8066 (instead of 0.8578). The wave 5 has met our indicated projection target of 1.1060 and could ended at 1.1081, this level is now treated as the peak of wave (C) as well as larger degree wave B, hence major fall in wave C has commenced, our initial downside target at psychological support at 0.7000 has just been met and further weakness to 0.6500 would be seen later.
On the upside, expect recovery to be limited to 0.7925-30 and said resistance at 0.7963 should hold, bring further consolidation. A daily close above 0.7963-80 resistance area would signal first leg of corrective decline from 0.8066 top has ended, risk a stronger rebound to 0.8000, however, only a sustained breach above 0.8000 would bring retest of 0.8066, break there to signal medium term erratic rise from 0.6827 (2016 low) has resumed and extend gain to 0.8100, then towards previous resistance at 0.8163.
Recommendation: Stand aside for this week.
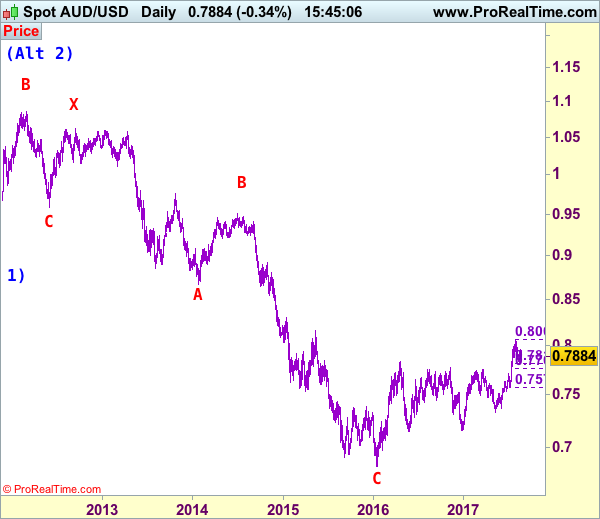
Our alternate count on the daily chart treated the top formed in 2008 at 0.9851 could be a larger degree wave I and was followed by a deep and sharp correction in wave II to 0.6007 and wave III is unfolding from there.
The long-term uptrend started from 0.4775 (2 Apr 2001) with an impulsive structure. Wave I is labeled as 0.4775 to 0.9851 (15 Jul 2008), wave II has ended at 0.6007 (Oct 2008) and wave III is still in progress which may extend further gain to 1.1265.
Forex Technical Analysis: EUR/USD, USD/JPY, GBP/USD
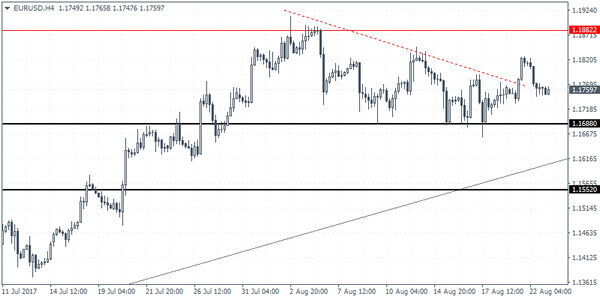
EUR/USD
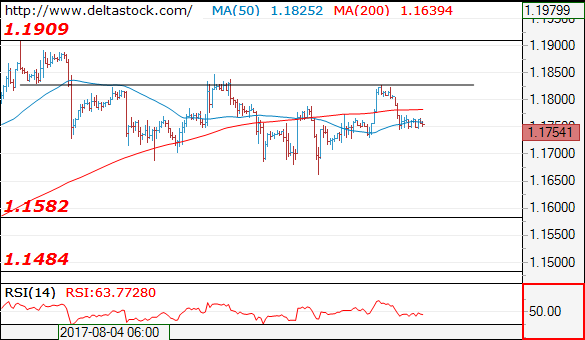
Current level - 1.1754
My outlook here is bearish, for a break through 1.1730, towards 1.1660 low, en route to 1.1580 area.
| Resistance | Support | ||
| intraday | intraweek | intraday | intraweek |
| 1.1830 | 1.1909 | 1.1730 | 1.1580 |
| 1.1850 | 1.2000 | 1.1580 | 1.1480 |
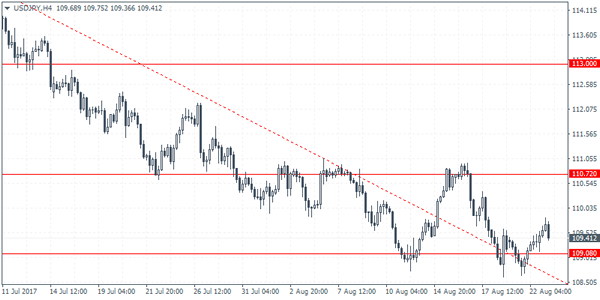
USD/JPY
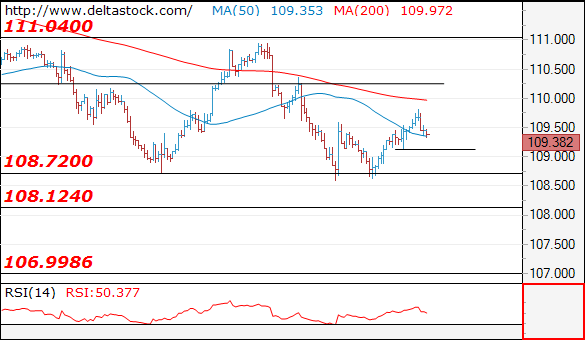
Current level - 109.38
Yesterday's rise has been reversed at 109.80 and the bias is already negative, for a break through the trigger 109.10, towards 108.10 and 107.00.
| Resistance | Support | ||
| intraday | intraweek | intraday | intraweek |
| 109.80 | 111.00 | 109.10 | 108.10 |
| 110.30 | 112.20 | 108.10 | 107.00 |
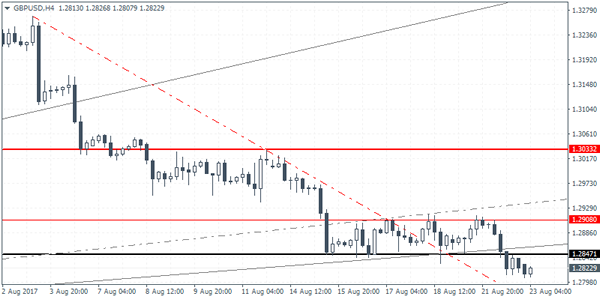
GBP/USD
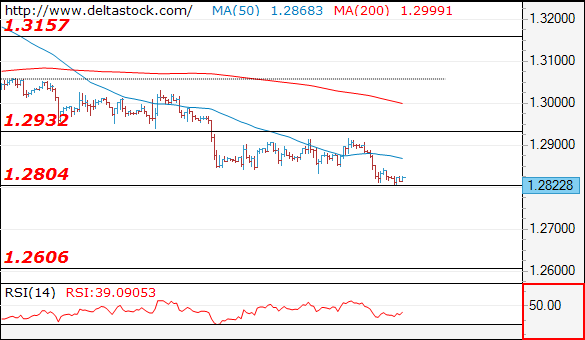
Current level - 1.2822
The downtrend has been renewed and the bias is bearish, for a break through 1.2804, towards 1.2600 area. Crucial on the upside is still 1.2930 area.
| Resistance | Support | ||
| intraday | intraweek | intraday | intraweek |
| 1.2930 | 1.3260 | 1.2804 | 1.2804 |
| 1.3050 | 1.3500 | 1.2705 | 1.2606 |
USDJPY Intraday Analysis
USDJPY (109.41): The USDJPY posted strong gains yesterday rising to a three day high and clearing above the price level of 109.15 which has acted as support so far. Currently, the weakness in the currency pair is seen pushing USDJPY lower back to 109.15. A rebound off this level could, however, keep the bias to the upside. The resistance level of 110.72 remains in focus currently as long as the support is held. In the event that USDJPY fails the support once again, we could expect to see the current ranging price action to continue.
GBPUSD Intraday Analysis
GBPUSD (1.2822): The British pound weakened strongly with price closing below 1.2847 support. However, the declines were limited which could mean that there is a possibility for the price to rebound to the upside. However, on the 4-hour chart, the price has broken to the downside. Therefore, a retest of the broken support at 1.2847 could turn to resistance. A reversal at this level could suggest further downside in price towards 1.2786 marking the completion of the downside move following the breakout from the range.
EURUSD Intraday Analysis
EURUSD (1.1759): The EURUSD weakened slightly yesterday, but price action was subdued, trading within the confines from Monday's range that was established. After rallying towards the highs from 11 August, EURUSD gave up the gains as the price fell back. The decline coincides with the upside breakout from the ascending triangle. The current retest of this breakout level could see price attempt to make another move to the upside. However, further gains are likely to be limited. This potentially keeps EURUSD range bound with support at 1.1688 in focus. A breakdown below this support will extend further declines in the currency pair. To the upside, the previously established range remains in place at 1.1882.
The Euro Currency Slips Ahead Of Draghi’s Speech
The US dollar was seen strengthening across the board yesterday. The modest gains come in anticipation of central bank chiefs convening at the Jackson Hole Symposium that is due to start tomorrow.
The economic calendar was light yesterday. Data from Canada showed that retail sales rose 0.1% which was lower than the median forecasts. Previous month's data was also revised down to show a 0.5% increase. Core retail sales, however, increased 0.7% on the month beating forecasts.
Looking ahead the economic data today will include a speech by ECB President Mario Draghi who will be speaking at an event in Germany. This could be the key event risk for the euro currency today. Later in the day, the Eurozone flash PMI's will be released for August. In the US flash manufacturing and services PMI from Markit will be coming up, and FOMC voting member Kashkari is scheduled to speak.
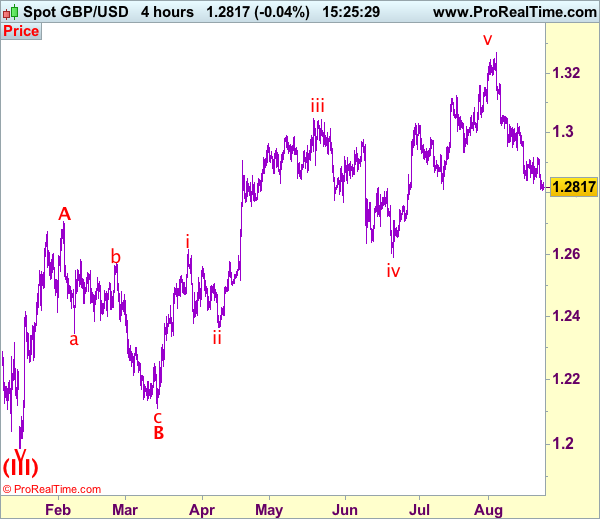
Trade Idea: GBP/USD – Sell at 1.2910
GBP/USD – 1.2828
Original strategy :
Sell at 1.2910, Target: 1.2710, Stop: 1.2970
Position: -
Target: -
Stop: -
New strategy :
Sell at 1.2910, Target: 1.2710, Stop: 1.2970
Position: -
Target: -
Stop:-
As cable has remained under pressure after breaking below support at 1.2832, adding credence to our bearish view that the selloff from 1.3269 top is still in progress and downside bias remains for this move to bring at least a retracement of early upmove to 1.2800, then 1.2770-75, below there would extend weakness to 1.2750, however, near term oversold condition should prevent sharp fall below previous support at 1.2706, risk from there has increased for a rebound later.
In view of this, would not chase this fall here and would be prudent to sell cable on recovery as said resistance at 1.2918 should limit upside, bring another decline. Above 1.2970-80 would defer and risk a stronger rebound to 1.3000 and possibly test of resistance at 1.3032, however, only break of latter level would abort and signal the fall from 1.3269 has ended instead, bring a stronger rebound to 1.3059 and possibly towards 1.3100 but previous support at 1.3112 (now resistance) should remain intact.
Our preferred count on the daily chart is that cable's rebound from 1.3500 (wave (A) trough) is unfolding as a wave (B) with A ended at 1.7043, followed by triangle wave B and wave C as well as wave (B) has ended at 1.7192, the subsequent selloff is the larger degree wave (C) which is still unfolding with minor wave (III) of larger degree wave 3 ended at 1.1986, hence wave (IV) correction is in progress which could either be a triangle wave (IV) of a complex formation but upside should be limited to 1.3500 and price should falter well below 1.4000, bring another decline in wave (V) of 3 for weakness to 1.1500, then 1.1200.
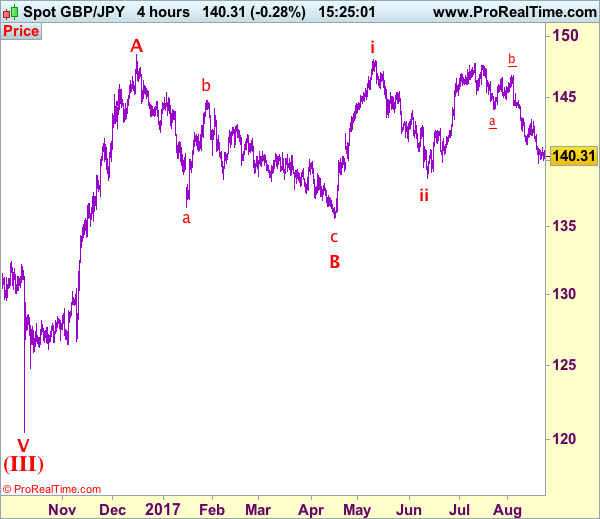
Trade Idea: GBP/JPY – Sell at 141.40
GBP/JPY - 140.35
Original strategy:
Sell at 141.40, Target: 139.40, Stop: 142.00
Position: -
Target: -
Stop: -
New strategy :
Sell at 141.40, Target: 139.40, Stop: 142.00
Position: -
Target: -
Stop:-
As the British pound has remained confined within recent established range, suggesting further sideways trading would take place before recent decline from 147.75 top resumes, a break below last week’s low at 139.80 would extend this decline to 139.50 but loss of downward momentum should prevent sharp fall below 139.00-10 and price should stay well above previous support at 138.70.
In view of this, we are looking to sell sterling on subsequent recovery as 141.40-50 should limit upside and bring such a decline. Only a break of resistance at 142.05 would suggest low is possibly formed instead, bring a stronger rebound to 142.50-60 but resistance at 143.20 should remain intact and bring another decline later.
Our preferred count is that larger degree wave V with circle is unfolding from 251.12 with wave (I) 219.34, (II): 241.38 and wave (III) is subdivided into 1: 192.60, 2: 215.89 (23 Jul 2008) and wave 3 ended at 118.87 earlier in 2009. The correction from there to 162.60 is wave 4 which itself is a double three and is labeled as first a-b-c ended at 151.53, followed by wave x at 139.03, 2nd a ended at 162.60, 2nd b at 146.75 and 2nd c leg of wave 4 ended at 163.00. Therefore, the decline from 163.00 to 116.85 is now treated as wave 5 which also marked the end of larger degree wave (III), hence wave (IV) major correction has commenced for retracement of the wave (III) from 241.38 and upside target at 183.95-00 (50% Fibonacci retracement of the wave (II) from 241.38) had been met, a drop below 160.00 would suggest wave (IV) has ended at 195.85, bring decline in wave (V) for initial weakness to 130 (already met) and 120.