
Sample Category Title
Investors’ Focus Turns To Jackson Hole Fed Conference In Wyoming This Week
Dollar Moves Away From Friday's 4-Month Low Vs Yen. The dollar inched up early on Monday, moving away from the four-month low against the yen weighed in the previous session on concerns that White House personnel changes will impair President Donald Trump's ability to pass tax reform and stimulus measures. The dollar was up 0.1 percent at 109.265 yen, after it fell as low as 108.605 yen on Friday, the lowest since late April.
Euro Steady Against Its Major Counterparts. European Central Bank will not deliver a new policy message at the Fed conference, two sources familiar with the situation said, tempering expectations for ECB to start charting the course out of stimulus. About $45 billion of euro-dollar currency options on the exchange rate will expire in the three days leading up to the Wyoming meeting.
Oil Stable As Market Conditions Tighten. Oil markets were stable early on Monday, holding on to Friday's big gains despite rising U.S. output that weighed on hopes the market will tighten with crude inventories down 13 percent since March. Traders said the market was somewhat held back by rising U.S. production, which has broken through 9.5 million barrels per day (bpd), its highest since July 2015. The Baker Hughes energy services firm reported on Friday that the rise in U.S. output may soon slow, as energy firms cut rigs drilling for new oil for a second week in three.
Euro Likely To Consolidate In The Week Ahead
Key Points:
- Price action takes a sideways direction.
- RSI Oscillator trending lower within neutral territory.
- Pair likely to remain flat in the week ahead but watch for any upside breakouts.
The Euro continued its process of consolidation over the past week and trended sideways whilst giving up around 75 pips to close at 1.1759. Fundamentally, the pair was impacted by a relatively broad sentiment swing towards the USD which largely overshadowed the stronger than expected EU GDP figures. However, it remains to be seen if the pair will retain this sideways bias in the week ahead. Subsequently, it may be salient to review last week’s events with a view to ascertain what could be potentially looming on the near term horizon.
The Euro Dollar continued to moderate its recent gains over the past week which saw the pair give up around 75 pips in a gradual slow slide to close around the 1.1759 mark. Although, price action did initially move below near term support it soon rose again to retain its largely sideways direction. In addition, there was a very definite bid towards the USD which also impacted the pair. This was fuelled by a fall in the U.S. Initial Jobless Claims figures to 232k as well as a rise to 18.9 in the Philly Fed Business Outlook Index and ongoing speculation that the U.S. Federal Reserve will commence a balance sheet taper in the coming months. Subsequently, this also overshadowed what proved to be a relatively robust EU GDP result of 2.2% and the Euro saw little in the way of a bump from the result.
Looking ahead, the week ahead will be relatively busy for the Euro Dollar given the huge bevy of U.S. Economic data which is due for release. In particular, expect the U.S. Core Durable Goods Orders result, forecast at 0.4% m/m, to make its presence keenly felt. In addition, the German IFO Business Climate numbers are also due out and the market is broadly predicting a 115.5 print from the release. Finally, the Jackson Hole Economic Symposium is happening in the latter part of the week and this always brings with it some interesting information and potential volatility. Janet Yellen is on the schedule to speak this year and is probable to provide plenty of commentary on U.S. economic policy given how close the Fed is to potentially commencing a balance sheet taper. Subsequently, it would pay dividends to monitor the proceedings closely in the coming days.
From a technical perspective, the pair is now clearly within a consolidation phase from the recent 1.1908 high. Subsequently, what we are currently seeing is plenty of sideways movement which is relieving the pressure on the oscillators. We expect this pattern to continue in the week ahead and our initial bias is, therefore, neutral. Any large downside moves should be capped by support around 1.1606 as the pair continues to consolidate its position. Support is currently in place for the pair at 1.1685, 1.1606, and 1.1478. Resistance exists on the upside at 1.1908, 1.1977, and 1.2179.
Ultimately, the Euro Dollar is likely to take a relatively leisurely sideways direction in the coming week unless a major economic event occurs. However, an upside breakout is highly probably sometime over the near term so watch for any moves back above the 1.1908 high.
Daily Technical Analysis: EUR/USD Develops Bull Flag Chart Pattern At Support Zone
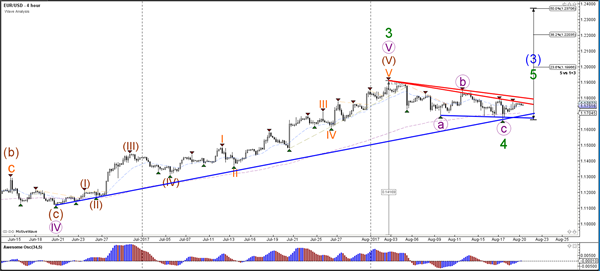
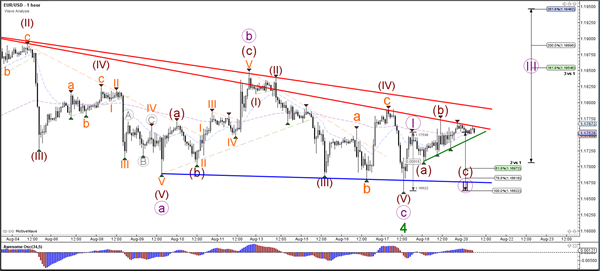
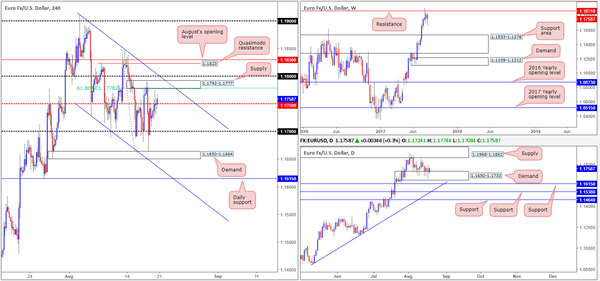
Currency pair EUR/USD
The EUR/USD is building a bull flag continuation chart pattern above the long-term trend line (blue), local support (blue), and long-term moving average, which favours a wave 4 (green) correction. A bullish break above resistance (red) would confirm the end of wave 4 and start of wave 5.
The EUR/USD seems to be building a wave 1-2 (purple) as long as price stays above the 100% Fib level of wave 2 vs 1. A break above resistance (red) line could see the start of wave 3.
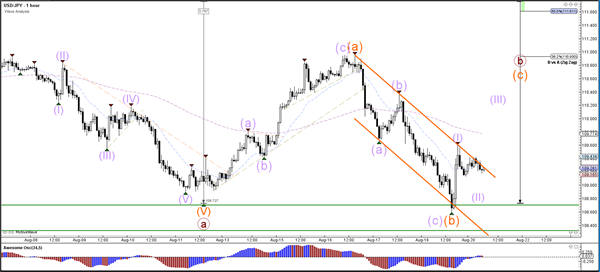
Currency pair USD/JPY
The USD/JPY has retested key support zone (green lines), which will act as bounce or break spot. A bullish bounce could see price expand a wave B (brown) correction via an ABC (orange) flat whereas a bearish break would indicate a downtrend continuation and the completion of wave B (brown) at 111 (where A orange is now).
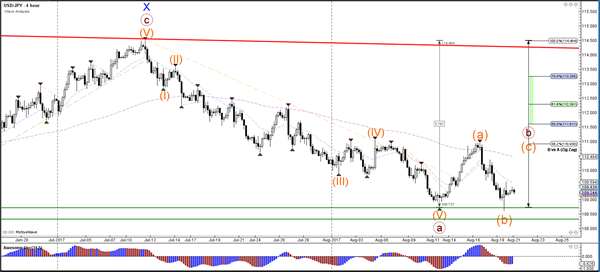
The USD/JPY is testing the resistance trend line of the bearish channel (orange lines).
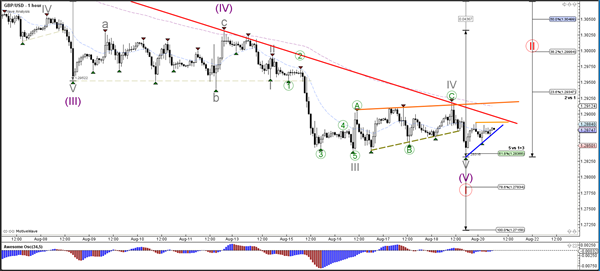
Currency pair GBP/USD
The GBP/USD could have completed a 5th wave (purple) within wave 1 (red). A bearish bounce at the resistance trend line (red) could see price move lower towards the Fib targets of wave 5.
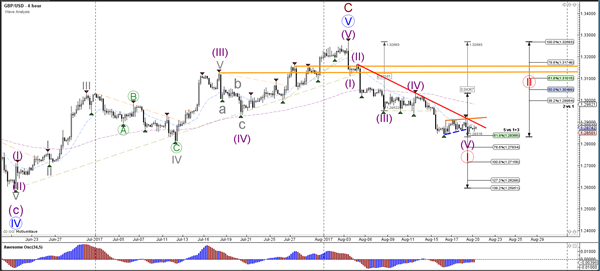
A GBP/USD bullish break above resistance (red/orange) could see the start of a wave 2 (red).
Weekly Technical Outlook And Review: EUR/USD, GBP/USD, AUD/USD, USD/JPY, USD/CAD, USD/CHF, DOW 30, GOLD
A note on lower timeframe confirming price action...
Waiting for lower timeframe confirmation is our main tool to confirm strength within higher timeframe zones, and has really been the key to our trading success. It takes a little time to understand the subtle nuances, however, as each trade is never the same, but once you master the rhythm so to speak, you will be saved from countless unnecessary losing trades. The following is a list of what we look for:
- A break/retest of supply or demand dependent on which way you're trading.
- A trendline break/retest.
- Buying/selling tails ... essentially we look for a cluster of very obvious spikes off of lower timeframe support and resistance levels within the higher timeframe zone.
- Candlestick patterns. We tend to only stick with pin bars and engulfing bars as these have proven to be the most effective.
We typically search for lower-timeframe confirmation between the M15 and H1 timeframes, since most of our higher-timeframe areas begin with the H4. Stops are usually placed 1-3 pips beyond confirming structures.
EUR/USD
Weekly gain/loss: – 63 pips
Weekly closing price: 1.1758
Despite weekly action seen trading from resistance at 1.1871, price has yet to generate anything noteworthy to the downside. A similar picture can be seen on the US dollar index (USDX), only inverse from a weekly support drawn in at 11854. A violation of the current resistance level directly exposes another resistance pegged at 1.2044 (not seen on the screen), whereas a move south from current price could see the unit drive into a large support area at 1.1533-1.1278.
Down on the daily timeframe, demand at 1.1650-1.1733 elbowed its way back into the picture early last week and held firm. If this area caves in, a nearby support is seen lurking below at 1.1615. In addition to this, traders may have also noticed that the USDX is trading from daily demand at 11899-11932, which may suggest buyer weakness from 1.1650-1.1733.
A quick recap of Friday's sessions on the H4 timeframe shows the shared currency inched higher, marginally closing the day above the mid-level resistance 1.1750. For breakout traders looking to buy here, you may want to take note that there's limited upside potential from this angle. Directly above sits a supply positioned at 1.1792-1.1777, which intersects with not only a 61.8% Fib resistance at 1.1778 (taken from the high 1.1847), but also a channel resistance extended from the high 1.1910 and the psychological handle 1.18. Further adding to this, we can see that the USDX H4 candles are trading from a trendline support extended from the low 11853.
Suggestions: While it's tempting to look for a shorting opportunity from the noted H4 supply given its surrounding confluence, one still has to remain cognizant of the current daily demand! For that reason we're going to approach this market conservatively. Waiting for additional H4 candle confirmation to form from the H4 supply mentioned above at 1.1792-1.1777 in the shape of a full, or near-full-bodied bearish candle, is the safer route to take we believe.
Data points to consider: No high-impacting events scheduled to be released today.
Levels to watch/live orders:
- Buys: Flat (stop loss: N/A).
- Sells: 1.1792-1.1777 ([waiting for a reasonably sized H4 bearish candle to form – in the shape of either a full, or near-full-bodied candle – is advised] stop loss: ideally beyond the candle's wick).
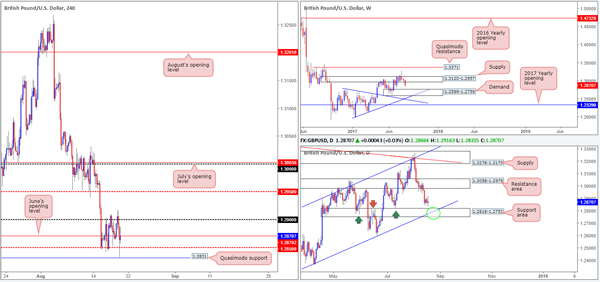
GBP/USD:
Weekly gain/loss: – 138 pips
Weekly closing price: 1.2870
Last week's sharp run to the downside pushed the British pound into further losses, stripping close to 150 pips off its value. From the weekly timeframe, the next notable area to keep an eye on is the demand base coming in at 1.2589-1.2759. What's also notable from a technical perspective on this chart is the two intersecting trendline supports positioned just beneath the demand zone (1.2774/1.1986).
Meanwhile, on the daily timeframe there's a nearby support area marked at 1.2818-1.2752, seen intersecting nicely with a channel support line etched from the low 1.2365 (green circle). Also of particular interest is this area happens to be glued to the top edge of the aforementioned weekly demand.
Since Tuesday, the H4 candles have been consolidating between the 1.29 handle and the mid-level support at 1.2850 (encased within this range is June's opening level at 1.2870). Early on in Friday's US segment, nevertheless, the pair whipsawed through the lower edge of this range, and came within a few pips of testing a Quasimodo support level printed at 1.2831.
Suggestions: In view of the unit's close proximity to the top edge of the daily support area at 1.2818, we have our eye on the 1.28 handle drawn on the H4 timeframe for possible longs. Given the support and resistance delivered from this psychological band in the past, and its connection with the converging daily support area and channel support, we feel a long from here is high probability.
However, since round numbers are prone to fakeouts, we would not feel comfortable placing pending orders here. Instead, we'll wait for a H4 bull candle to form in the shape of a full, or near-full-bodied candle, before pulling the trigger. As for take-profit targets, we'll be looking to the 1.2850 neighborhood as the initial area of concern.
Data points to consider: No high-impacting events scheduled to be released today.
Levels to watch/live orders:
- Buys: 1.28 region ([waiting for a reasonably sized H4 bullish candle to form – in the shape of either a full, or near-full-bodied candle – is advised] stop loss: ideally beyond the candle's tail).
- Sells: Flat (stop loss: N/A).
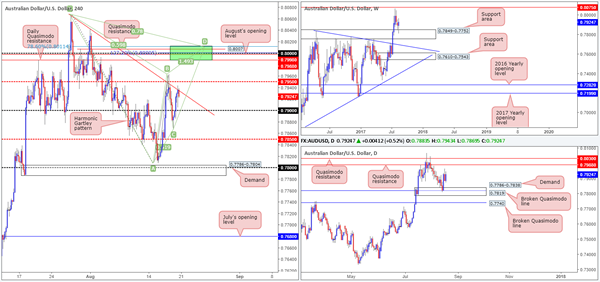
AUD/USD:
Weekly gain/loss: + 32 pips
Weekly closing price: 0.7924
Over the course of last week's trading, the commodity currency remained above the weekly support area coming in at 0.7849-0.7752. Providing that the bulls continue to bid this market higher from here, the next upside target can be seen at 0.8075: a resistance that stretches as far back as September 2008.
The response from the weekly support zone, coupled with daily flow bouncing from a demand base seen at 0.7786-0.7838 (encases a broken Quasimodo level at 0.7819), could lead to a move north up to the Quasimodo resistance level at 0.7988 sometime this week.
A brief look at recent dealings on the H4 timeframe, however, shows price reclaimed the 0.79 handle and ended the day shaking hands with a trendline resistance extended from the high 0.8065. Consequent to this recent movement, the large psychological 0.80 level has appeared on our radar. Apart from 0.80 being a watched round number, there are several nearby structures that deserve mention:
The daily Quasimodo resistance level at 0.7988.
A H4 Quasimodo resistance level at 0.8007.
A H4 127.2% Fib ext. point at 0.80 taken from the low 0.7807.
August's opening level at 0.7998.
A H4 Harmonic Gartley reversal point at the 78.6% Fib resistance line drawn from 0.8011.
Suggestions: While the above structures (H4 green sell zone) boast attractive confluence, one must take into account the possibility that a fakeout may be seen up to the daily Quasimodo resistance level at 0.8030 sited just above the green zone. Traditionally, when trading the Gartley Harmonic pattern the stop-loss order should go beyond the X point (0.8065). If you were to follow this, a fakeout up to the daily Quasimodo resistance is not a concern. It is more for the aggressive traders who will likely look to position stops just beyond the green zone. Should you be one of those traders, you may want to consider waiting for the H4 candles to prove seller intent (in the form of either a full, or near-full-bodied candle), before pressing the sell button. This will help avoid a fakeout should it occur.
Data points to consider: No high-impacting events scheduled to be released today.
Levels to watch/live orders:
- Buys: Flat (stop loss: N/A).
- Sells: 0.8011/0.7988 (stop loss: either wait for a H4 bearish candle to form in the shape of a full, or near-full-bodied candle, and place stops above the candle's wick. Another option is to simply enter at 0.80 and place stops above the H4 Harmonic X point at 0.8067).
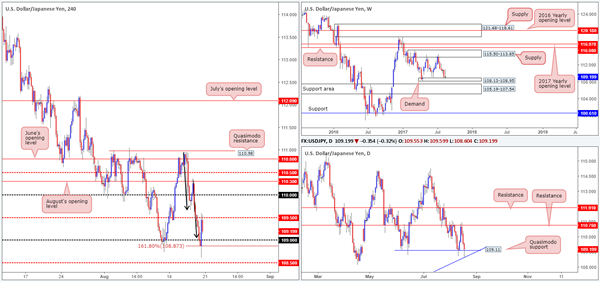
USD/JPY:
Weekly gain/loss: + 2 pips
Weekly closing price: 109.19
USD/JPY prices are little changed this morning, despite the pair ranging 230 pips last week. Weekly price, as you can see, struggled to gain momentum from the demand area at 108.13-108.95 and, as a result, has recently chalked up an inverted pin-bar candle. To candlestick enthusiasts, this is considered a buy signal.
After a rather dominant selloff from the daily resistance at 110.76 last week, daily price ended the week retesting a Quasimodo support at 109.11 and its converging trendline support etched from the low 100.08. To our way of seeing things, apart from 17/04/17 low 108.13, the next support hurdle on the hit list (should the current daily supports give way that is) is seen as far down as the broken daily Quasimodo support drawn from 106.81.
Looking at the H4 timeframe this morning, Friday's trade saw price aggressively whipsaw through both the 109 hurdle and AB=CD (black arrows) 161.8% Fib ext. point 108.87, and end the week retesting the mid-level resistance at 109.50. A close above 109.50 would, in our humble opinion, be a sign of strength from both the weekly and daily supports currently in play.
Suggestions: Essentially, we're going to be watching for the H4 candles to close above 109.50. This – coupled with a retest at this mid-level number and a H4 bullish rotation candle (preferably a full, or near-full-bodied candle) would, in our view, be enough to justify a long entry. As far as targets go, the daily resistance at 110.76 is of interest, but it'd be great if we could trail this beauty as far north as the weekly supply coming in at 115.50-113.85.
Data points to consider: No high-impacting events scheduled to be released today.
Levels to watch/live orders:
- Buys: Watch for H4 price to engulf 109.50 and then look to trade any retest seen thereafter ([waiting for a reasonably sized H4 bullish candle to form following the retest – in the shape of either a full, or near-full-bodied candle – is advised] stop loss: ideally beyond the candle's tail).
- Sells: Flat (stop loss: N/A).
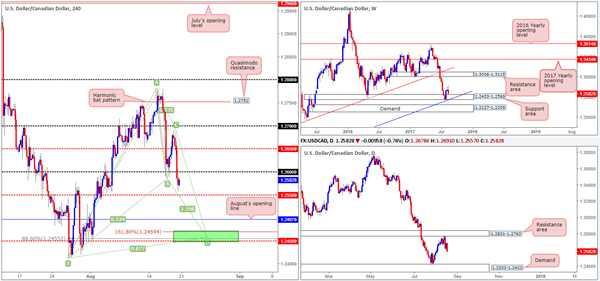
USD/CAD:
Weekly gain/loss: – 95 pips
Weekly closing price: 1.2582
Despite the stronger-than-expected rebound seen from the weekly support area given at 1.2433-1.2569 three weeks ago, weekly sellers came into the fray last week and retested the top edge of this zone.
Technically speaking, the selloff was likely due to the daily resistance area coming in at 1.2831-1.2763. Should the bears continue to dominate from this zone, the next area on the hit list is the demand penciled in at 1.2303-1.2423 (positioned just below the aforementioned weekly support area).
Looking across to the H4 timeframe, nonetheless, we have a beautiful Harmonic bat pattern forming. Not only is the powerful XA retracement (88.6% Fib retracement at 1.2455) located just ahead of the mid-level support 1.2450, it is also positioned within the noted weekly support area and its converging weekly trendline support taken from the low 0.9633.
Suggestions: In the event that the Harmonic pattern completes, we will be interested buyers here. Additional confirmation, in our opinion, is not required since we can comfortably place stops beyond the X point (1.2413). Given the lack of economic data in the market, however, it is doubtful we'll see this area come into view today. So, we'd advise setting an alert at this zone as this will be an area that'll likely come into play later on in the week.
Data points to consider: No high-impacting events scheduled to be released today.
Levels to watch/live orders:
- Buys: 1.2450 (stop loss: 1.2411).
- Sells: Flat (stop loss: N/A).
USD/CHF:
Weekly gain/loss: + 28 pips
Weekly closing price: 0.9646
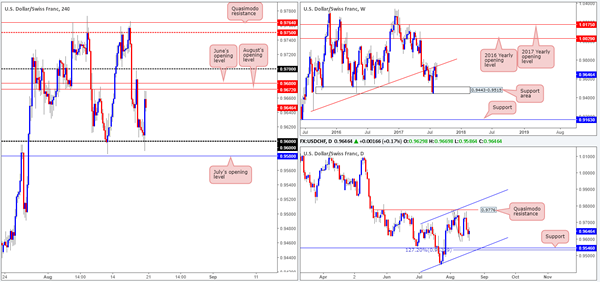
The weekly trendline resistance extended from the low 0.9257 was brought into view over the past few weeks. The bearish selling wick recently printed from this line has, in our opinion, firmly placed the weekly support area at 0.9443-0.9515 back on the hit list.
Also of particular interest is the daily timeframe. The chart shows room for the pair to trade as far down as support coming in at 0.9546, which happens to unite with a channel support etched from the low 0.9438 and a AB=CD 127.2% Fib ext. at 0.9532.
Bouncing over to the H4 timeframe, the 0.96 handle bolstered the market on Friday. This, as you can see, brought price action up to within shouting distance of June and August's opening levels at 0.9680/0.9672. Seeing as how there's space for the market to trade lower on the higher timeframes, the two noted monthly levels could be an area for a potential short trade today. Still, with the 0.97 handle lurking just above here, a fakeout through the two monthly levels could be seen.
Suggestions: Wait for a H4 bearish candle to take shape from 0.9680/0.9672. Ideally the candle should be in the shape of a full, or near-full-bodied candle. This, to us, shows seller intent and is a strong signal that the trade will move in favor.
Data points to consider: No high-impacting events scheduled to be released today.
Levels to watch/live orders:
- Buys: Flat (stop loss: N/A).
- Sells: 0.9680/0.9672 ([waiting for a reasonably sized H4 bearish candle to form – in the shape of either a full, or near-full-bodied candle – is advised] stop loss: ideally beyond the candle's wick).
DOW 30:
Weekly gain/loss: – 171 points
Weekly closing price: 21694
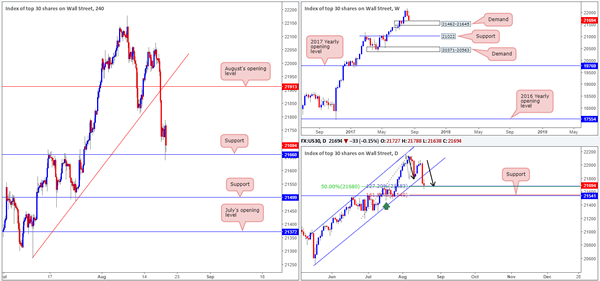
The US equity market sustained further losses for a second straight week, erasing over 170 points. The move forced the index to shake hands with weekly demand seen at 21462-21645. In view of the incredibly strong uptrend this market has been in since, well, forever, we feel the current demand will hold ground this week.
Converging nicely with the top edge of the weekly demand is a daily AB=CD (black arrows) 127.2% Fib ext. point at 21683, and a daily 50% support line at 21680 drawn from the low 21192. Having seen little buyer intent generated from this line, we're eyeing the daily support level seen below it at 21541 for longs, which happens to fuse with a daily AB=CD 161.8% Fib ext. point at 21549.
Levels to watch/live orders:
- Buys: 21541 region (stop loss: beyond the daily low marked with a green arrow at [21462] at 21460).
- Sells: Flat (stop loss: N/A).
European Open Briefing: Asian Equities Markets Opened Mixed On Monday
Global Markets:
- Asian stock markets: Nikkei down 0.39 %, Shanghai Composite rose 0.30 %, Hang Seng climbed 0.52 %, ASX 200 fell 0.64 %
- Commodities: Gold at $1291.03 (-0.04 %), Silver at $16.93 (-0.51 %), WTI Oil at $48.66 (-0.00 %), Brent Oil at $52.70 (-0.04 %)
- Rates: US 10-year yield at 2.19, UK 10-year yield at 1.09, German 10-year yield at 0.41
News & Data:
- USD Prelim UoM Consumer Sentiment 97.6 vs 94.0 expected
- NZD Credit Card Spending y/y 7.2 % vs 8.3 % expected
- JPY All Industries Activity m/m 0.4 % vs 0.5 % expected
- CAD CPI m/m 0.0% vs -0.1 % previous
- CAD Common CPI y/y 1.4 % vs 1.4 % previous
- CAD Median CPI y/y 1.7 % vs 1.6 % previous
- CAD Trimmed CPI y/y 1.3% vs 1.2% previous
- Oil steady as market conditions tighten despite rising U.S. output- RTRS
CFTC Positioning Data:
- EUR long 79K vs 94K long last week. Longs trimmed 15K
- GBP short 32K vs 25K short last week. Shorts increased 7K
- JPY short 77K vs 96K short last week. Shorts trimmed by 19K
- CHF short 1K vs 1K short last week. No change
- CAD long 51K vs 63K long. CAD longs trimmed by 12K
- AUD long 60k vs 58k last week. Longs increased by 2K
- NZD long 25K vs 33K long last week. Longs trimmed by 8K
Markets Update:
Asian equities markets opened mixed on Monday as investors remained unconvinced due to political uncertainties in the U.S and the war drills scheduled for the Korean peninsula.
USD/JPY is little changed this morning, despite the pair ranging 230 pips last week, The Yen is currently seen trading at 109.22 after falling 0.1 percent against the US Dollar, not far from Friday's four-month low of 108.605.
EUR/USD has barely moved in the session so far with a range of just around 10 pips, Notably the Euro continues to be stuck in its rough $1.17-$1.18 range in the past two weeks. The ranging is likely to continue as there are No high-impacting events scheduled to be released today.
AUDUSD was little changed and continued to trade in a small range with not much volatility, The Aussie is currently seen trading at 79.29 U.S. cents after gaining 0.6 percent on Friday.
Upcoming Events:
- 12:00 GMT – (CAD) Wholesale Sales m/m
The Week Ahead:
Tuesday, August 22nd
- 08:30 GMT – (GBP) Public Sector Net Borrowing
- 09:00 GMT – (EUR)German ZEW Economic Sentiment
- 12:30 GMT – (CAD) Core Retail Sales m/m
- 12:30 GMT – (CAD) Retail Sales m/m
Wednesday, August 23rd
- 07:00 GMT – (EUR) ECB President Draghi Speaks
- 07:00 GMT – (EUR) French Flash Manufacturing PMI
- 07:00 GMT – (EUR) French Flash Services PMI
- 07:30 GMT – (EUR) German Flash Manufacturing PMI
- 07:30 GMT – (EUR) German Flash Services PMI
- 08:00 GMT – (EUR) Flash Manufacturing PMI
- 08:00 GMT – (EUR) Flash Services PMI
- 13:05 GMT – (USD) FOMC Member Kaplan Speaks
- 14:00 GMT – (USD) New Home Sales
- 14:30 GMT – (USD) Crude Oil Inventories
Thursday, August 24th
- 08:30 GMT – (GBP) Second Estimate GDP q/q
- 08:30 GMT – (GBP) Prelim Business Investment q/q
- 12:30 GMT – (USD) Unemployment Claims
- 14:00 GMT – (USD) Existing Home Sales
Friday, August 25th
- 08:00 GMT – (EUR) German Ifo Business Climate
- 12:30 GMT – (USD) Core Durable Goods Orders m/m
- 12:30 GMT – (USD) Durable Goods Orders m/m
- 19:00 GMT – (USD) ECB President Draghi Speaks
Aussie Dollar Trading Marginally Lower In The Morning Session
.
For the 24 hours to 23:00 GMT, the AUD rose 0.53% against the USD and closed at 0.7933 on Friday.
LME Copper prices declined 0.1% or $8.0/MT to $6452.0/MT. Aluminium prices rose 0.4% or $8.5/MT to $2104.0/MT.
In the Asian session, at GMT0300, the pair is trading at 0.7931, with the AUD trading a tad lower against the USD from Friday’s close.
The pair is expected to find support at 0.7896, and a fall through could take it to the next support level of 0.7861. The pair is expected to find its first resistance at 0.7955, and a rise through could take it to the next resistance level of 0.7979.
The currency pair is trading above its 20 Hr and 50 Hr moving averages.

Euro-Zone’s Current Account Surplus Declined To Its Lowest Level In Nearly 3 Years In June
For the 24 hours to 23:00 GMT, the EUR rose 0.3% against the USD and closed at 1.1763 on Friday.
On the economic front, the Euro-zone's seasonally adjusted current account surplus narrowed to a level of €21.2 billion in June, hitting its lowest level since August 2014. The region had registered a revised surplus of €30.5 billion in the previous month. Moreover, the region's seasonally adjusted construction output declined 0.5% on a monthly basis in June, easing for the second consecutive month. In the previous month, construction output had registered a revised drop of 0.2%.
Separately, Germany's producer price index rose more-than-expected by 2.3% on an annual basis in July, topping market consensus for a gain of 2.2%, but growing at its slowest pace in seven months. The index had posted an increase of 2.4% in the prior month.
The greenback traded in negative territory against its key peers on Friday, after the removal of the White House chief strategist, Steve Bannon, sparked fresh concerns over the US President, Donald Trump's ability to deliver on its pro-growth agenda.
However, losses in the US Dollar were capped, after the release of an upbeat US economic data.
The flash Reuters/Michigan consumer confidence index in the US jumped more-than-expected to a level of 97.6 in August, surging to a seven-month high as Americans grew optimistic about the nation's economic outlook. The index recorded a reading of 93.4 in the previous month, while market participants were anticipating for an advance to a level of 94.0.
In the Asian session, at GMT0300, the pair is trading at 1.1759, with the EUR trading slightly lower against the USD from Friday's close.
The pair is expected to find support at 1.1729, and a fall through could take it to the next support level of 1.1698. The pair is expected to find its first resistance at 1.1782, and a rise through could take it to the next resistance level of 1.1804.
Moving ahead, investors will look forward to the German Buba monthly report, slated to release in a few hours. Also, the US Chicago Fed national activity index for July, due to release later in the day, will be on investors radar.
The currency pair is trading above its 20 Hr and 50 Hr moving averages.

Pound Trading Flat In The Asian Session
For the 24 hours to 23:00 GMT, the GBP marginally rose against the USD and closed at 1.2877 on Friday.
In the Asian session, at GMT0300, the pair is trading at 1.2877, with the GBP trading flat against the USD from Friday’s close.
Overnight data showed that Britain’s Rightmove house price index fell 0.9% on a monthly basis in August. In the previous month, the index had registered a rise of 0.1%.
The pair is expected to find support at 1.2834, and a fall through could take it to the next support level of 1.2790. The pair is expected to find its first resistance at 1.2919, and a rise through could take it to the next resistance level of 1.2960.
The currency pair is showing convergence with its 20 Hr and 50 Hr moving averages.

Japan’s All Industry Activity Index Rebounded In June
For the 24 hours to 23:00 GMT, the USD declined 0.28% against the JPY and closed at 109.18 on Friday.
The Japanese Yen gained ground against the USD on Friday, amid increased risk aversion among investors as the Trump administration continues to lurch from one crisis to another.
In the Asian session, at GMT0300, the pair is trading at 109.21, with the USD trading marginally higher against the JPY from Friday's close.
Earlier in the session, data indicated that Japan's all industry activity index rebounded 0.4% on a monthly basis in June, meeting market expectations. The index had registered a revised drop of 0.8% in the prior month.
The pair is expected to find support at 108.67, and a fall through could take it to the next support level of 108.14. The pair is expected to find its first resistance at 109.67, and a rise through could take it to the next resistance level of 110.14.
The currency pair is showing convergence with its 20 Hr moving average and trading below its 50 Hr moving average.

Swiss Franc Trading Slightly Higher This Morning
For the 24 hours to 23:00 GMT, the USD rose 0.27% against the CHF and closed at 0.9654 on Friday.
In the Asian session, at GMT0300, the pair is trading at 0.9653, with the USD trading marginally lower against the CHF from Friday’s close.
The pair is expected to find support at 0.9603, and a fall through could take it to the next support level of 0.9552. The pair is expected to find its first resistance at 0.9687, and a rise through could take it to the next resistance level of 0.9720.
The currency pair is trading above its 20 Hr and 50 Hr moving averages.
