Sample Category Title
Loonie Recovers As Canada’s Inflation Rebounds
The Canadian dollar jumped on Friday, after data showed that the nation's headline CPI rate rebounded, as was widely anticipated. Meanwhile, the core rate remained unchanged at +0.9% yoy, also in line with expectations. Despite underlying inflationary pressures remaining subdued, the rise in the headline rate is in line the BoC's view that inflation is likely to rebound moving forward and the heightened market expectations for another rate hike this year. At the time of writing, the probability for another BoC rate increase this year is 90%, according to Canada's Overnight Index Swaps (OIS).
Overall, we think that the Loonie's outlook remains positive amid the aforementioned speculation for another hike, solid economic data, and the prospect for further rebound in oil prices (see below). Our favorite proxy for further CAD gains is still USD/CAD, given the weakness in the greenback, which has remained on the back foot lately amid subdued expectations for another Fed hike this year and renewed political uncertainty in Washington D.C. The key risk to our view may be any comments from BoC officials expressing discomfort with the currency's latest gains.
USD/CAD traded lower on Friday following the rebound in Canada's inflation rate. The pair slid after it hit resistance slightly below the 1.2700 (R1) line to stop near the 1.2555 (S1) support. In our view, the short-term bias is back to the downside and as such, if the bears prove strong enough to break the 1.2555 (S1) zone, we would expect them to aim for the next support territory of 1.2415 (S2) marked by the lows of the 26th , the 27th and the 31st of July.
As for the bigger picture, the rate continues to trade below the downtrend line taken from the peak of the 11th of May, and well below the psychological zone of 1.3000, which acted as the lower bound of the sideways range that contained the price action from the 9th of September 2016 until the 30th of June 2017. Therefore, the bigger picture is negative as well, which enhances the case for the pair to continue trading south for a while.
Oil prices jump on the prospect of supply disruptions
Oil prices surged on Friday, a few minutes ahead of the weekly Baker-Hughes data, which showed a decline in active oil rigs in the US. The early spike in the precious liquid may have been owed primarily to political developments in Venezuela. The renewed political turmoil in the country probably led to speculation that the US may intensify its economic sanctions, something that could remove a significant portion of Venezuelan oil production from the market. Moving forward, we think that the short-term outlook for oil has turned positive. Besides the decline in US oil rigs and the prospect of fewer exports from Venezuela, Libya's largest oilfield was shut down during the weekend, which is likely to weigh further on supply in the short-term.
WTI surged on Friday, breaking above the resistance (now turned into support) barrier of 48.10 (S1). The rebound came after the price found support at the upper bound of the downside channel WTI was trading within from the beginning of February until the 25th of July. Thus, we see the likelihood for further advances and a test at 49.30 (R1) soon. A decisive break above that level is possible to see scope for more bullish extensions, perhaps towards the well-tested barrier of 50.35 (R2). Having said that though, we don't expect any further gains to lead into a major healthy uptrend. We still believe that the range between 51.50 (R3) and 55.00 is the area where US shale producers may be attracted to increase production, something that may put a lid on any possible future gains.
Today's highlights:
The economic calendar is empty today, with no major events, indicators, or speakers on the agenda.
As for the rest of the week:
On Tuesday, Germany will release its ZEW survey for August, while on Wednesday, Eurozone's preliminary manufacturing and services PMIs for August will be in focus. On Thursday, in the US, the annual Jackson Hole economic symposium will commence, and will conclude on Saturday. As for the economic data, we get GDP prints for Q2 from both the UK (2nd estimate) and Norway. Finally on Friday, all eyes will be turned to speeches by both Fed Chair Yellen and ECB President Draghi, at the Jackson Hole. We expect market participants to tune in for any updated signals on policy from two of the world's top policymakers. As for the data, Japan's CPIs for July, Germany's Ifo survey for August, and US durable goods orders for July, are all coming out.
USD/CAD
Support: 1.2555 (S1), 1.2415 (S2), 1.2300 (S3)
Resistance: 1.2700 (R1), 1.2775 (R2), 1.2680 (R3)
WTI
Support: 48.10 (S1), 46.85 (S2), 45.500.7710 (S3)
Resistance: 49.30 (R1), 50.35 (R2), 51.50 (R3)
Gold Neutral After Rejection At Strong 1300 Resistance
Gold has been in an uptrend since the July 10 low of 1204.79, with the market making higher highs and higher lows. After reaching the key psychological level at 1300.00, upside momentum faded. Following a spike to a nine-month high of 1300.77 on August 18, prices fell back as RSI reached overbought levels at 70.
Looking at the 4-hour chart, the market is expected to consolidate above 1280.00 in the near term. The short- term outlook should remain bullish as long as this key support level holds. A break of this level would favour a move to the downside. Gold prices would extend lower towards the mid-August low of 1267.25. This is a key level since it is near the 50% Fibonacci retracement level of the rise from 1204.79 to 1300.77. A deeper fall from here would weaken the short term bullish picture and could open the way for a re-test of the 1204.79 low.
Alternatively, sustained trading above the 50-period moving average would help keep focus to the upside. A successful break of the key 1300.00 level and August 18 peak would bring a resumption in the uptrend with scope to target the next major high of 1337.24.
If there is another rejection at key resistance in the 1300.00 area, the most likely scenario would be a consolidation phase in the near-term, with 1280.00 support keeping the uptrend intact. The rising and positively-aligned moving averages (20 and 50-period SMA) highlight a bullish market structure. In the bigger picture, gold has been neutral since April (on the daily chart).
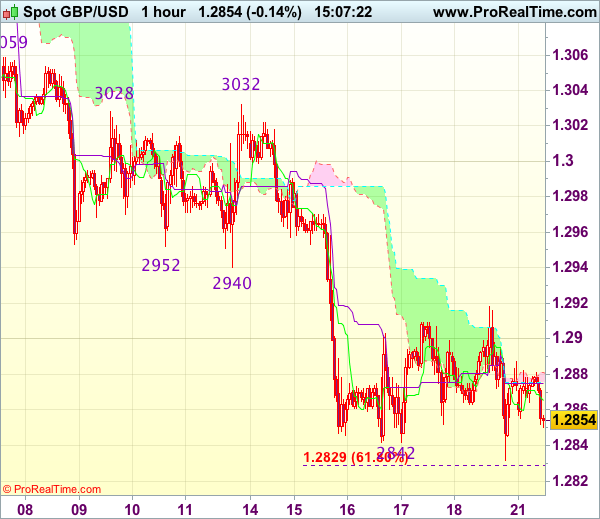
Trade Idea : GBP/USD – Sell at 1.2935
GBP/USD - 1.2860
Most recent candlesticks pattern : N/A
Trend : Near term down
Tenkan-Sen level : 1.2866
Kijun-Sen level : 1.2875
Ichimoku cloud top : 1.2881
Ichimoku cloud bottom : 1.2876
Original strategy :
Sell at 1.2935, Target: 1.2835, Stop: 1.2970
Position : -
Target : -
Stop : -
New strategy :
Sell at 1.2935, Target: 1.2835, Stop: 1.2970
Position : -
Target : -
Stop : -
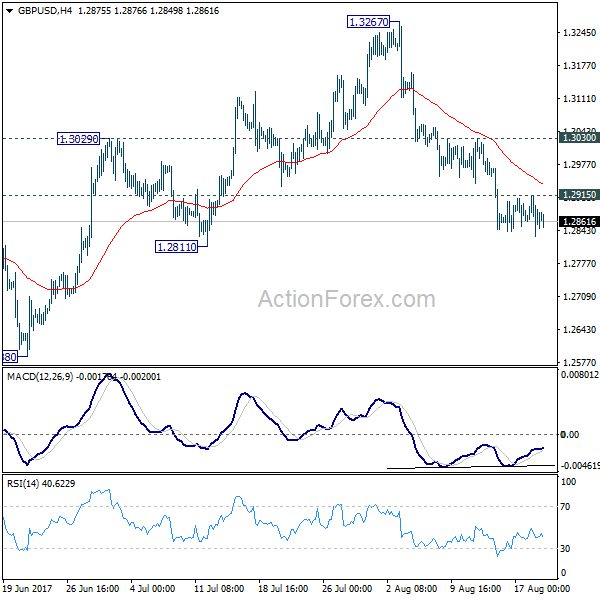
Although cable fell briefly to 1.2832, lack of follow through selling suggests consolidation would be seen and another corrective bounce to 1.2900 and possibly 1.2920 cannot be ruled out, however, reckon previous support at 1.2933-40 would turn into resistance and limit upside, bring another decline later, below said support at 1.2832 would extend recent selloff to 1.2800, having said that, oversold condition should limit downside to 1.2770 and reckon 1.2750 would hold from here, bring rebound later.
In view of this, would not chase this fall here and would be prudent to sell sterling on recovery as said previous support at 1.2933 should cap cable’s upside, bring another decline. Above 1.2950 would defer and risk a stronger rebound to 1.2990-00 before another decline.
More Trump Dismissals, War Games Begin And All Eyes (And Ears) On Jackson Hole
Markets are weary following the latest 'dismissals' within President Trumps Administration. On Friday, Trump fired his controversial policy strategist, Steve Bannon, this was then followed by the resignation of his special advisor on regulation, Carl Icahn. Icahn reportedly left the administration ahead of a critical magazine article detailing his alleged conflicts of interests and questioning whether he had acted illegally. Once again, concerns rise that the markets have little to no faith in Trumps Administration and his ability to deliver on his economic policies.
Along with political concerns, the markets are also worried of North Korea-US tensions rising as US Troops and South Korean forces conducted a joint military exercise on Monday that are scheduled to last until August 31st. We can expect further rhetoric between Trump and Pyongyang.
With a relatively 'light' week of economic data releases, the markets will be looking to Federal Reserve Chair Yellen and ECB President Mario Draghi, two of several Central Bankers, addressing the annual summit hosted by the Kansas City Fed at the Jackson Hole mountain retreat. We can expect important information from the summit, with the likely focus being on Global Economic Growth, Inflation and overall economic policy.
EURUSD is little changed from Friday’s close, currently trading around 1.1740.
USDJPY lost 0.3% overnight to currently trade around 109.00.
GBPUSD is trading just above Monday’s lows (1.28499), to currently trade around 1.2859.
Gold is up 0.35% on the day to currently trade at $1,288.
WTI remains 'soft', as over supply is keeping prices down, with a -0.65 fall in early trade on Monday. WTI is currently trading around $48.56pb.
At 09:30 BST, UK National Statistics will release Public Sector Net Borrowing for July. The previous release of £6.278B was distorted due to an amended EU budget contribution in June, but markets are not expecting anything but further increases as the UK economy is, regarded by many, faltering as the Bexit process moves forward.
At 13:30 BST, the Federal Reserve Bank of Chicago will release the Chicago Fed National Activity Index for July. The previous, expansionary, reading of +0.13 in June had the markets looking positively towards the growth of the US economy. The markets will be looking at this release to see if the expansionary trend is continuing.
EUR/USD Daily Outlook
Daily Pivots: (S1) 1.1719; (P) 1.1746 (R1) 1.1786; More...
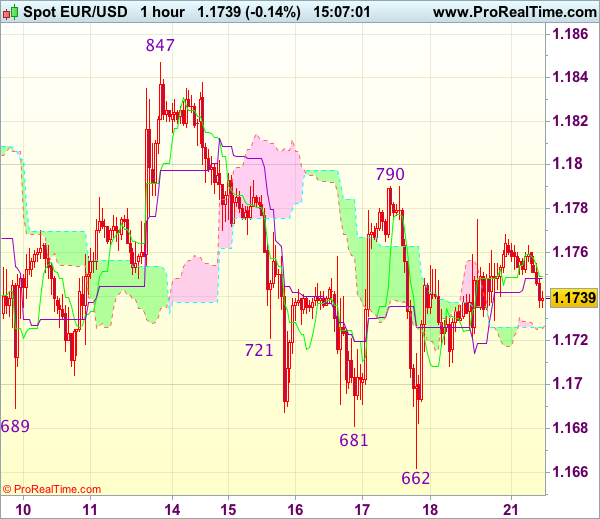
Intraday bias in EUR/USD remains neutral as the correction from 1.1908 continues. Deeper fall could be seen but downside should be contained by 38.2% retracement of 1.1119 to 1.1908 at 1.1606 to bring up trend resumption. Break f 1.1846 minor resistance will argue larger rise from 1.0339 is resuming for 1.2042 long term support turned resistance next.
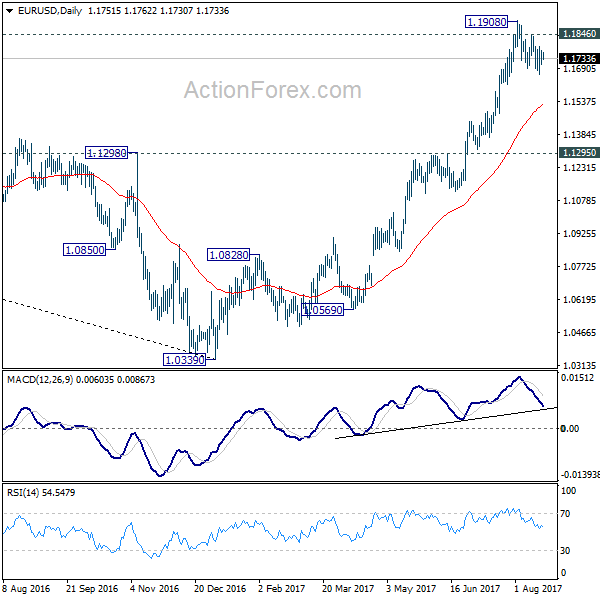
In the bigger picture, an important bottom was formed at 1.0339 on bullish convergence condition in weekly MACD. Sustained trading above 55 month EMA (now at 1.1768) will pave the way to key fibonacci level at 38.2% retracement of 1.6039 (2008 high) to 1.0339 (2017 low) at 1.2516. While rise from 1.0339 is strong, there is no confirmation that it's developing into a long term up trend yet. Hence, we'll be cautious on strong resistance from 1.2516 to limit upside. But for now, medium term outlook will remain bullish as long as 1.1295 support holds, in case of pull back.
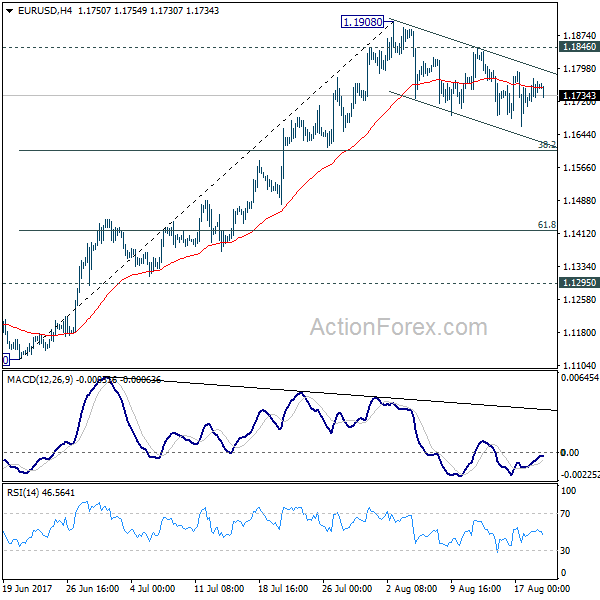
Technical Outlook: EURUSD Is Trading Within Five-Day Congestion In Early Monday, Eyes Jackson Hole Symposium
The Euro moved lower in late Asian / early European hours, trading around the mid-point of 1.1662/1.1790 range, where the price was entrenched for the most of the last week’s trading.
Daily studies show mixed signals, with 10/20SMA bear-cross (1.1765) weighing on near-term action, while the downside is supported by rising 30SMA (currently at 1.1685).
Break of either hurdle is needed for initial direction signal.
Markets are eyeing key event this week, Fed’s annual central banking conference in Jackson Hole, which starts on Thursday.
ECB chief Draghi is due to speak on Thursday and Fed Chair Yellen on Friday and traders will be looking for fresh signals from their speeches.
However, Yellen would likely not provide any new guidance in policy after last week’s FOMC minutes showed strong concerns about stubbornly low inflation.
Expectation s that Draghi is going to provide more information about ECB’s stimulus tapering are also low.
Traders are positioning ahead of Jackson Hole symposium and further reducing of long positions ahead of event is seen as likely scenario.
Violation of 30SMA and last week’s congestion lows at 1.1680/60 zone could trigger further easing towards next support at 1.1607 (Fibo 38.2% of 1.1118/1.1910 rally)
With no economic indicators from the Eurozone on Monday, trading should stay in a quiet mode.
Res: 1.1754, 1.1774, 1.1790, 1.1846
Sup: 1.1723, 1.1708, 1.1685, 1.1662
Trade Idea : EUR/USD – Hold long entered at 1.1715
EUR/USD - 1.1740
Most recent candlesticks pattern : N/A
Trend : Sideways
Tenkan-Sen level : 1.1747
Kijun-Sen level : 1.1748
Ichimoku cloud top : 1.1726
Ichimoku cloud bottom : 1.1725
Original strategy :
Bought at 1.1715, Target: 1.1815, Stop: 1.1705
Position : - Long at 1.1715
Target : - 1.1815
Stop : - 1.1705
New strategy :
Hold long entered at 1.1715, Target: 1.1815, Stop: 1.1705
Position : - Long at 1.1715
Target : - 1.1815
Stop : - 1.1705
As the single currency found good support at 1.1662 last week and staged a rebound from there, suggesting a temporary low is possibly formed there and consolidation with mild upside bias remains for another test of indicated resistance at 1.1790, however, break there is needed to add credence to this view, bring further gain to 1.1820 but resistance at 1.1847 should hold from here.
In view of this, we are holding on to our long position entered at 1.1715. Below 1.1680-85 would risk retest of 1.1662, break there would extend the erratic decline from 1.1910 top to 1.1640-50 (50% Fibonacci retracement of 1.1370-1.1910 and previous support) but reckon 1.1600 would hold from here.
GBP/USD Daily Outlook
Daily Pivots: (S1) 1.2830; (P) 1.2873; (R1) 1.2916; More...
Intraday bias in GBP/USD remains on the downside with 1.2915 minor resistance intact. Current fall from 1.3267 should target 1.2588 key near term support. We're favoring the case that correction from 1.1946 is completed at 1.3267. Decisive break of 1.2588 will confirm our view and target a test on 1.1946 low. On the upside, above 1.2915 minor resistance will turn intraday bias neutral first. But near term outlook will remains cautiously bearish as long as 1.3030 resistance holds.
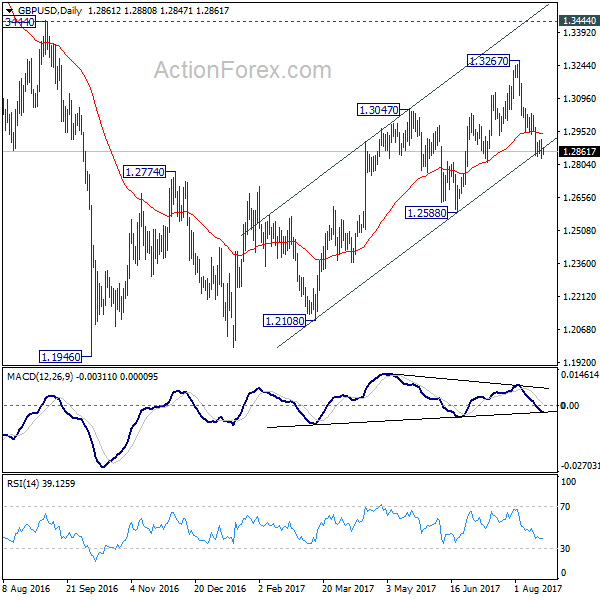
In the bigger picture, overall, price actions from 1.1946 medium term low are seen as a corrective pattern. While further rise cannot be ruled out, larger outlook remains bearish as long as 1.3444 key resistance holds. Down trend from 1.7190 (2014 high) is expected to resume later after the correction completes. And break of 1.2588 will indicate that such down trend is resuming.
Trade Idea : USD/JPY – Stand aside
USD/JPY - 109.02
Most recent candlesticks pattern : N/A
Trend : Near term down
Tenkan-Sen level : 109.21
Kijun-Sen level : 109.10
Ichimoku cloud top : 110.05
Ichimoku cloud bottom : 109.55
New strategy :
Stand aside
Position : -
Target : -
Stop : -
Despite falling briefly to 108.60, lack of follow through selling on break of 108.73 support and the subsequent rebound suggest consolidation above 108.60 would take place and test of 109.60-67 resistance cannot be ruled out, however, break there is needed to signal low is formed, bring further gain to 110.00 and possibly towards 110.37 resistance but price should falter well below last week’s high at 110.95.
On the downside, below said support at 108.60 would signal recent decline is still in progress and may extend further weakness to 108.40, then towards 108.20-25, however, near term oversold condition should prevent sharp fall below latter level and reckon 108.00 would hold from here, bring rebound later. As near term outlook is mixed, would be prudent to stand aside in the meantime.

USD/CHF Daily Outlook
Daily Pivots: (S1) 0.9600; (P) 0.9634; (R1) 0.9683; More...
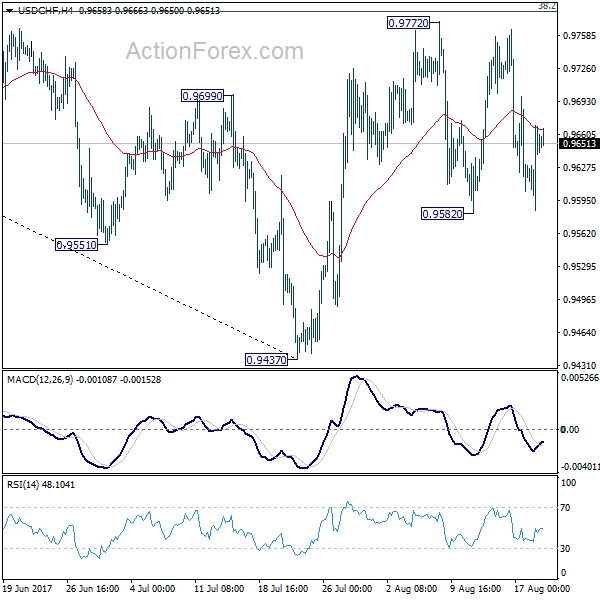
Intraday bias in USD/CHF remains neutral for the moment. On the upside, decisive break of 0.9772 resistance will revive the bullish case of reversal. That is, whole decline from 1.0342 has completed at 0.9437 after defending 0.9443 support. USD/CHF should then target channel resistance (now at 0.9862) next. Meanwhile, the pair is bounded inside medium term falling channel and limited below 38.2% retracement of 1.0342 to 0.9437 at 0.9783 for the moment. Break of 0.9582 will turn bias back to the downside for 0.9437. This could also extend the fall from 1.0342 through 0.9437/43 key support level.
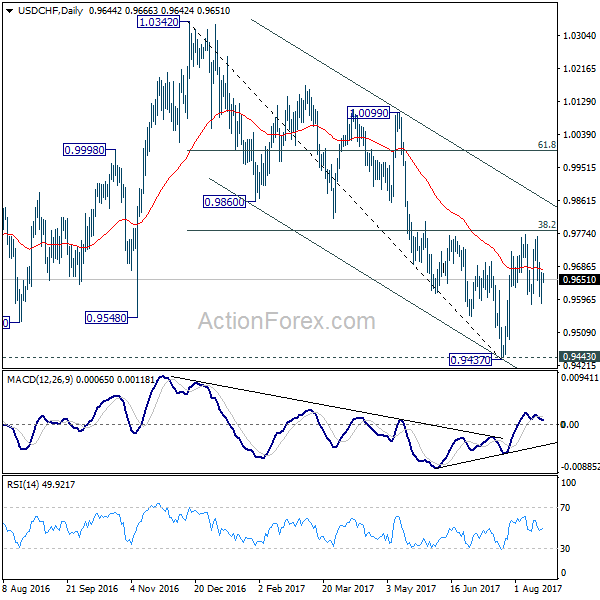
In the bigger picture, we're slightly favoring the case that USD/CHF has successfully defended 0.9443 key support level. And long term range trading in 0.9443/1.0342 is extending with another rise. At this point, there is no sign of an up trend yet. Hence, while further rise is expected in USD/CHF, we'll start to be cautious on loss of momentum above 61.8% retracement of 1.0342 to 0.9437 at 0.9996. However, firm break of 0.9443 will carry larger bearish implication and would target next key support at 0.9072.