Sample Category Title
Technical Outlook: USDJPY – Bears Look For Renewed Attempt Below Key Supports At 108.83/72
The pair maintains bearish tone in early Monday's trading and looking for retest of key supports at 108.73/72 (weekly cloud top / 11 Aug low) after last Friday's attack failed after price dipped to 108.60 but closed well above after quick recovery and left long-tailed daily candle.
Bearish studies are supportive for further downside and firm break below 108.83/72 would trigger extension of bear-leg from 110.94 (16 Aug high) and open another key support at 108.11 (14 Apr low).
Falling hourly cloud weighs on near-term action with cloud base at 109.44 (also session high) marking solid resistance, ahead of daily Tenkan-sen at 109.77, which should cap extended upside attempts.
Res: 109.44, 109.60, 109.77, 109.95
Sup: 108.83, 108.72, 108.11, 107.88
XAUUSD Analysis: Slips To 1,286.08
After reaching the northern boundary of a one week long ascending channel the yellow metal made a rebound and started to decline against the American Dollar until the pair found a support set up by the 100-hour SMA.
At the moment, the pair is fluctuating around the updated weekly PP near 1,284.70, simultaneously being squeezed between the 55-hour SMA from the top and the above 100-hour SMA from the bottom.
Today the bullion is expected to resume the surge. Firstly, because it is continues to move in two ascending channels. Secondly, because the southern path is also secured by the 200-hour SMA and the 61.8 Fibonacci retracement level at 1,278.96.
USDJPY Analysis: Rebounds From Monthly S1
As it was expected, the currency exchange rate reached and bounced off from the monthly S1 located at the 108.82 level. In result of this action, the junior short-term channel has been broken.
Unfortunately for the buck, the further surge did not follow and it is not expected to resume today as well, as the road upstairs is obstructed by multiple barriers, such as the 55-, 100- and 200-hour SMAs as well as the updated weekly PP at 109.59.
Thus, the pair is expected to try to break through the above monthly S1 one more time and, thus, finally reach the bottom line of a larger scale descending channel.
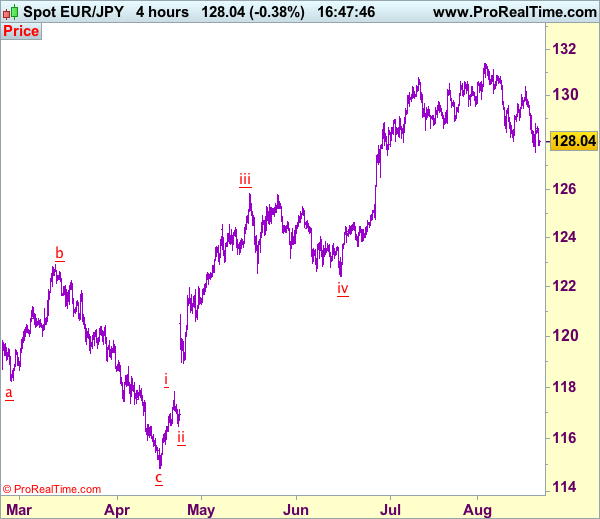
Trade Idea: EUR/JPY – Stand aside
EUR/JPY - 128.03
Recent wave: A 5-waver is unfolding from 114.85 with wave iii and iv ended at 125.82 and 122.40 respectively, wave v has possibly ended at 131.40.
Trend: Near term up
New strategy :
Stand aside
Position: -
Target: -
Stop:-
Despite falling to 127.56 on Friday, the subsequent rebound to 128.79 suggests consolidation above this level would be seen and as long as this support holds, another bounce to 128.79 cannot be ruled out, however, break of 129.10-15 is needed signal low is possibly formed, bring a stronger rebound to 129.50-60 and possibly towards 130.00. Looking ahead, only break of indicated resistance at 130.40 would revive bullishness and signal the fall from 131.40 has ended, then gain to 130.90-00 would follow.
On the downside, below said last week’s low at 127.56 would extend the corrective decline from 131.40 top for retracement of recent upmove to 127.00-10, however, near term oversold condition would limit downside to 126.50-60, risk from there is for a rebound to take place later. As near term outlook is mixed, would be prudent to stand aside for now.
Our latest preferred count is that wave (ii) is ABC-X-ABC which ended at 123.33 and wave (iii) is unfolding with wave iii ended at 100.77, followed by wave iv at 111.57 and wave v as well as the wave (iii) has ended at 97.04, followed by wave (iv) at 111.43 and wave (v) has ended at 94.12 which is also the end of the larger degree v, this also implied the major wave (C) has also ended there, hence major correction has commenced from there with (A) leg unfolding in its lower degree wave c which has possibly ended at 145.69. Under this count, A-B-C wave (B) has commenced with A leg ended at 136.23, wave B at 143.79 and wave C has possibly ended at 149.79.
Our larger degree count is that the decline from 139.26 is wave (C) and is sub-divided into a diagonal triangle i-ii-iii-iv-v with wave i - 105.44, wave ii- 123.33, wave iii - 97.03, wave iv - 111.43, followed by the final wave v as well as the end of wave (C) at 94.12, this also mark the bottom of larger degree wave B. Under this count, major rise in wave C has commenced as an impulsive wave with minor wave III ended at 145.69, wave V is still in progress for further gain to 150.00. Having said that, this so-called wave V could well be the first leg of larger degree 5-waver wave C and this wave C should bring at least a retest of wave A top at 169.97 (July 2008).
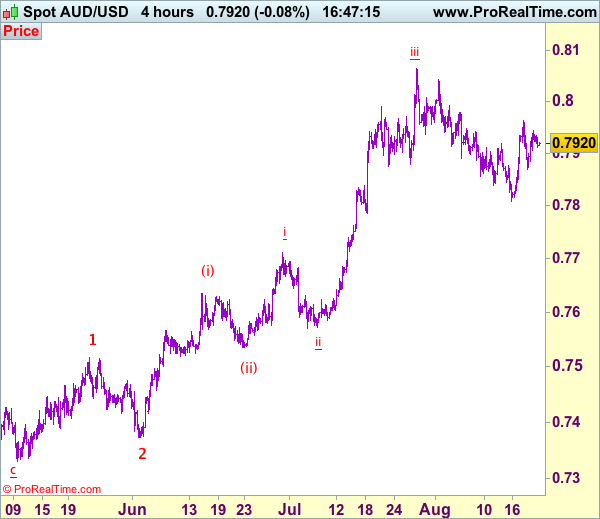
Trade Idea: AUD/USD – Hold long entered at 0.7895
AUD/USD – 0.7919
Recent wave: Wave 5 ended at 1.1081 and major correction has commenced for fall to 0.7000 and then towards 0.6500-10
Trend: Near term up
Original strategy :
Bought at 0.7895, Target: 0.8050, Stop: 0.7865
Position: - Long at 0.7895
Target: - 0.8050
Stop: - 0.7865
New strategy :
Hold long entered at 0.7895, Target: 0.8050, Stop: 0.7865
Position: - Long at 0.7895
Target: - 0.8050
Stop:- 0.7835
Aussie found support at 0.7869 late last week and has rebounded, retaining our bullishness and consolidation with upside bias remains for another test of indicated resistance at 0.7963, break there would add credence to our view that low has possibly been formed at 0.7808 early last week, bring a stronger rebound to 0.8000, however, break there is needed to signal the pullback from 0.8066 top (wave iii peak) has ended at 0.7808 (wave iv) and bring eventual retest of this level.
In view of this, we are holding on to our long position entered at 0.7895. Below said support at 0.7869 would dampen this bullish scenario and suggest the rebound from 0.9808 has ended, bring another test of this level, below there would signal the wave iv correction from 0.8066 is still in progress for weakness to 0.7786 support, however, oversold condition should prevent sharp fall below 0.7750 and price should stay above i top at 0.7712, bring rebound later. We are keeping our latest bullish count that recent impulsive waves is unfolding as (1 2, (i)(ii), i ii) and may extend headway towards 0.8150.
On the 4-hour chart, the move from 0.8066 is the wave 5 with i: 0.8860, ii: 0.8315, wave iii is an extended move ended at 1.0183, iv: 0.9706 and wave v has ended at 1.1081 (also the top of entire wave 5). The subsequent selloff is the major correction which is unfolding as ABC-X-ABC and 2nd A leg has ended at 0.8848, followed by a-b-c wave B which ended at 0.9758, hence, 2nd C wave is now in progress and indicated downside target at 0.7000 and 0.6950 had been met, so further fall to 0.6710-20 cannot be ruled out.
GBP/USD Analysis: Begins A Week Near 1.2881
The British Pound is continuing to lose value against the US Dollar in a four day long descending triangle pattern. The figure formed in result of traders' reaction on announcement of the UK CPI last Tuesday.
Most probably, the Sterling is going to fail to break to the top, as the northern path is secured by a combination of the 55- and 100-hour SMAs plus the updated weekly PP, which is located slightly above the pattern at 1.2910.
This assumption seems valid not only from the trade pattern theory, but is also supported by a summary of multiple technical indicators, which send strong sell signals for the 5H and 1D timeframes.
EUR/USD Analysis: Stuck Around 1.1750
In line with expectations, the EUR continued to advance against the USD until the pair has encountered a combined resistance level set up by the updated weekly PP and the 200-hour SMA. As a result, the currency rate has stuck near the 1.1750 level. Nevertheless, the surge is expected to continue, as the pair has no barriers on its way up until the weekly R1 at 1.1846, while from the bottom it experiences certain pressure from the 55- and 100-hour SMAs.
In the meantime, it should be noted that an area near the 1.1810 mark represents a location of the medium-term descending channel's upper boundary, which most likely is going to turn around the exchange rate.
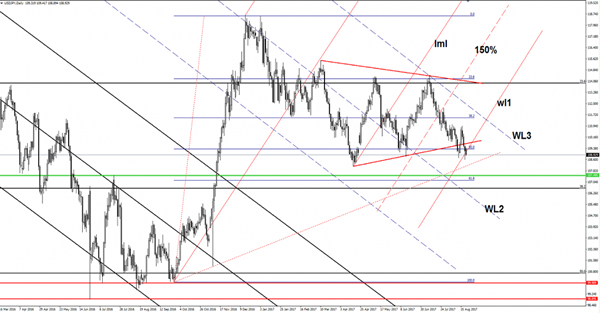
USD/JPY Is This A Valid Breakdown?
USD/JPY is trading in the red right now and looks determined to take out the dynamic support from the first warning line (wl1) of the ascending pitchfork. The breakdown will attract more sellers on the short term, which will lead the rate towards the 61.8% and lower towards the 38.2% retracement levels.
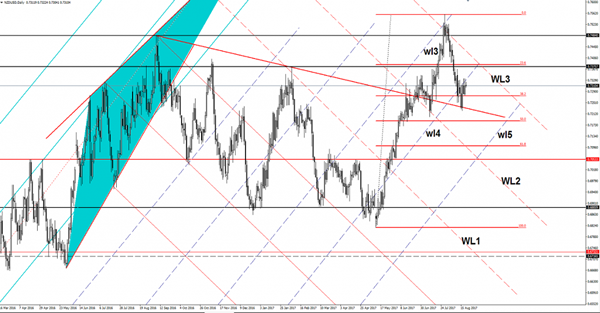
NZD/USD Downside Still In Cards
Price could drop again in the upcoming period after the retest of the fourth warning line (wl4). The USD will take the lead again if the USDX will breakout above the 93.81 static resistance. I’ve said in the previous article that we may have a further drop if will retest the warning line (wl4).
Only a valid breakdown below the 38.2% retracement level will confirm broader corrective phase, the next major downside target will be at the fifth warning line (wl5). We may have a Head and Shoulders pattern if the rate will close below the 0.7222 previous low.
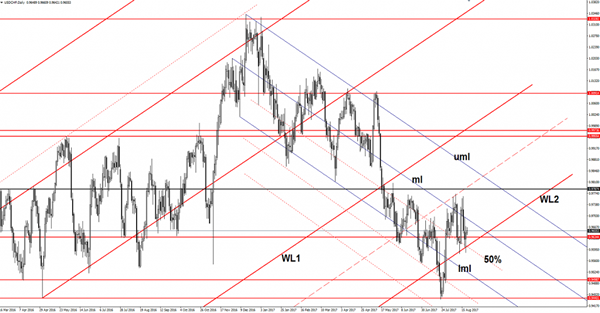
USD/CHF Inverse Head and Shoulders?
The USD/CHF increased and is trying to recover after the last downside movement.Is trading in the green and looks determined to resume the Friday’s bullish candle. Price was rejected by a strong dynamic support and now is approaching an important dynamic resistance.
However, we may still need a confirmation that will increase further in the upcoming period. USD/CHF increased as the USDX is trading in the green after the Friday’s drop. The dollar index stays right below a dynamic resistance and below the 93.81 static resistance, only a valid breakout above these levels will confirm a large rebound.
We have a poor economic calendar today, so the rate is will be driven by the technical factors. Technically the USDX is somehow expected to increase further in the upcoming period because the behavior has changed (higher lows).
You can see that has found strong support above the second warning line (WL2) of the major ascending pitchfork and now could approach the median line (ml) of the minor descending pitchfork. A valid breakout above the median line (ml) will confirm a further increase in the upcoming period. The failure to close on the warning line (WL2) has signaled a bullish pressure, but the rate could still retest this level before will increase further. Looks like that the rate is developing an Inverse Head and Shoulders pattern, but is far from being confirmed.