Sample Category Title
USD/CHF Sideways Price Action
USD/CHF is pushing lower. Resistance is given at 0.9771 (15/06/2017 high). Hourly support lies at at 0.9584 (08/11/2017 low). Expected to to push even lower.
In the long-term, the pair is still trading in range since 2011 despite some turmoil when the SNB unpegged the CHF. Key support can be found 0.8986 (30/01/2015 low). The technical structure favours nonetheless a long term bullish bias since the unpeg in January 2015.
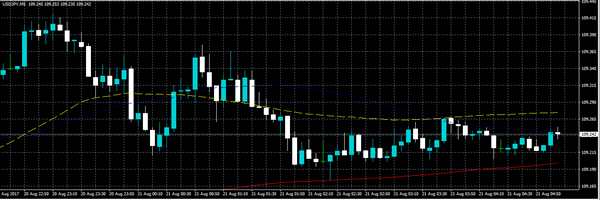
USD/JPY Continued Bearish Pressures
USD/JPY's bearish pressures are back towards former support at 108.83 (17/04/2017 low). Expected to show another leg lower.
We favor a long-term bearish bias. Support is now given at 96.57 (10/08/2013 low). A gradual rise towards the major resistance at 135.15 (01/02/2002 high) seems absolutely unlikely. Expected to decline further support at 93.79 (13/06/2013 low).
GBP/USD Monitoring Strong Support
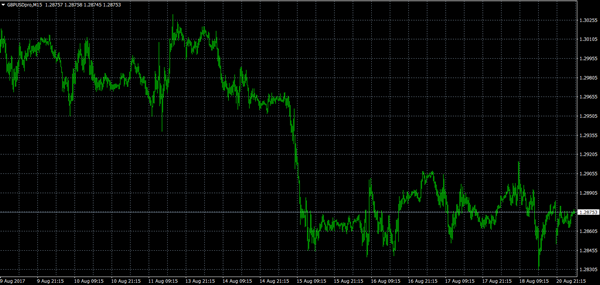
GBP/USD is edging higher. Hourly resistance is given at 1.3267 (03/08/2017 high). Hourly support can be found at 1.2812 (12/07/2017 low). Expected to show continued bearish pressures.
The long-term technical pattern is even more negative since the Brexit vote has paved the way for further decline. Long-term support given at 1.0520 (01/03/85) represents a decent target. Long-term resistance is given at 1.5018 (24/06/2015) and would indicate a long-term reversal in the negative trend. Yet, it is very unlikely at the moment.
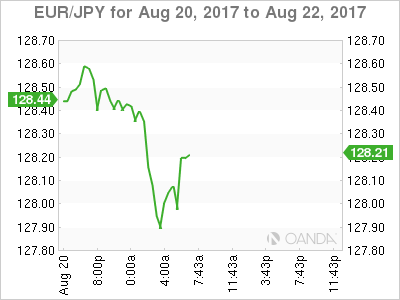
EUR/USD Riding Short-Term Downtrend Channel
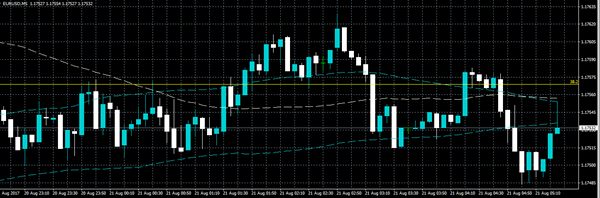
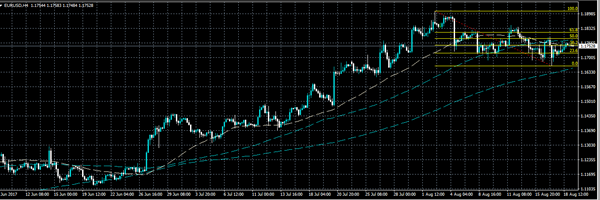
EUR/USD bearish pressures are on. Hourly resistance can be found at 1.1910 (02/08/2017 high) while hourly support given at 1.1689 (09/08/2017 high) has been broken. Stronger support lies at 1.1613 (26/07/2017 low). Expected to show further short-term selling pressures.
In the longer term, the momentum is now turning largely positive. We favour a continued bullish bias. Key resistance holding at 1.1871 (24/08/2015 high) has been broken while strong support lies at 1.0341 (03/01/2017 low).
Jackson Hole Symposium: Will Draghi And Yellen Disappoint?
Monday August 21: Five things the markets are talking about
This week, top central bankers including the Fed's Yellen and ECB President Draghi will gather for the Jackson Hole economic symposium.
Central bankers gather Thursday through Saturday in Wyoming and the markets focus will be on Yellen's speech Friday morning on financial stability, while Draghi will speak Friday afternoon.
Note: The symposium has become a staging ground for policy makers to expand and explain complicated new policies.
Will Draghi provide some clarity on ending Euro QE? ECB watchers think his upcoming appearance will give him an opportunity to set out the case for bringing it to an end in 2018.
In Europe, the eurozone economy had a surprisingly strong H1, and many expect to see indications over the coming week that growth is continuing at only a slightly slower pace during Q3. Key data this week will be the flash composite PMI's (Wednesday). The U.K and Germany (Thursday and Friday) will post revised estimates of Q2 GDP. Also in Germany, both the ZEW (Tuesday 5 am EDT) and Ifo survey (Friday 4 am EDT) results for August will be published.
Stateside, on Thursday (10:00 am EDT) the NAR releases July existing-home sales report which will offer insight into whether the tight supply of homes and rising prices are deterring prospective homebuyers. On Friday (08:30 am EDT), July's durable goods report will show how investment expenditure is shaping up.
1. Stocks extend their declines
Equities extended declines overnight amid growing unease about persistent low inflation.
In Japan, stocks fell to a fresh 3-1/2-month low Monday, as investors remained cautious amid worries over whether the Trump administration will be able to implement growth-boosting measures. The Nikkei ended down -0.4% while the broader Topix index fell -0.1% with volumes about -16% below the 30-day intraday average.
In Hong Kong, shares finished higher on Monday, supported by strong performance in energy and telecoms firms. The Hang Seng index ended up +0.4%, while the China Enterprises Index gained +0.5%. In China, the CSI300 index rose +0.3%, while the Shanghai Composite Index gained +0.2%.
In South Korea, the Kospi index lost -0.1%, while down-under Australia's S&P/ASX 200 Index dropped -0.4%.
In Europe, indices trade lower across the board with the exception of the Swiss SMI as the global Geo-Political tensions weigh on a light day for corporate and macro data.
U.S stocks are set to open in the red (-0.2%).
Indices: Stoxx600 -0.2% at 373.4, FTSE -0.5% at 7308, DAX %-0.4 at 12114X, CAC-40 -0.5% at 5088, IBEX-35 -0.1% at 10373, FTSE MIB -0.3% at 21751, SMI +0.3% at 8898, S&P 500 Futures -0.2%
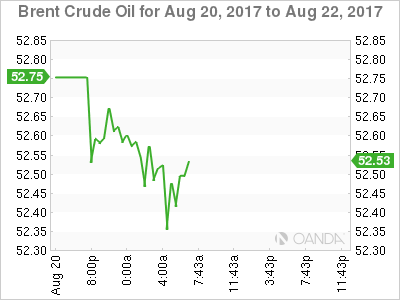
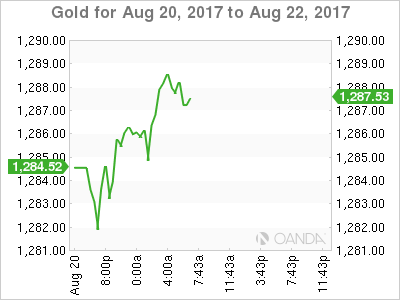
2. Oil dips on rising U.S output, gold steady
Ahead of the U.S open, oil prices have dipped, weighed down by rising U.S output.
Note: A -13% decline in U.S crude inventories since March indicates a gradually tightening market.
Brent crude futures are at +$52.64 per barrel, down -8c or -0.2% from Friday's close. U.S West Texas Intermediate (WTI) crude futures are at +$48.47 a barrel, down -4c or -0.1%. The moves follow a sharp +3% rally in prices on Friday.
Note: U.S production has broken through +9.5m bpd, it's highest since July 2015.
Nevertheless, there are signs that U.S output may soon slow – Friday's Baker Hughes report showed that energy firms cut rigs drilling for new oil for a second consecutive week (-5 oil rigs in the week to Aug. 18), bringing the total count down to 763.
Gold prices are little changed as the market seeks direction after a week of geopolitical uncertainty in the U.S and Europe and ahead of a meeting of central bankers later this week. Spot gold has edged up +0.1% to +$1,286.01 an ounce. The ‘yellow' metal surged to its highest since November on Friday when political and security concerns in the U.S and Spain rattled investor nerves and supported demand.
3. Yields unchanged ahead of Jackson Hole
U.S government bonds have strengthened this year, reflecting investors' continuing demand for relatively safe-assets and their doubts about the prospect of strong U.S. economic growth and inflation under President Trump.
The yield on the 10-year Treasury note settled at +2.196% Friday, down from a peak above +2.6% in March and compared with +2.446% at the end of 2016.
In Japan, benchmark JGB's were steady overnight, underpinned by firmer U.S Treasuries and weaker Japanese stocks. The 10-year cash JGB yield was flat at +0.035%.
In Europe, Germany's 10-year yield declined -1 bps to +0.41%, while the U.K's 10-year Gilt yield decreased -1 bps to +1.08%.
4. Dollar steady ahead of central bankers speeches
The FX market starts the week little changed with the focus on the upcoming Jackson Hole conference that begins on Thursday.
Note: ECB's Draghi will attend, but will give a speech in Germany on Wednesday (3am EDT).
The market is speculating that there may be some sort of announcement of the tapering of its QE program, which is expected to be a two-step process that is split between September and October. The ‘single' unit continues to hover atop of Friday's closing €1.1740.
USD/JPY (¥109.03) is trading around the psychological ¥109 handle with the JPY currency remaining firm on safe-haven flows as the U.S and South Korean begin a 10-day joint military exercise.
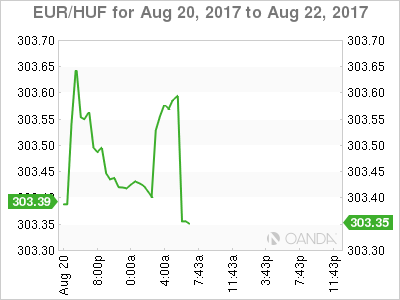
Elsewhere, emerging currencies (EM) such as the ZAR ($13.2130) is on the back-foot, slipping around -0.4% outright. Emerging European currencies are also failing to make headway against the EUR – CZK (€26.0805) has slipped -0.2% after last week's rally. The HUF (€303.51) is trading atop of its three-week highs ahead of tomorrow's central bank rate-setting meeting. The Hungarian national bank (MNB) is expected to keep its base rate on hold at a record low of +0.9%.
5. Germany's Bundesbank sees strong German growth continuing
In its latest market update this morning, the Bundesbank expects the German economy to continue its strong growth trend in Q3 on the back of industrial exports.
The comments follow official data last week that showed the German economy growing by +0.6% q/q, or +2.5% y/y in Q2, following annualized growth of +2.9% in Q1.
The central bank said that record sentiment in manufacturing, strong new orders, and a significant stock of orders still being worked through all 'suggest that industrial output can be expected to grow significantly again in the current quarter.'
The Bundesbank said that recent developments in the construction sector suggest slowing momentum. For consumers, the outlook, however, remains bright amid a strong labor market and positive income outlook.
What To Expect From The Eurozone After The German Elections?
- CDU's Merkel and SPD's Schultz likely to emerge the next leader
- Lesser threat of anti-EU parties shaking the status quo
- Germany set to bring about more closer integration with the EU
- New chapter in the France – Germany relations
- Improving economic outlook and political stability could keep the euro currency on the upside
The German elections are barely a month away. Unlike the other elections in the Eurozone this year such as the Netherland and France, the outcome of German elections is seen to be a fairly positive one for the eurozone.
Lesser threat of anti-establishment parties
Unlike the threat of rising anti-establishment parties in Netherlands and France, the top political parties, which are Angela Merkel's CDU and former European president, Martin Schultz's SPD are likely to emerge the leading contenders in the polls.
While political alliances are not something new to German politics the fact that most of the mainstream parties ruling out any alliance with the right leaning political parties is being seen as a safe bet.
The German elections will see the culmination to the Eurozone political scenario which started on uncertain grounds this year.
So what can we expect from the Eurozone after Germany votes for its next leader? Regardless of whether Schultz or Merkel coming into power, the Eurozone is all set to move forward with its intentions towards closer economic integration.
Will the FPD be able to emerge as a key player in 2017 government formation?
The main question will, of course, be how the leading parties will form their coalition partners. The question is whether Merkel or Schultz will be able to consolidate power without giving away too much.
Smaller political parties such as the Greens, the Free Democratic Party, the Left and the Alternative for Germany (AfD) are unlikely to emerge as the deal makers. Still, any form of government with one of the four smaller parties is unlikely to make a major impact on the national level of policy making or even influence policies in the Eurozone.
Among the smaller parties, the FPD has managed to play a role in the past German elections. However, after failing to make it into the 2013 Bundestag, the party has lost its influence. Still, under the new leadership, the party is optimistic that it will be able to gain a foothold in the 2017 government.
Closer integration with the EU
Both Merkel and Schultz have made it clear about their intentions towards closer integration with the EU. Also in question will be the relations between France and Germany.
For one, Schultz has expressed his desire to tone down the "German leadership of the EU." This has become the norm since the start of the financial and sovereign crisis in the Eurozone.
German led austerity policies have trickled down, affecting the lives of many in countries such as Greece. This also led to a somewhat anti-German view in the countries that were hit by the austerity measures.
By expressing his intentions to tone down Germany's influence in the EU, Schultz is likely to bring back the southern European nations which have felt alienated in the past. However, he does back a stronger integration. This is likely to happen in the event that the SPD manages to form the government with the backing of the FPD and the Greens.
On the flipside, however, the plans for a closer integration with the EU could hit a roadblock.
An alliance with the CDU/CSU and the FPD, on the other hand, could see Merkel race ahead with her plans. While the status quo will be unchanged and Germany likely to remain the key decision maker in EU policies, Ms. Merkel had clearly outlined her view towards building a stronger European Union.
Good times for the common currency?
The outcome of the German elections will also have an impact to the common currency. After starting the year on a shaky note, the euro has become one of the top performing currencies this year. On a year to date basis, the common currency has gained 11.8% and is the top currency across the top G8 currencies.
Given the rather stable outlook from the German elections and not much of a real threat to the Eurozone, the euro currency could be seen making further gains. Boosting these prospects is also the fact that the economic recovery in the eurozone has been relatively stable.
USDJPY Weakness Persists
The USDJPY has opened the new trading week close to the former weekly price close, with the pair remaining in a tight trading range, close to four-month trading low's, set on Friday.
Lower Japanese equity prices and concern over the Trump administrations ability to implement economic reforms, are all weighing on USDJPY trading sentiment this Monday.
The USDJPY pair remains bearish on all-time frames, with the price currently trading underneath all major moving averages, and below the daily, weekly and monthly pivot points.
Key intraday technical support is found at 108.96, the former weekly price low, at 108.60, and the April 17th price low, found at 108.13.
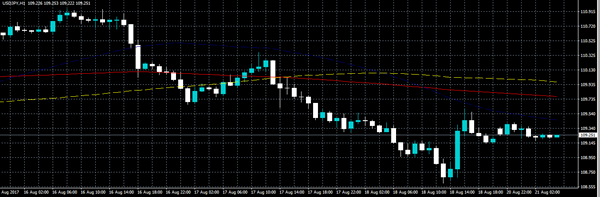
Key technical resistance is found at the 50-hour moving average, at 109.45, the recent swing high, at 109.59, and the daily pivot point, at 109.75.
Euro Tests Weekly Pivot
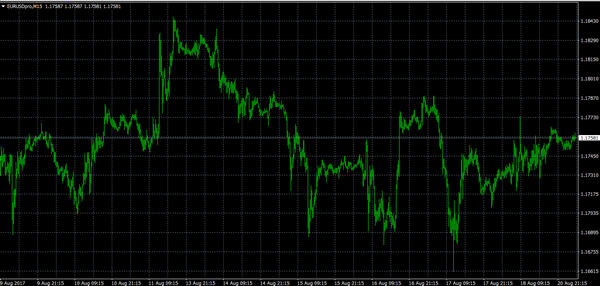
The EURUSD has started the new trading week with a neutral tone, as the euro searches for a directional bias around the pairs weekly pivot point, found at the 1.1754 level.
Today the economic calendar remains fairly light for the euro, with financial markets likely to be in a cautious mood, ahead of the annual Jackson Hole symposium on Thursday.
The EURUSD is currently bullish in the short, medium and long-term, with the euro vulnerable to trading losses, should price continue to struggle to trade above the 1.1786 level.
Key short-term technical resistance for the EURUSD is found at 1.1783, 1.1796 and the 1.1815 level.
Technical support for the EURUSD is found at the daily pivot point, at 1.1726, and the key 1.1713 level. Further support is found at the 1.1681 level, and the former weekly price low, at 1.1661.
Markets To Remain On Edge After Volatile Week
Global equity markets are coming off a rough week, as political tensions in Washington triggered a fresh bout of risk aversion. Declining risk appetite drove investors into the safety of precious metals, with gold prices briefly climbing above $1,300.00 a troy ounce. A dearth of economic data on Monday will keep investors focused on politics ahead of a highly active week in the market.
In terms of data releases, the UK Office for National Statistics will report on UK public sector net borrowing at 08:30 GMT. The monthly indicator tracks the amount of new debt held by the various levels of the British government.
Later in the day, the Deutsche Bundesbank will release the Buba monthly report, which provides a detailed account of the domestic economy.
In the North American session, the Federal Reserve Bank of Chicago will release the National Activity Index at 12:30 GMT. The monthly report gauges overall economic activity in the US economy.
North of the border, Statistics Canada will report on wholesale sales for the month of June.
In currencies, the US dollar was little changed against a basket of world peers on Monday. The dollar index (DXY) spiked to more than three-week highs last Tuesday before losing momentum in the latter half of the week. The greenback could face heavy price action later in the week as markets await the annual Jackson Hole Symposium, which is organized by the Federal Reserve Bank of Kansas City.
EUR/USD
The EUR/USD is consolidating in the mid-1.17 range. Prices recovered on Friday after losing ground during the previous session. The pair will take cues from political developments in Washington over the coming days. The EUR/USD immediate support is located at 1.1712, although analysts warn that this is a weak line. A breach of this level would expose 1.1616 as the next target. On the opposite side of the spectrum, immediate resistance is located at 1.1876.
GBP/USD
The British pound succumbed to bearish pressure last week, with the cable falling further below yearly highs. The GBP/USD exchange rate consolidated near five-week lows after prices failed to hold $1.2900. Cable was last seen trading at 1.2877, where it was little changed compared with the previous close. The 1.2840 area is a vital short-term support. A break below that level could expose cable to heavier losses. Bullish traders should look for a move north of 1.2900 to confirm the positive signal.
GOLD
Gold prices swung higher last week, overtaking the critical $1,300.00 level. The rally was short-lived, with prices falling back down toward $1,290.00. Traders looking to enter gold should monitor the stock market for risk sentiment. Volatility in equities will likely push investors into the safety of precious metals.
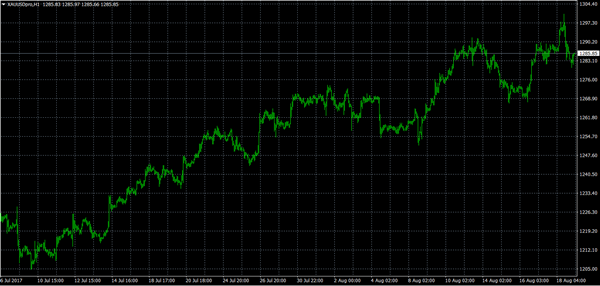
Technical Outlook: Spot Gold – Easing From $1300 Peak May Extend To Bull-Channel Support At $1272
Spot Gold regained traction on Monday and bounced to $1289 in Europe after opening with dap-lower and hit session low at $1280, where ascending 10SMA contained.
Gold price was significantly lower after Friday's strong rally that cracked psychological $1300 barrier and subsequent quick pullback.
Overall bulls remain intact, however risk of further easing towards $1272 (bull-channel support / rising 20SMA) exists, as failure to close above dented key barriers at $1292/96 and Friday's red daily candle with very long upper shadow weigh on near-term action.
Existing downside risk will be sidelined on regain of $1292 (11 Aug high) while extension above $1296 (06 June high) is needed to open way for retest of $1300 barrier and bullish resumption on firm break higher.
Res: 1289, 1292, 1296, 1300
Sup: 1280, 1276, 1272, 1267