Sample Category Title
Dollar Under Fresh Pressure; Euro Back above $1.18 as Draghi Speech Eyed
Major pairs were locked in tight ranges on Monday as a light economic calendar and thin summer trading volumes, as well as caution ahead of the Jackson Hole gathering of central bankers prevented traders from placing large bets. Keynote speeches by both Fed Chair Janet Yellen and ECB President Mario Draghi later in the week kept traders wary despite there being a consensus that neither will deliver any new policy messages at the event in Wyoming, United States on August 24-26.
The euro had a rollercoaster session as it came under pressure at the start of European trading to dip to a low of $1.1731 before shooting just above $1.1800 after the US market opened. The main focus for the euro this week will be Wednesday's flash PMI readings for the Eurozone. Draghi is scheduled to give two speeches this week, one in Germany (Wednesday) and the other at Jackson Hole (Friday). While he may try to avoid talking about the ECB's expected stimulus withdrawal in 2018, his comments on the inflation outlook could still help steer the forex market.
Similarly, Yellen is unlikely to add any fresh policy insight in her address on Friday but traders will nevertheless be looking for signs on whether the Fed chief is becoming increasingly worried about low inflation.
The US dollar drifted lower versus the yen for much of the day, coming close to erasing all of its gains from Friday's bump up that followed the stronger-than-expected consumer sentiment data from the University of Michigan. The greenback fell back below 109 yen and last stood at 108.75. It's broader measure, the dollar index, was slightly down at 93.18. Also lifting the US currency on Friday was the announcement that President Trump's chief strategist, Stephen Bannon, had been fired from his role.
However, the boost to the markets was short-lived as investors doubted whether the latest White House departure would smoothen the path for Trump's tax reforms plans in Congress. This weighed on the dollar, while it kept safe-havens in demand. In addition, anxiety over North Korea lingered in financial markets as the US and South Korea began a 10-day military exercise, further supporting safe-havens such as gold and the yen, though the Swiss franc was mixed.
Gold headed back up towards Friday's 9-month high of just above $1300 an ounce and was last trading around $1290 an ounce.
The pound was mixed at the start of the week, though it managed to firm slightly against the dollar. There was some support for sterling today as the British government further clarified its position on Brexit. The UK government is due to publish a series of Brexit position papers this week, following on from last week's paper on the Northern Irish border with the Republic of Ireland.
Today's publication outlined details on a post-Brexit customs agreement with the EU, with the British side pressing for "the freest and most frictionless trade possible in goods and services". However, there are fears the negotiations on the next phase of the Brexit talks could be delayed as EU officials insist that not enough progress has been made on the key issues of EU citizens' rights and the divorce bill, despite assurances to the contrary by the UK prime minister's spokeswoman.
The pound climbed to just above the $1.29 level in late European session, but was down versus the single currency, with euro/pound edging up to 0.9143.
The only notable data release today were Canadian wholesale trade figures. Wholesale trade in Canada missed estimates of a 0.2% drop to decline by 0.5% over the month in June. The loonie was little changed after the data, with dollar/loonie trading around 1.2580, not far from Friday's 2-week low, despite the weak data and lower oil prices.
Oil prices fell back on Monday as traders took profit from Friday's surge when they rose by over 3%. WTI oil fell by nearly 1% at $48.06 a barrel and Brent crude was down by a steeper 1.5% at $51.90.
Trade Idea Wrap-up: EUR/USD – Target met and buy at 1.1770
EUR/USD - 1.1810
Most recent candlesticks pattern : N/A
Trend : Sideways
Tenkan-Sen level : 1.1772
Kijun-Sen level : 1.1773
Ichimoku cloud top : 1.1738
Ichimoku cloud bottom : 1.1726
Original strategy :
Bought at 1.1715, met target at 1.1815
Position : - Long at 1.1715
Target : - 1.1815
Stop : -
New strategy :
Buy at 1.1770, Target: 1.1870, Stop: 1.1735
Position : -
Target : -
Stop : -
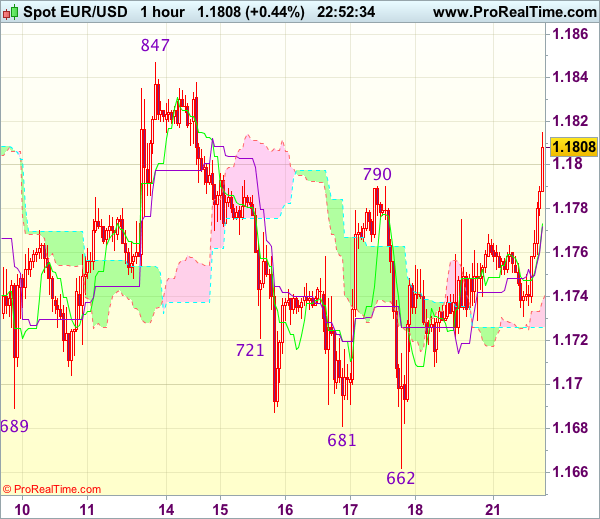
Current anticipated rally above previous resistance at 1.1790 has justified our bullishness, this move also adds credence to our view that pullback from 1.1910 has ended at 1.1662 last week, hence upside bias remains for test of resistance at 1.1847, break there would provide confirmation and encourage for headway got 1.1870-80, however, reckon said resistance at 1.1910 would hold from here.
As we have taken profit on our long position entered at 1.1715, would not chase this rise here and would be prudent to buy euro again on pullback as 1.1760-70 should limit downside. Only below 1.1725-30 would abort and suggest the rebound from 1.1662 has ended instead, risk weakness to 1.1695-00 first.
Trade Idea Wrap-up: USD/JPY – Stand aside
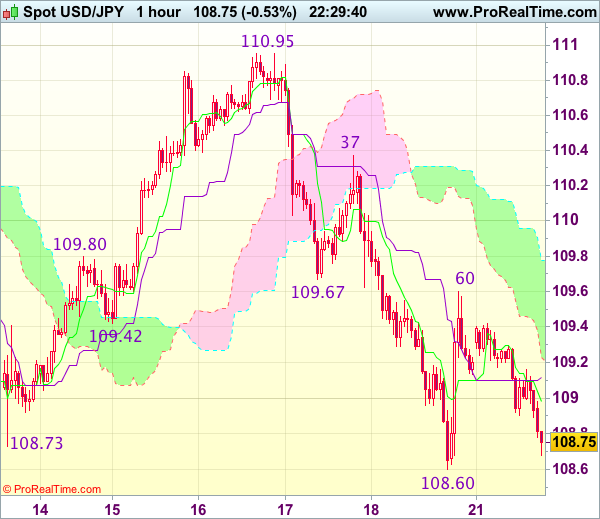
USD/JPY - 108.80
Most recent candlesticks pattern : N/A
Trend : Near term down
Tenkan-Sen level : 108.98
Kijun-Sen level : 109.12
Ichimoku cloud top : 109.78
Ichimoku cloud bottom : 109.23
New strategy :
Stand aside
Position : -
Target : -
Stop : -
As dollar has slipped again after meeting resistance at 109.60, suggesting retest of last week’s low at 108.60 would be seen, break there would recent decline is still in progress and may extend further weakness to 108.30 (1.618 times projection of 110.95-109.67 measuring from 110.37), then towards 108.10-15 (61.8% projection of 110.95-108.60 measuring from 109.60), however, near term oversold condition should prevent sharp fall below latter level and reckon 108.00 would hold from here, bring rebound later.
In view of this, would not chase this fall here and would prudent to stand aside for now, then look to sell dollar on subsequent rebound, above 109.25-30 would bring another bounce to 109.60-67 resistance, however, break there is needed to signal low is formed, bring further gain to 110.00 and possibly towards 110.37 resistance.
EURUSD Sellers in Retreat
The EURUSD pair is currently trading back towards the key 1.1754 region, after euro sellers failed to take the pair below the 1.1730 support level during a quiet European trading session.
The monthly BUBA report, from the German Bundesbank, is supporting the euro's intraday trading sentiment, with the German bank continuing to forecast further bullish growth this fiscal quarter.
The intraday trading sentiment surrounding the EURUSD remains bullish above the 1.1754 level. In the medium term, the pair continues to range trade in a down slopping channel, with a sizeable break-out pending.
Short term resistance is located at the current daily price high, at 1.1769, the 200-week moving average at 1.1783, and the downward channel top adds critical resistance, at 1.1793.
Key intraday support for EURUSD pair is located at the current daily price low, at 1.1730 level, the 1.1713 level, and the former swing low, at 1.1681.
GBPUSD Attempting to Recovery 1.2900
The GBPUSD pair has performed a strong intraday technical recovery from the weekly low, set at 1.2849, with British pound buyers now attempting to push price towards the key 1.2900 level.
Despite weaker than expected UK home data earlier today, which showed average house prices declining, sterling remains supported by a weaker U.S dollar index, and technical buying from the pairs 100-day moving average.
The GBPUSD pair remains bullish on an intraday basis, whilst price continues to trade above the daily pivot point, at 1.2877. However, sterling's medium outlook remains bearish whilst trading below the 1.3000 level.
Key intraday support is found at 1.2877, the 1.2859 level, and the channel bottom, at 1.2835.
GBPUSD intraday technical resistance is found at the 1.2900 level, the pairs weekly pivot point, at 1.2910, and the key 1.2932 level.
GBP/USD Could Buyers Take It Higher?
GBP/USD Posted little gains today and needs a spark to be able to start another bullish momentum. Is trading in the green right, but looks undecided. I hope that we'll have a trading opportunity very soon because looks like that the USD will decrease a little on the short term.
Price could increase as the USDX may slip lower in the upcoming days, the index is trading right below the 93.50 psychological level and could resume the Friday's bearish candle. USDX remains under pressure as long as stays below the 93.81 static resistance, it could come down to recapture more directional energy before will start another bullish momentum.
The Cable increased today, even if the United Kingdom Rightmove HPI dropped by 0.9% in August, versus a 0.1% growth in the previous reading period.
Price narrows on the short term right on the upper median line (ML) of the major descending pitchfork, only a retest of this dynamic support will signal another leg higher. Is premature to say that we'll really have a bullish momentum until will come to retest also the 1.2798 static support.
Support can be found at the second warning line (wl2) of the minor ascending pitchfork. We may have a sideways movement above the 1.2798 level in the upcoming period before we'll have a clear direction.
A further retreat will be confirmed only after a valid breakdown below the 1.2798 static support, this scenario will take shape only if the USDX will breakout above the 93.81 static resistance.
Gold Setting Up For More Gains
Price has come down to retest the 38.2% retracement level, a minor consolidation here will attract more buyers, which will lead the rate towards new highs. We had a false breakout above the 23.6% retracement level and above the $1295 per ounce.
Is still trapped within a sideways movement, only a valid breakout from this range will confirm a major increase towards the lower median line (LML) of the ascending pitchfork.
Brent Oil Bounce Or Break?
Price dropped sharply after the retest of the 53.03 static resistance, however, a breakout is favored after the Friday's impressive rally. Brent Oil is facing a tough resistance area, resistance can be found at the 61.8% retracement level and higher at the warning line (wl1) as well.
Only a breakout above these levels will send the rate towards the median line (ML) of the major ascending pitchfork.
GBP/USD Mid-Day Outlook
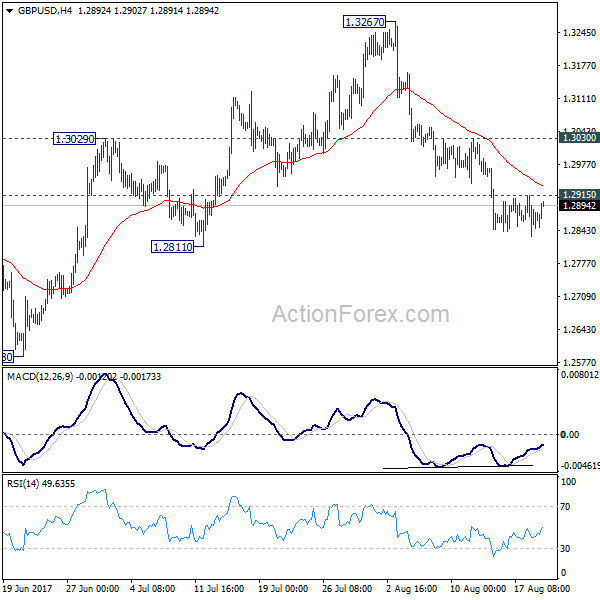
Daily Pivots: (S1) 1.2830; (P) 1.2873; (R1) 1.2916; More...
With 1.2915 minor resistance intact, intraday bias in GBP/USD stays on the downside. Current fall from 1.3267 should target 1.2588 key near term support. We're favoring the case that correction from 1.1946 is completed at 1.3267. Decisive break of 1.2588 will confirm our view and target a test on 1.1946 low. On the upside, above 1.2915 minor resistance will turn intraday bias neutral first. But near term outlook will remains cautiously bearish as long as 1.3030 resistance holds.
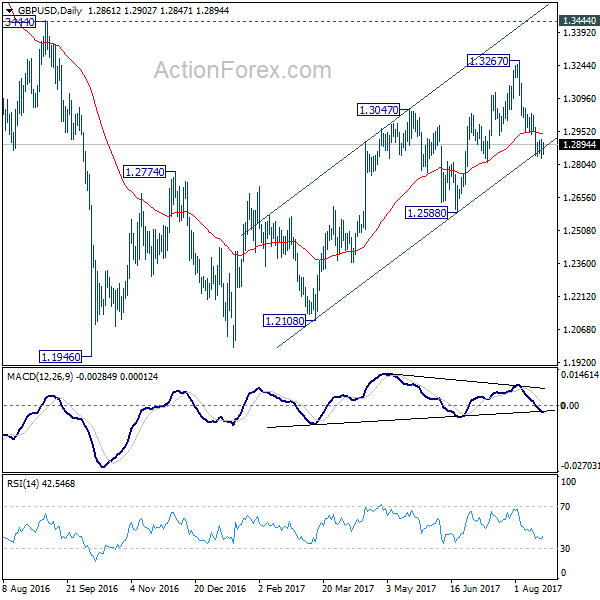
In the bigger picture, overall, price actions from 1.1946 medium term low are seen as a corrective pattern. While further rise cannot be ruled out, larger outlook remains bearish as long as 1.3444 key resistance holds. Down trend from 1.7190 (2014 high) is expected to resume later after the correction completes. And break of 1.2588 will indicate that such down trend is resuming.
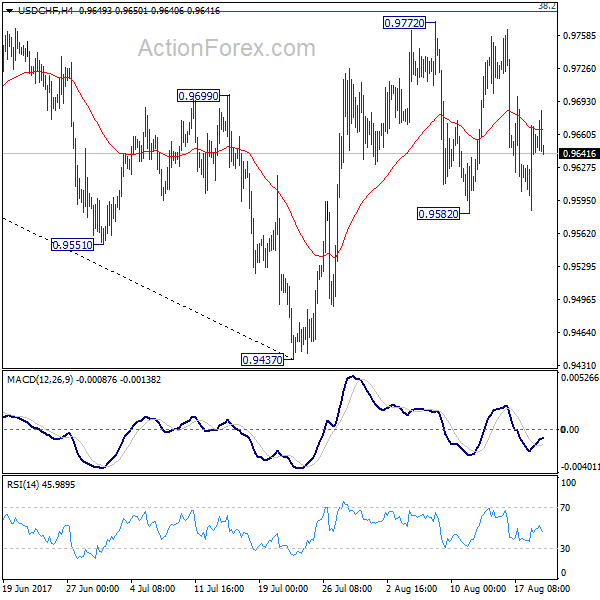
USD/CHF Mid-Day Outlook
Daily Pivots: (S1) 0.9600; (P) 0.9634; (R1) 0.9683; More...
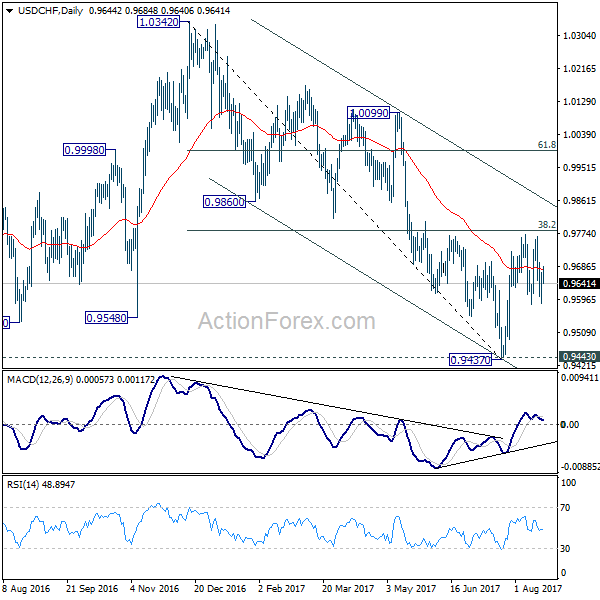
Intraday bias in USD/CHF remains neutral at this point as sideway trading continues. On the upside, decisive break of 0.9772 resistance will revive the bullish case of reversal. That is, whole decline from 1.0342 has completed at 0.9437 after defending 0.9443 support. USD/CHF should then target channel resistance (now at 0.9862) next. Meanwhile, the pair is bounded inside medium term falling channel and limited below 38.2% retracement of 1.0342 to 0.9437 at 0.9783 for the moment. Break of 0.9582 will turn bias back to the downside for 0.9437. This could also extend the fall from 1.0342 through 0.9437/43 key support level.
In the bigger picture, we're slightly favoring the case that USD/CHF has successfully defended 0.9443 key support level. And long term range trading in 0.9443/1.0342 is extending with another rise. At this point, there is no sign of an up trend yet. Hence, while further rise is expected in USD/CHF, we'll start to be cautious on loss of momentum above 61.8% retracement of 1.0342 to 0.9437 at 0.9996. However, firm break of 0.9443 will carry larger bearish implication and would target next key support at 0.9072.