
Sample Category Title
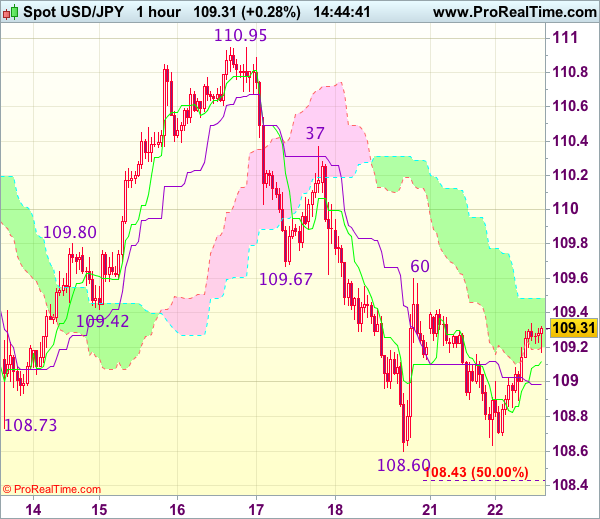
Trade Idea : USD/JPY – Stand aside
USD/JPY - 109.33
Most recent candlesticks pattern : N/A
Trend : Near term down
Tenkan-Sen level : 109.12
Kijun-Sen level : 108.99
Ichimoku cloud top : 109.49
Ichimoku cloud bottom : 109.20
New strategy :
Stand aside
Position : -
Target : -
Stop : -
Despite yesterday’s all to 108.63, the subsequent rebound after holding above indicated support at 108.60 has retained our view that further consolidation would take place and another test of resistance at 109.60-67 cannot be ruled out, however, a firm break above there is needed to signal low has been formed at 108.60, bring a stronger rebound to 110.00 and later towards resistance at 110.37 which is likely to hold from here.
On the downside, below 108.80 would bring retest of 108.60 but only break there would signal recent decline has resumed and may extend further weakness to 108.30 (1.618 times projection of 110.95-109.67 measuring from 110.37), then towards 108.10-15 (61.8% projection of 110.95-108.60 measuring from 109.60), however, loss of downward momentum should prevent sharp fall below latter level and reckon 108.00 would hold from here, bring rebound later. As near term outlook is mixed, would be prudent to stand aside for now, then look to sell dollar on subsequent rebound.
Currencies: Dollar Holding Within Reach Of Recent Lows
Sunrise Market Commentary
- Rates: Positive bias core bonds ahead of Yellen/Draghi
We forecast trading to remain sentiment-driven ahead of speeches by ECB Draghi (tomorrow and Friday after close) and Yellen (Friday). Current market sentiment underpins core bonds as subdued inflation readings dealt a blow to tightening expectations while turmoil in Washington sparked some volatility on Wall Street. - Currencies: dollar holding within reach of recent lows
The dollar continues to trade soft, but nearby technical support levels are left intact as investors await CB speeches at the Jackson hole Fed symposium. Today's data won't change the global dollar picture. EUR/GBP extends its impressive rebound as investors look forward to the next round of Brexit negotiations
The Sunrise Headlines
- US equities ended little changed with energy (lower oil prices) and financials lagging and real estate outperforming. Asian equities started the day on a stronger footing (good corporate results) and US equity futures show gains too.
- Britain will be subject to the rulings of European courts after Brexit, the government has conceded, in an apparent climb-down from its promise of judicial independence, said the Guardian.
- President Trump made an open-ended commitment to Afghanistan that'll add as many as 4,000 more US troops into the country and keep American forces there as long as it takes to ensure a stable and enduring peace.
- Oil prices dropped sharply yesterday to €51.66/barrel, reversing Friday's gains. OPEC's Vienna meeting ended quietly without decision on the future of supply cuts. The cartel will discuss whether to extend or end the deal in November.
- The Hungarian central bank meets, but consensus unanimously expect an unchanged decision (base rate of 0.9%). The forint performed well recently and approaches the EUR/HUF 300 threshold (now 303.29).
- Today's calendar remains light with the August German ZEW economic sentiment and the US Richmond Fed manufacturing surveys. In the UK, public finances (July) and the CBI trends report are up for release. ECB Constancio speaks.
Currencies: Dollar Holding Within Reach Of Recent Lows
Dollar holding near the recent lows
EUR/USD held within reach of the early August top in recent weeks, but no new test occurred. This indecisive pattern continued yesterday. The dollar traded with a slightly negative intraday bias, partially due to a negative risk sentiment. EUR/USD drifted back north of 1.18 and closed the session at 1.1815. Investors awaited speeches of Fed's Yellen and ECB's Draghi at the Jackson Hole Fed symposium on Friday. USD/JPY drifted temporary below 109, but rebounded to the 109 area as risk sentiment improved later in US dealing.
Overnight, Asian equities show moderate gains, but volumes are low as there is no high profile (economic) news. The yen eases slightly. USD/JPY tries to find a bottom after a protracted decline throughout August. EUR/USD hovers near 1.18.
In EMU, the German August ZEW economic sentiment is expected to decline slightly. The current situation sub-index peaked in June (88). The expectations' component hovered sideways of late . A strong decline of the expectations would signal that the economy is rolling over, which we don't expect. The August Richmond Fed manufacturing index is expected to have declined to 10 from 14. Other recent surveys suggested that manufacturing is doing well. With a weaker dollar and signs of better domestic demand, we count on a stabilization of the Richmond Fed. The index is volatile and sharply surprised on the upside in July. The impact on USD trading should be limited. At the margin, the data might be slightly USD supportive, or at least slow the USD decline. The global equity performance remains a wildcard for USD trading. An easing of recent equity softness might be marginally USD supportive. Focus remains on the speeches of Yellen and Draghi later this week.
Broader context and technical picture. Late June, EUR/USD started a new upleg as investors anticipated a reduction of ECB bond buying to be announced in autumn. The Fed was expected to remove policy stimulation only in a very gradual way as US inflation remained soft. Uncertainty on the policy of the Trump administration was an secondary negative factor for the dollar. EUR/USD set a new correction top north of 1.19 before consolidating in a narrow 1.1662/1.1910 trading range. We expect this range will hold going into the Jackson Hole symposium. If US data remain ok (as most were this month) and if Draghi gives little information on next ECB steps, there might be room for a modest USD comeback. A return of EUR/USD to the 1.15/16 area is possible. Pockets of US political risk are a (negative) wildcard for the dollar.
A downward correction in core (US and European) yields supported the yen in August. USD/JPY declined from the mid 114 area mid-July to 108.60 last Friday. The April correction low (108.13) remains the key line in the sand. For now, this level won't be easy to break as quite some USD bad news is discounted after the recent protracted setback. A cautious buy-on-dips approach (with stop-loss protection below 108) may be considered
EUR/USD correction top stays within reach
EUR/GBP
EUR/GBP extends protracted uptrend
Yesterday, the gradual, but protracted EUR/GBP uptrend continued. Investors awaited new info on the Brexit negotiations going into a next round of formal talks next week. There were no UK eco data. In technical trading, EUR/GBP closed the session at 0.9162. Cable held an extremely tight sideways range in the upper half of 1.28/low 1.29. USD softness helped sterling.
Today, the UK monthly public finance data and the CBI trends orders data will be published. The data are usually only of second tier importance for sterling trading. The CBI orders are expected marginally softer at 8 from 10. Recent UK eco data were not too bad even as higher inflation is eroding Britons capacity to spend. The difficult Brexit talks remain a negative sterling factor MT. However, the recent rise of EUR/GBP has gone quite far and the pair is moving into overbought territory. So, we look for a correction, for whatever reason (correction in EUR/USD, decent UK eco data, improving global risk sentiment…).
From a technical point of view, EUR/GBP cleared the 0.8854/80 resistance (top end June), opening the way for further gains The move was the result of euro strength (ongoing strong EMU growth and expectations of the ECB reducing policy stimulation later this year). At the same time, UK price data remain soft enough for the BoE to keep a wait-and-see modus as the Brexit negotiations continue. MT, we maintain a buy EUR/GBP on dips approach as we expect the constellation of relative euro strength and sterling softness to continue. The 0.9415 flash-crash spike is the next MT target on the charts. However, we don't jump on the trend anymore after recent protracted EUR/GBP rally and wait for a correction, e.g to the technical support in the 0.88/89 area.
EUR/GBP: consolidation near recent top
Market Update – Asian Session: Markets Shrug Of Latest N. Korea Threat
Asia Summary
Asian equity markets opened mixed, trade was quiet with the Hang Seng being the stand out. It was again a quiet economic data day, giving little direction to the currencies, though a stronger dollar trend has emerged as the session entered its second half. The offshore yuan is poised for the highest close since September (5th day of gains), boosted by a stronger central bank reference rate after a dollar weakness overnight. According to an un-named senior PBOC adviser, the yuan advance may continue this year. Markets continue to shrug off North Korea threats, KCNA said that the US will face revenge for ignoring North Korea warning.
Key economic data
(AU) Australia ANZ Roy Morgan Weekly Consumer Confidence Index: 109.2 v 111.7 prior
Speakers and Press
China/Hong Kong
(CN) China should shift more financial resources to high-tech and emerging industries and away from loss-making or highly leveraged ‘zombie’ firms – People’s Daily Commentary
Korea
(KR) North Korea KCNA reiterates South Korea and US drill heighten tensions; US will face revenge for ignoring North Korea warning
(KR) South Korea Fin Min Kim: Govt debt to be managed at lower than KRW700T; Hard to increase Govt spending by 7%/yr
Japan
(JP) Japan to seek ¥5.25T defense budget for FY18 - Japanese Press
Australia
(AU) Analysts comment that China restrictions on overseas property development will hurt Australia's land sales and residential property development - AFR
(AU) S&P: Australia And New Zealand ABS Performed Well In Q2 2017
Other
(PH) Philippines Finance Chief Dominguez: Rate of change in dollar/Peso (PHP) is of 'concern', but we are 'not uncomfortable' with it
(US) US House Majority Leader Ryan: Reiterates committed to tax overhaul in 2017
(US) President Trump: Announces will make drastic changes to strategy in Afghanistan as he believed withdrawing troops from the country would have unacceptable effects on the region; "wont say when we will attack but attack we will "
Asian Equity Indices/Futures (00:00ET)
Nikkei 0.0%, Hang Seng +1.1%, Shanghai Composite +0.1%, ASX200 +0.3%, Kospi +0.4%
Equity Futures: S&P500 +0.2%; Nasdaq100 +0.4%, Dax +0.1%, FTSE100 +0.2%
FX ranges/Commodities/Fixed Income (00:00ET)
EUR 1.1824-1.1803; JPY 109.33-108.89; AUD 0.7951-0.7932; NZD 0.7335-0.7318
Dec Gold -0.2% at $1,294/oz; Oct Crude Oil +0.4% at $47.73/brl; Sept Copper +0.2% at $2.98/lb
(CN) China PBOC OMO injects CNY60B v CNY180B in 7 and 14-day reverse reports prior: net drains CNY10B v drains CNY50B prior
USD/CNY (CN) PBOC SETS YUAN REFERENCE RATE AT 6.6597 V 6.6709 PRIOR
(TH) Thailand sells combined THB60B in 3-month and 6-month bonds
(JP) Japan MoF sells ¥813.3B v ¥1.0T indicated in 0.60% (0.60% prior) 20-yr JGBS; avg yield 0.5500%; bid-to-cover 4.51x (strongest demand since Jan 2014)
Equities notable movers
Hong Kong/China
207.HK COFCO Property Group to acquire stake in Joy City; +19%
Australia/New Zealand
BHP.AU Reports FY17 underlying Net $6.73B v $7.3Be; Rev $38.3B v $38.3Be; to exit US onshore assets; Announces US and Euro bond buyback plan, subject to a $2.5B cap; +1.3%
ACX.AU Reports FY17 Net loss A$9.97M v profit A$5.7M y/y; Rev A$161.2M v A$123.4M y/y; -10%
CVT.NZ Reports FY17 (NZ$) NPAT 9.8M v 18.1M y/y, EBITDA 19.8M v 37.0M y/y, Rev 156M v 192M y/y; +11%
Taiwan
2498.TW Cuts price of Vive VR headset by $200 to $599; +8.8%
Trump Can Get Focus Back On The Policy Agenda
Market movers today
German ZEW expectations are due out today and we look for a slight further decline. Sentiment has been a bit in retreat recently (albeit from high levels) and we expect the stronger euro to put a further dent on ZEW expectations.
In the US, FHFA house prices are expected to show an unchanged rate of around 0.5% m/m corresponding to a 6% annualised rate. Rising housing wealth is one of the factors supporting US consumers on top of robust job growth and a rebound in real wage growth due to lower inflation.
Otherwise, focus continues to be on Jackson Hole later this week and whether Trump can get focus back on the policy agenda and his apparent new push for tax reform, which was reported by several media out lets yesterday.
Selected market news
According to a Fed survey published yesterday, US workers have low hopes for higher paychecks. When asked what the lowest annual salary was that they would accept in a new job the respondents replied USD57,960 on average in July down form USD59,660 four months earlier. When asked what salary they would expect in job offers over the next four months, the respondents on average replied USD50,790 , down from USD54,590 four months earlier.
In our view, the tightness of the US labour market is not the only factor determining wage growth, as second-round effects following many years of low inflation have hit wage growth. When employees expect inflation to remain low, they can live with low wage growth, as real wage growth may still be solid, making it less likely that inflation will reach the target (see Flash Comment US: Fed likely to continue tightening on strong jobs report, 7 August 2017).
With Steve Bannon leaving his role as Donald Trumps' Chief Strategist last week, focus is turning to whether this will pave the way for pushing forward a policy agenda that could gain support from Republicans. According to the Financial Times, the new Chief of Staff, John Kelly, is leading efforts to restore order to the White House and the tax cut agenda has been chosen as the best candidate to score a legislative gain and repair relations with the business community.
UK Prime Minister Theresa May's government is due to publish more details of UK's Brexit plans today with focus on civil judicial cooperation ahead of a document on the role of the EU Court of Justice on Wednesday.
Cable Retains Bearishness Ahead Of Jackson Hole
Key Points:
- Cable retains a bearish directional bias.
- Price action remains trapped below 50 and 100 Day EMA’s.
- Pair likely to remain under pressure in the week ahead.
The Cable continued to move lower last week as the pair was caught on the wrong side of the wave of sentiment swinging towards the greenback. Subsequently, early in the week saw a relatively rapid fall for the Cable, as the pair was dealt a blow from a -0.1% UK CPI result, and this commenced a slide which saw it close the week around 130 pips lower at 1.2870. Subsequently, there is plenty of evidence that the Cable could be in for a further fall ahead in the coming week.
The Cable never really had a chance to pick itself up last week and trading started off with some sharp declines following a stark miss in the UK CPI results. The key metric was forecast to come in flat at 0% but instead slipped to -0.1% m/m which kicked off some sharp selling. This was compounded when the U.S. Retail Sales data climbed strongly to 0.6% which set off a sentiment swing which the pair never recovered from. In addition, the U.S. Initial Jobless Claims, and U.S. Philly Fed Business Outlook Index also proved relatively robust at 232k, and 18.9, respectively. Subsequently, the Cable fell around 130 pips, over the course of the week, to close trading out at 1.2870.
Looking ahead, the pending week should be relatively interesting for the Cable given the large slew of economic data due for release. In particular, the UK GDP numbers are likely to be closely watched by the market given their relative importance and forecast of 0.3% q/q. The much awaited U.S. Core Durable Goods Order figures are also due to print and, given the recent U.S. economic strength, could provide a surprise to the upside. Finally, we could see plenty of volatility as the Jackson Hole Summit fires up late in the week and many of the major actors in fiscal and monetary policy get together to mull over the economy. Typically, there is always some interesting comments emanating from the forum which means it is often worthwhile monitoring.
From a technical perspective, the Cable’s recent decline from 1.3267 appears to have extended over the past week. Price action remains below the critical 100 Day MA whilst the RSI Oscillator is presently within neutral territory. Subsequently, our initial bias remains on the downside for the week ahead with a further breakdown highly likely. Support is currently in place for the pair at 1.2862, 1.2810, and 1.2774. Resistance exists on the upside at 1.2918, 1.3029, and 1.3267, and 1.3480.
Ultimately, the Cable is likely to have a relatively rough week ahead as long as price action remains trapped under the 50 and 100 Day MA. At this stage, an upside breakout looks unlikely unless both the fundamental and technical trends change in the week ahead. Regardless, keep a watch on the key 1.30 handle because if a breakout does occur this could be the critical inflection point.
Daily Technical Analysis: EUR/USD First Signs Of Bullish Break Above 1.18 Bull Flag
Currency pair EUR/USD
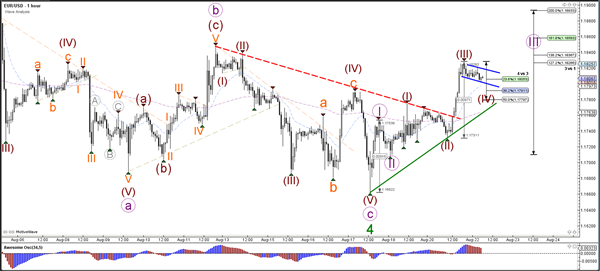
The EUR/USD is breaking above resistance trend lines (dotted reds) of a bull flag continuation chart pattern of a wave 4 (green) correction. This bullish break above resistance (red) could confirm the end of wave 4 and start of wave 5.
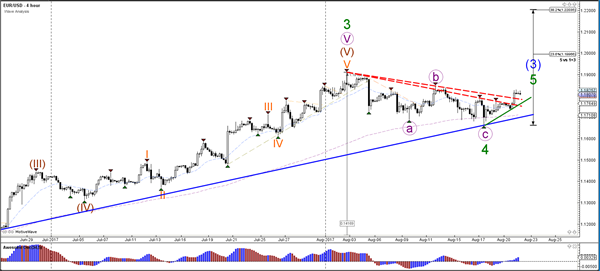
The EUR/USD seems to be building a 5 wave extension within wave 3 (purple). The wave 4 (brown) pullback should not retrace deeper than the 50% at 1.1780 otherwise the wave 4 is invalidated. A break above the bull flag chart pattern confirms the continuation of the wave 3 (purple) towards the Fib targets of wave 3 vs 1.
Currency pair USD/JPY
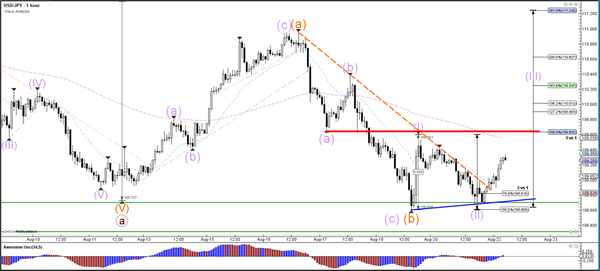
The USD/JPY has bounced again at the key support zone (green lines). The bullish bounce could see price expand a wave B (brown) correction via an ABC (orange) flat.
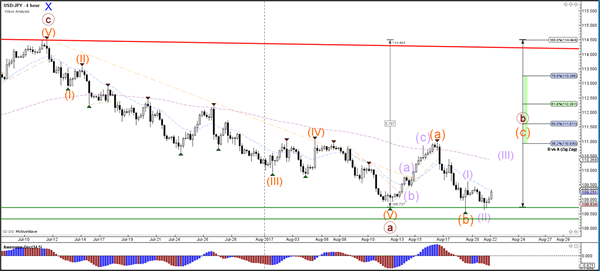
The USD/JPY broke above the resistance trend line (dotted orange) of the downtrend and is now showing a potential bounce. A bullish break above resistance (red) would confirm the potential wave 3 (purple) whereas a bearish break below support (green) would invalidate it.
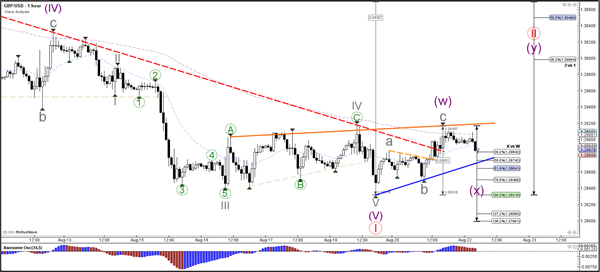
Currency pair GBP/USD
The GBP/USD could have completed a 5th wave (purple) within wave 1 (red). A bullish bounce at the support trend line (blue) could see price move higher towards the Fibonacci retracement levels of wave 2 (red).
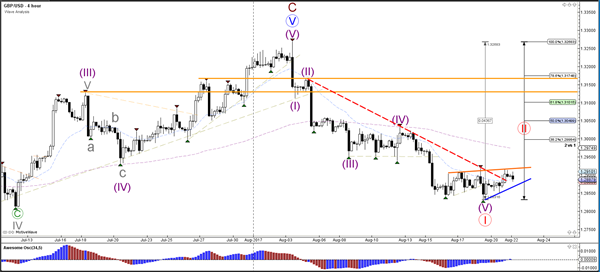
A GBP/USD seems to be building a large correction via WXY (purple).
Daily Technical Outlook And Review: EUR/USD, GBP/USD, AUD/USD, USD/JPY, USD/CAD, USD/CHF, DOW 30, GOLD
A note on lower timeframe confirming price action...
Waiting for lower timeframe confirmation is our main tool to confirm strength within higher timeframe zones, and has really been the key to our trading success. It takes a little time to understand the subtle nuances, however, as each trade is never the same, but once you master the rhythm so to speak, you will be saved from countless unnecessary losing trades. The following is a list of what we look for:
- A break/retest of supply or demand dependent on which way you're trading.
- A trendline break/retest.
- Buying/selling tails ... essentially we look for a cluster of very obvious spikes off of lower timeframe support and resistance levels within the higher timeframe zone.
- Candlestick patterns. We tend to only stick with pin bars and engulfing bars as these have proven to be the most effective.
We typically search for lower-timeframe confirmation between the M15 and H1 timeframes, since most of our higher-timeframe areas begin with the H4. Stops are usually placed 1-3 pips beyond confirming structures.
EUR/USD
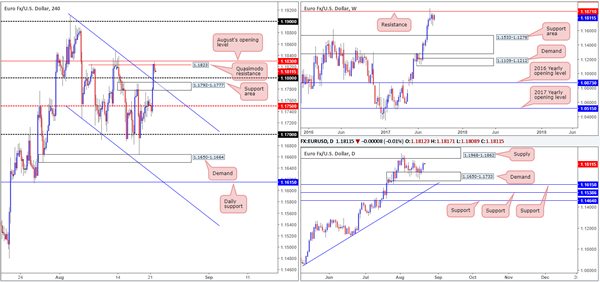
Across the board, we saw the US dollar decline on Monday against the majority of its trading peers. This drove the EUR/USD higher, consequently clearing multiple tech resistances on the H4 timeframe. The single currency settled for the day challenging a H4 Quasimodo resistance pegged at 1.1823, which, as you can see, is shadowed closely by August's opening level at 1.1830. According to the H4 candles on the US dollar index (USDX), there's room for the dollar to stretch a little lower before we reach support at 11900. For that reason, there's a chance the EUR may breach the two current resistances today.
Despite weekly action seen trading from resistance at 1.1871, price has yet to generate anything noteworthy to the downside. A similar picture can be seen on the US dollar index (USDX), only inverse from a weekly support drawn in at 11854. Down on the daily timeframe, demand at 1.1650-1.1733 elbowed its way back into the picture early last week and held firm. Yesterday's rally from this zone has placed the market within touching distance of supply coming in at 1.1968-1.1862 (encapsulates the current weekly resistance line).
Suggestions: Selling this market is fraught with danger, in our humble view. Not only do we have buying pressure from the aforesaid daily demand zone, we also have a collection of nearby H4 supports lurking below (the 1.18 handle, the support area at 1.1792-1.1777 and a trendline support etched from the high 1.1910). Buying beyond the 1.1830 mark on the other hand looks interesting on the H4 timeframe, but unfortunately somewhat precarious on the daily timeframe given the supply zone positioned above!
Based on these points, opting to stand on the sidelines here may very well be the better path to take today.
Data points to consider: German ZEW economic sentiment at 10am GMT+1.
Levels to watch/live orders:
- Buys: Flat (stop loss: N/A).
- Sells: Flat (stop loss: N/A).
GBP/USD:
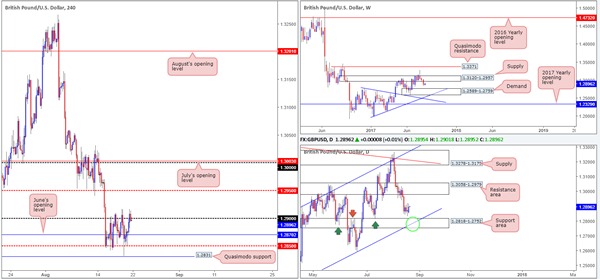
In recent trade, the GBP/USD gathered momentum on greenback weakness. For a week now, the H4 candles have been consolidating between the 1.29 handle and the mid-level support at 1.2850 (encased within this range is June's opening level at 1.2870). Despite yesterday's advance, the pair remains confined within this consolidation. With that being said though, the H4 candles on the US dollar index (USDX) show room for the dollar to stretch a little lower before we reach support at 11900. Thus, in a similar fashion to the EUR, we may see the GBP attempt to breach 1.29 again today.
Over on the weekly timeframe, the unit is seen trading beneath supply at 1.3120-1.2957. To the downside, the next notable area to keep an eye on is the demand base coming in at 1.2589-1.2759. What's also notable from a technical perspective on this chart is the two intersecting trendline supports positioned just beneath the demand zone (1.2774/1.1986). Meanwhile, on the daily timeframe there's a nearby support area marked at 1.2818-1.2752, seen intersecting nicely with a channel support line etched from the low 1.2365 (green circle). Also of particular interest is this area happens to be glued to the top edge of the aforementioned weekly demand.
Suggestions: In view of the unit's close proximity to the said daily support area, we're reluctant to take on any medium/long-term shorts at this time. We know there's a lot of ground to cover, but we still have our eye on the 1.28 handle for possible longs. Given the support and resistance delivered from this psychological band in the past, and its connection with the converging daily support area and channel support, we feel a trade from here is high probability.
Still, round numbers are prone to fakeouts, and therefore, we would not feel comfortable placing pending orders here. Instead, we'll wait for a H4 bull candle to form in the shape of a full, or near-full-bodied candle, before pulling the trigger. As for take-profit targets, we'll be looking to the 1.2850 neighborhood as the initial area of concern.
Data points to consider: No high-impacting events scheduled to be released today.
Levels to watch/live orders:
- Buys: 1.28 region ([waiting for a reasonably sized H4 bullish candle to form – in the shape of either a full, or near-full-bodied candle – is advised] stop loss: ideally beyond the candle's tail).
- Sells: Flat (stop loss: N/A).
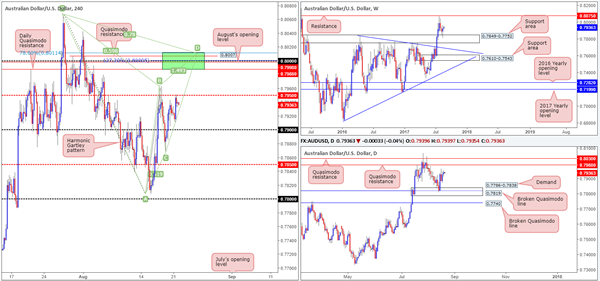
AUD/USD
During the course of Monday's sessions, dollar losses nudged the commodity currency higher. Try as it might though, the H4 candles were unable to muster enough strength to breach the mid-level resistance at 0.7950. A break above this number would likely lead to price challenging the large psychological 0.80 level. This is largely due to there being little to no active supply seen beyond 0.7950. Apart from 0.80 being a watched round number, there are several nearby structures that deserve mention:
The daily Quasimodo resistance level at 0.7988.
A H4 Quasimodo resistance level at 0.8007.
A H4 127.2% Fib ext. point at 0.80 taken from the low 0.7807.
August's opening level at 0.7998.
A H4 Harmonic Gartley reversal point at the 78.6% Fib resistance line drawn from 0.8011.
Suggestions: With weekly price seen trading from a support area coming in at 0.7849-0.7752, and daily action showing room to rally up to the Quasimodo resistance level at 0.7988, a break above 0.7950 is likely.
While the above structures on the H4 timeframe (green sell zone) boast attractive confluence, one must take into account that a fakeout may be seen up to the daily Quasimodo resistance level at 0.8030 sited just above the green zone. Traditionally, when trading Gartley patterns, the stop-loss order should go beyond the X point (0.8065). If you were to follow this, a fakeout up to the daily Quasimodo resistance is not a concern. It is more for the aggressive traders who will likely look to position stops just beyond the green zone. Should you be one of those traders, you may want to consider waiting for the H4 candles to prove seller intent (in the form of either a full, or near-full-bodied candle), before pressing the sell button. This will help avoid a fakeout should it occur.
Data points to consider: No high-impacting events scheduled to be released today.
Levels to watch/live orders:
- Buys: Flat (stop loss: N/A).
- Sells: 0.8011/0.7988 (stop loss: either wait for a H4 bearish candle to form in the shape of a full, or near-full-bodied candle, and place stops above the candle's wick. Another option is to enter at 0.80 and place stops above the H4 Harmonic X point at 0.8067).
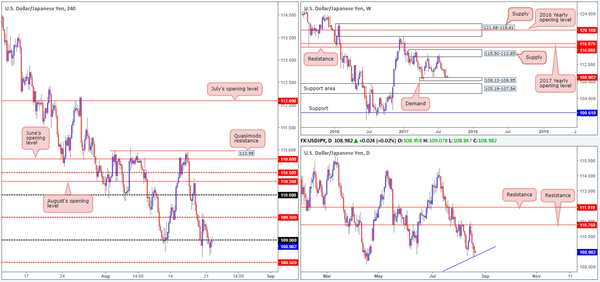
USD/JPY
Despite the pair recording its fourth consecutive bearish close, weekly price remains hovering just above a demand base marked at 108.13-108.95. The same can be said for the daily trendline support etched from the low 100.08.
Having recently seen the H4 candles run through bids at the 109 handle, will a retest of this level (which is happening as we write) be enough to push the unit down to the mid-level support at 108.50? Technically speaking, we would not want to be a seller right now. Yes, the market has been declining in value since striking the daily resistance level at 110.76, but shorting into both weekly demand and a daily trendline support is not something we'd label a high-probability move. In that case, would a buy above the 109 neighborhood be something to consider? A close above 109, followed by a retest and a lower-timeframe buy signal (see the top of this report) would, in our humble opinion, be enough to suggest a long.
Suggestions: Essentially, we're going to be watching for the H4 candles to close above 109 for a potential long opportunity. As far as targets go, the daily resistance at 110.76 is of interest, but it'd be great if we could trail this beauty as far north as the weekly supply coming in at 115.50-113.85.
Data points to consider: No high-impacting events scheduled to be released today.
Levels to watch/live orders:
- Buys: Watch for H4 price to engulf 109 and then look to trade any retest seen thereafter ([waiting for a lower-timeframe buy signal to form following the retest is advised] stop loss: dependent on where one confirms this number).
- Sells: Flat (stop loss: N/A).
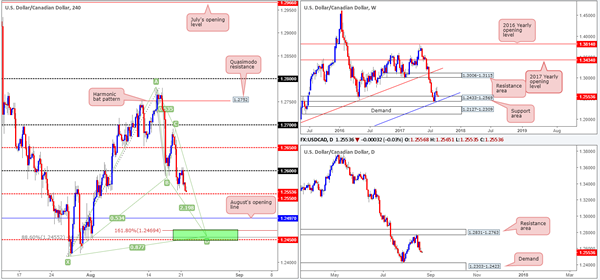
USD/CAD
Following a retest of the 1.26 handle yesterday, the pair spent the London and US sessions declining lower, concluding trade just ahead of the H4 mid-level support at 1.2550. A violation of this level would place August's opening level at 1.2497, followed closely by a H4 Harmonic bat completion point at 1.2455, in the firing range.
Despite the stronger-than-expected rebound seen from the weekly support area given at 1.2433-1.2569 three weeks ago, weekly action recently pulled back and is now retesting the top edge of this zone. Technically speaking, the selloff was likely due to the daily resistance area coming in at 1.2831-1.2763. Should the bears continue to dominate from this zone, the next area on the hit list is the demand penciled in at 1.2303-1.2423 (positioned just below the aforementioned weekly support area).
The H4 Harmonic bat pattern boasts a powerful XA retracement (88.6% Fib retracement at 1.2455) located just ahead of the H4 mid-level support 1.2450. It is also positioned within the noted weekly support area and its converging weekly trendline support taken from the low 0.9633.
Suggestions: In the event that the Harmonic pattern completes, we will be interested buyers here. Additional confirmation, in our opinion, is not required since we can comfortably place stops beyond the X point (1.2413) and still achieve adequate risk/reward.
Data points to consider: Canadian core retail sales figures at 1.30pm GMT+1.
Levels to watch/live orders:
- Buys: 1.2450 (stop loss: 1.2411).
- Sells: Flat (stop loss: N/A).
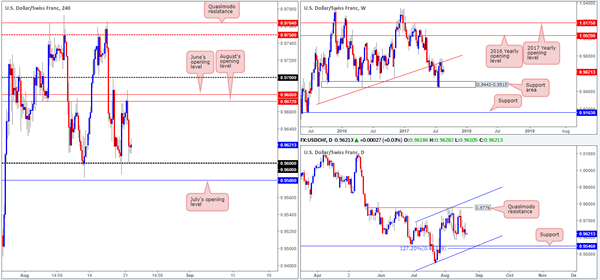
USD/CHF
Kicking this morning's report off with a look at the weekly timeframe, we can see that the trendline resistance extended from the low 0.9257 remains in play. The bearish selling wick recently printed from this line has, in our opinion, firmly placed the weekly support area at 0.9443-0.9515 back on the hit list. Also noteworthy is the daily timeframe. The chart shows room for the pair to trade as far down as support coming in at 0.9546, which happens to unite with a channel support etched from the low 0.9438 and a AB=CD 127.2% Fib ext. at 0.9532. A closer look at price action on the H4 timeframe shows June and August's opening levels at 0.9680/0.9672 held price lower on Monday, consequently forcing price to challenge the 0.96 handle.
Suggestions: Despite both weekly and daily structure indicating further selling could be on the cards, the 0.96 handle and July's opening level at 0.9580 are not levels we'd feel comfortable selling into. Usually, in cases such as this, we would simply wait for these levels to be consumed and then look to trade the retest. However, given the distance between 0.9580 and 0.9546 (the daily support) is only 34 pips, we're unfortunately left with little room to maneuver for a short.
Data points to consider: No high-impacting events scheduled to be released today.
Levels to watch/live orders:
- Buys: Flat (stop loss: N/A).
- Sells: Flat (stop loss: N/A).
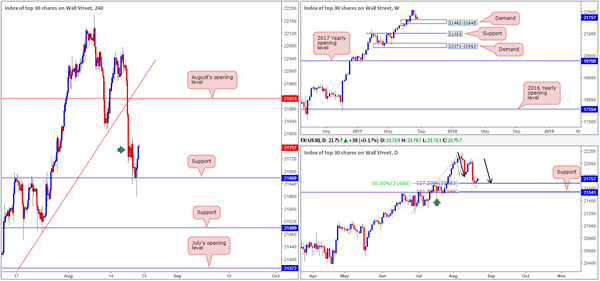
DOW 30
Fresh trading shows weekly price rebounding from a weekly demand base penciled in at 21462-21645. What gives this area extra credibility is the fact that it was formed within an incredibly strong uptrend. A little lower on the curve, we can see that a daily buying tail printed yesterday that pierced through a daily AB=CD (black arrows) 127.2% Fib ext. point at 21683, and a daily 50% support line at 21680 drawn from the low 21192. This, we believe, is going to attract buyers into the market today!
Zooming in for a closer look on the H4 timeframe, support at 21660 remained firm and rallied price higher yesterday. Should the candles manage to clear supply at 21788-21726 marked with a green arrow, the index will likely advance up to August's opening level at 21913.
Our suggestions: We would only trade 21788-21726 should a H4 bull candle present itself in the shape of a full, or near-full-bodied candle following the retest. This is largely due to the possibility that the area may fail as support and force price action back down to the support it originally came from.
Data points to consider: No high-impacting events scheduled to be released today.
Levels to watch/live orders:
- Buys: Watch for H4 price to clear supply at 21788-21726 marked with a green arrow and then look to trade any retest seen thereafter ([waiting for a reasonably sized H4 bullish candle to form following the retest – in the shape of either a full, or near-full-bodied candle – is advised] stop loss: ideally beyond the candle's tail).
- Sells: Flat (stop loss: N/A).
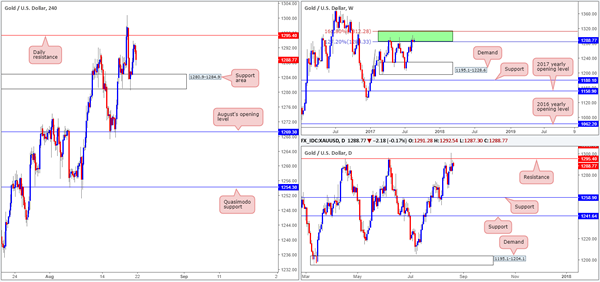
GOLD
From the weekly timeframe, we can see that the bears are struggling to hold ground. Of course, it's far too early to judge just yet since the green weekly resistance area (comprised of two weekly Fibonacci extensions 161.8/127.2% at 1312.2/1284.3 taken from the low 1188.1) has managed to successfully hold the metal lower on two separate occasions in the past.
The story on the daily chart, nevertheless, shows price trading from a resistance level at 1295.4. Apart from the two instances on 17/04/2017 and 06/06/2017, there's little history registered with this number! For that reason, we may see price break above this line and head to the resistance carved from 1308.4 (not seen on the screen), which boasts very attractive history dating back to early 2011.
Bouncing across to the H4 chart, the support area at 1280.9-1284.9 held prices higher yesterday. Therefore, for those who are looking to short based on the weekly and daily structures in play right now, we would advise waiting for the current support area to be engulfed. This would not only confirm seller strength from the higher-timeframe structures, but also open the path south down to August's opening level at 1269.3.
Our suggestions: Based on the above, our desk will not be looking for (medium/long-term) shorts until the daily resistance line plotted at 1308.4 is in play. This is due to the history surrounding this number and its position within the current weekly resistance area (allowing us to place stops tightly above this zone). Regarding intraday opportunities, a close below the current H4 support area is needed before we'd consider becoming sellers in this market.
Levels to watch/live orders:
- Buys: Flat (stop loss: N/A).
- Sells: Flat (stop loss: N/A).
European Open Briefing: Asian Equity Markets Opened In Green On Tuesday
Global Markets:
- Asian stock markets: Nikkei up 0.08 %, Shanghai Composite rose 0.13 %, Hang Seng up 0.94 %, ASX 200 climbed 0.37 %
- Commodities: Gold at $1293.86 (-0.21 %), Silver at $16.97 (-0.22 %), WTI Oil at $47.70 (+0.36 %), Brent Oil at $51.83 (+0.33 %)
- Rates: US 10-year yield at 2.19, UK 10-year yield at 1.07, German 10-year yield at 0.39
News & Data:
- CAD Wholesale Sales m/m -0.5% vs 0.6% expected
- U.S. workers have low hopes for higher pay: Fed survey- RTRS
- Oil prices edge up on signs of gradually tightening market- RTRS
Markets Update:
Asian equity markets opened in green on Tuesday as investors reassessed positions ahead of a meeting of central bankers, including Federal Reserve Chairwoman Janet Yellen and European Central Bank President Mario Draghi, in Jackson Hole later this week.
AUDUSD was little changed during Asian session today and was last seen trading at 79.38 U.S Cents. During the course of Monday’s sessions, dollar losses had nudged the commodity currency higher, price had rised towards 0.7950 but has since given back all of its gain.
EURUSD continued to trade in a small range on Tuesday, trying to test 1.1820 and then slipping back to under 1.1810. The EURO is currently seen trading at $1.1805 after climbing 0.5 percent in the previous session as the US dollar decline on Monday against the majority of its trading peers
USDJPY erased Monday’s loss as it started moving higher during Tokyo morning. The yen lost over 0.3 percent against the US dollar reaching highs of 109.33. There are reported stop loss buyers clustered above 109.50, something to be aware of should we approach there.
Upcoming Events:
- 08:30 GMT – (GBP) Public Sector Net Borrowing
- 09:00 GMT – (EUR)German ZEW Economic Sentiment
- 12:30 GMT – (CAD) Core Retail Sales m/m
- 12:30 GMT – (CAD) Retail Sales m/m
Aussie Dollar Trading Flat In The Asian Session
For the 24 hours to 23:00 GMT, the AUD rose 0.06% against the USD and closed at 0.7937.
LME Copper prices rose 1.0% or $62.5/MT to $6514.5/MT. Aluminium prices declined 0.9% or $19.5/MT to $2084.5/MT.
In the Asian session, at GMT0300, the pair is trading at 0.7937, with the AUD trading flat against the USD from yesterday’s close.
The pair is expected to find support at 0.7915, and a fall through could take it to the next support level of 0.7893. The pair is expected to find its first resistance at 0.7955, and a rise through could take it to the next resistance level of 0.7973.
The currency pair is showing convergence with its 20 Hr moving average and trading above its 50 Hr moving average.

German Economic Growth Could Top Expectations This Year: Bundesbank
For the 24 hours to 23:00 GMT, the EUR rose 0.42% against the USD and closed at 1.1809.
Yesterday, the Bundesbank, in its monthly report, stated that German economic growth will likely expand at a faster clip in the current quarter, aided by robust performance in the industrial sector, upbeat sentiment among consumers and a significant rise in exports. The central bank further added that the outlook for consumers remains healthy, citing a strong labour market and positive income growth.
Macroeconomic data released in the US indicated that the Chicago Fed national activity index fell to a level of -0.01 in July, compared to market consensus for a drop to a level of 0.10. The index had recorded a revised level of 0.16 in the prior month.
In the Asian session, at GMT0300, the pair is trading at 1.1806, with the EUR trading a tad lower against the USD from yesterday’s close.
The pair is expected to find support at 1.1749, and a fall through could take it to the next support level of 1.1691. The pair is expected to find its first resistance at 1.1846, and a rise through could take it to the next resistance level of 1.1885.
Moving ahead, investors will look forward to the ZEW economic sentiment data for August across the Eurozone, slated to release in a few hours. Additionally, the US house price index for June, due to release later in the day, will be on investors’ radar.
The currency pair is trading above its 20 Hr and 50 Hr moving averages.
