
Sample Category Title
Data Back In Focus As Markets Look For Direction
After a quiet start to the week, economic data are back in focus on Tuesday, with key reports from both sides of the Atlantic.
Switzerland gets the ball rolling at 06:00 GMT with a monthly report on trade. The country's trade surplus is forecast to expand modestly in July, according to a median estimate.
Later in the morning, UK National Statistics will report on public sector net borrowing for the month of July. Net borrowing is projected to grow by less than half a billion pounds, after climbing by £6.3 billion in June.
The Centre for European Economic Research (ZEW) will release its monthly survey on German investor sentiment at 09:00 GMT. The Current Situation index is forecast to drop slightly to 85.5 in August from 86.4 the previous month. The Economic Sentiment index is also projected to drop to 15.0 from 17.5. ZEW's broader euro area Economic Sentiment indicator is expected to slide 1.4 points to 34.2.
The North American session begins with Canadian retail sales at 12:30 GMT. Receipts at retail stores climbed 0.3% in June, according to a median estimate of economists. However, all the gains are expected to come from automobile sales.
In the United States, the Federal Housing Finance Agency (FHFA) will release the Housing Price Index (HPI) at 13:00 GMT. The report provides an estimated value of housing market conditions across key metropolitan regions. The HPI is projected to climb 0.4%.
One hour later, the Federal Reserve Bank of Richmond will release its monthly manufacturing index for August. The gauge likely fall by two points for a reading of 12, based on the consensus view.
EUR/USD
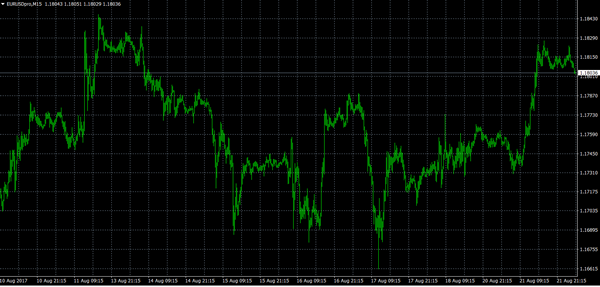
The euro broke higher on Monday, with the EUR/USD retaking 1.1800. The pair has eclipsed a key technical hurdle around 1.1790, possibly opening the door for further upside. Immediate resistance is now seen at 1.1860. On the opposite side of the ledger, dips toward 1.1690 offer strong support.
USD/CAD
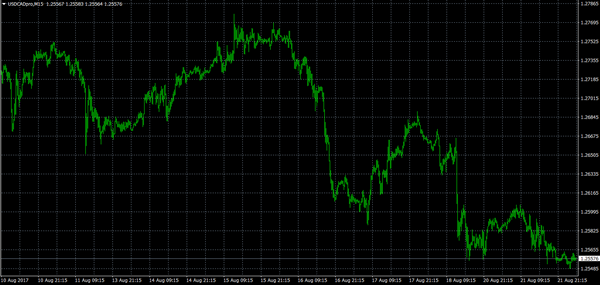
The US dollar has backpedalled in recent sessions, driving the value of the USD/CAD sharply lower. The pair was last seen trading around 1.2560, where it is down roughly 200 pips from last week's high. The Canadian dollar has a solid long-term trajectory, supported by stronger economic growth and a more hawkish central bank. The Bank of Canada (BOC) is widely expected to raise interest rates again this year.
GOLD
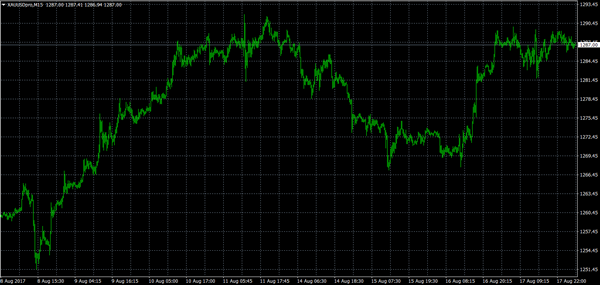
Haven demand continued strong on Monday, with gold prices once again approaching $1,300.00. The yellow metal briefly eclipsed that milestone last week for the first time since December. The daily chart shows strong buy positions for bullion, with relative strength and the MACD in bullish territory. The short-term outlook will largely depend on underlying risk sentiment in the broader market.
USDJPY Intraday Analysis
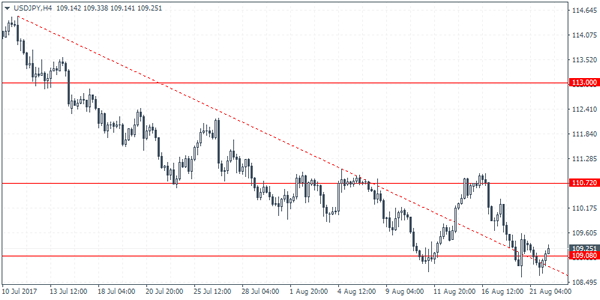
USDJPY (109.25): The USDJPY was seen slipped back with price action briefly falling to a 4-month low over the past two days. The daily chart shows an inside bar formation as a result, and a breakout from this level could establish the short term direction in the currency pair. Although USDJPY slipped below 109.08, the price has managed to rebound back above this level. This could potentially suggest some upside in price. Previous resistance at 110.72 remains the upside target, although the potential for a continued decline cannot be ruled out.
GBPUSD Intraday Analysis
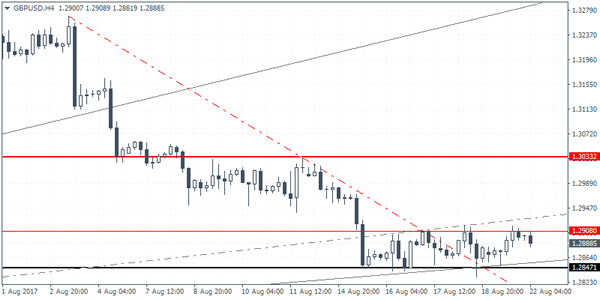
GBPUSD (1.2888): The British pound was seen trading subdued with price action trading flat for nearly four days after the price fell to 1.2847. A near-term upside is quite likely, however, with GBPUSD likely to test 1.3000 resistance level. On the 4-hour chart, we can see the short-term range at 1.2908 and 1.2847. A breakout from this level is required for GBPUSD to establish the near-term direction. The bias points to the upside given that the support level at 1.2847 has held up so far. However, in the event of a break down below this level, we could expect to see further declines in the short term.
EURUSD Intraday Analysis
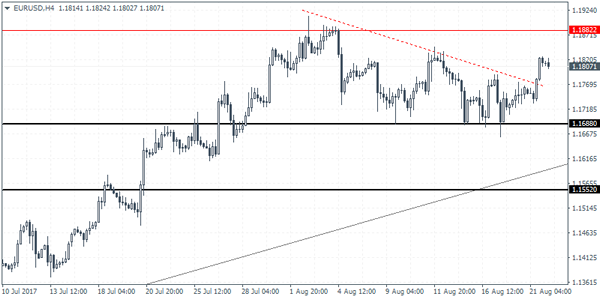
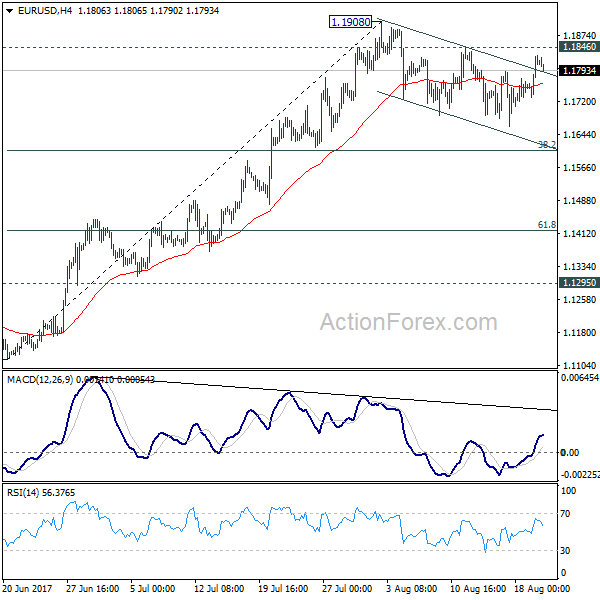
EURUSD (1.1807): The EURUSD posted gains yesterday as the common currency rallied back above the price of 1.1800. The modest gains put the EURUSD back into the range of 1.1880 and 1.1800. This comes after price rebounded to the upside following the test of support at 1.1688. The upside breakout from the descending triangle puts the target for EURUSD towards 1.1882 which marks the previous resistance level. Any near-term dips in price could see a retest of the breakout level. This bullish bias will change only on a breakdown below the support at 1.1688. Below this support level, the next downside target for the EURUSD will be 1.1552.
US Dollar Remains Weak, But Trades Flat
The US dollar gave up the gains with price action trading rather subdued. Lack of any clear market movers and the upcoming Jackson Hole Symposium saw traders taking a breather.
Economic data yesterday was quiet with no major releases. The German Bundesbank released its monthly forecasts where it remained upbeat on the German economy. In Canada, the wholesale sales fell 0.5%, falling well below estimates of 0.6% and after rising 1% in the previous month.
Looking ahead, Canada's retail sales numbers are expected today. Estimates point to a 0.2% increase in retail sales on the month following a 0.6% increase in the previous month. Core retail sales are however expected to remain flat on the month after declining 0.1% previously. In the US, the Richmond Fed manufacturing index is also due later today. Forecasts expect the index to slip to 11 after rising to 14 previously.
EUR/CHF Bounced Back
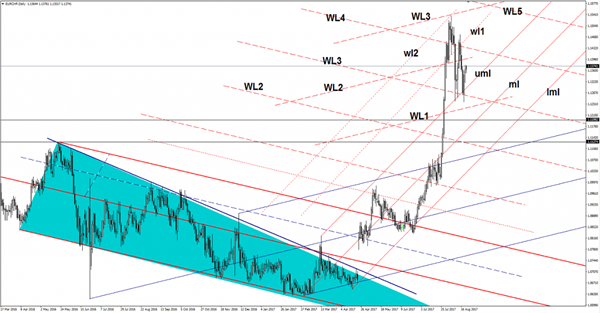
EUR/CHF was rejected by the upper median line (uml) of the minor ascending pitchfork and by the WL3 of the major descending pitchfork. Is almost to reach the first upside target from the WL2, where he may find resistance again. We have an important target also at the WL4, is hard to believe that will take this out at this moment.
EUR/JPY Is The Retreat Completed
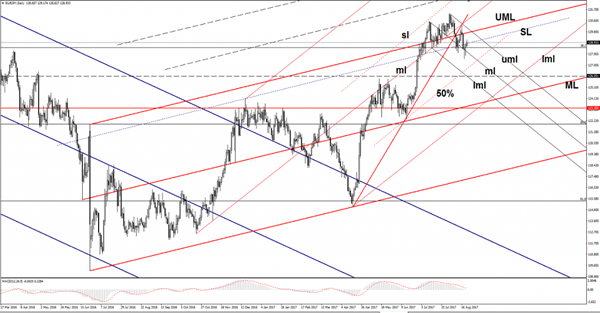
Price has found strong support right below the median line (ml) of the minor descending pitchfork and now has come back to retest some resistance levels. Right now is pressuring the inside sliding line (SL), could come to retest also the upper median line (UML) of the major ascending pitchfork. Actually, it could be attracted by the confluence area formed at the intersection between the UML with the upper median line (uml) of the minor descending pitchfork. The outlook is bearish as long as is trading within the descending pitchfork’s body.
EUR/USD Daily Outlook
Daily Pivots: (S1) 1.1753; (P) 1.1790 (R1) 1.1851; More...
While EUR/USD recovered, it's limited below 1.1846 minor resistance so far. Intraday bias remains neutral as consolidation from 1.1908 might extend. In case of another fall, downside should be contained by 38.2% retracement of 1.1119 to 1.1908 at 1.1606 to bring up trend resumption. Break f 1.1846 minor resistance will argue that larger rise from 1.0339 is resuming for 1.2042 long term support turned resistance next.
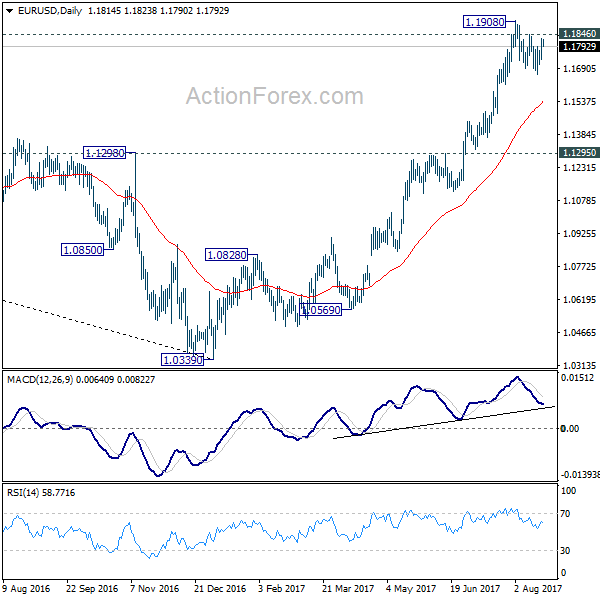
In the bigger picture, an important bottom was formed at 1.0339 on bullish convergence condition in weekly MACD. Sustained trading above 55 month EMA (now at 1.1768) will pave the way to key fibonacci level at 38.2% retracement of 1.6039 (2008 high) to 1.0339 (2017 low) at 1.2516. While rise from 1.0339 is strong, there is no confirmation that it's developing into a long term up trend yet. Hence, we'll be cautious on strong resistance from 1.2516 to limit upside. But for now, medium term outlook will remain bullish as long as 1.1295 support holds, in case of pull back.
AUD/USD Seems Exhausted
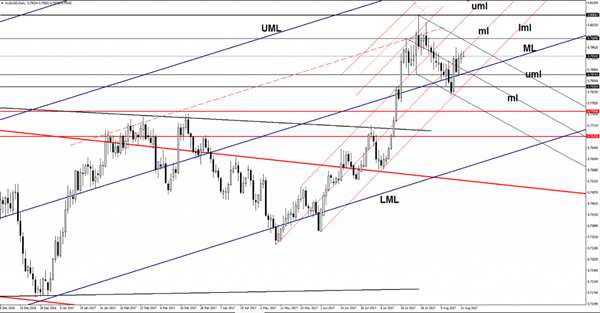
Price is trading below the 0.7950 psychological level and looks a little overbought on the short term. Has retested a dynamic resistance and now could decrease if the dollar index will stay above the 92.94 previous low.
AUD/USD is still trading in the green on the short term, it maintains a bullish perspective as long as is located above a major dynamic support. Price is signaling an exhaustion and could come down to retest a support before will try to climb much higher.
Price is driven by the technical factors as we have a poor economic calendar. Technically could slip lower on the short term if will fail to close above the 0.7962 previous high. Right now is very important to see what will happen on the USDX, which is under bearish pressure on the Daily chart.
It is pressuring the median line (ml) of the minor ascending pitchfork, a failure to close above stabilize above will send the rate tumbling on the short term. The rebound towards the median line (ml) was expected after the failure to retest the lower median line (lml), but the false breakout above it shows an overbought.
Could come down to retest the median line (ML) of the major ascending pitchfork and the lower median line (lml). The perspective will remain bullish as long as is trading above these levels, but a valid breakdown will confirm a major drop.
EUR/USD Stays in Consolidation as Markets Lack Direction
The forex markets are lacking clear direction so far this week. It feels there is a lack of interest among traders ahead of Jackson Hole symposium. Euro attempted to resume recent rally against Dollar. While EUR/USD takes out a near term channel resistance, it's staying below 1.1846 resistance. Thus, the consolidation from 1.1908 is likely still in progress. GBP/USD and USD/JPY are also staying in very tight range. Canadian dollar strengthens with very weak momentum but USD/CAD is still in progress for deeper decline. The economic calendar is relatively light today but Canadian retail sales could trigger firmer momentum in USD/CAD.
Trump revealed Afghanistan strategy, Mnuchin urge to raise debt ceiling
US President Donald Trump revealed his Afghanistan strategy and said "a core pillar of our new strategy is a shift from a time-based approach to one based on conditions." But there are criticisms that Trump's new strategy was essentially the same as his predecessors, which failed to get the US our of that war. At the same time Treasury Secretary Mnuchin indicated that the Congress has to lift the ceiling by the end of September in a "clean" debt-ceiling increase. This was echoed by Senate Majority Leader Mitch McConnell who noted that there is a "zero chance" the US government fails to raise the ceiling. Mnuchin has been urging to lift the debt ceiling before leaving Washington for the August recess. Indeed, the Treasury has been using "extraordinary measures" since this spring to avoid breaching the debt ceiling but the trick cannot be used indefinitely due to weaker tax collection.
Japan businesses not keen on additional BoJ easing
According to a survey of 548 firms conducted for Reuters Nikkei Research, businesses in Japan were not too optimistic that BoJ could hit the 2% inflation target. Yet, they are not keen on having additional easing from the central bank. The results showed that 31% of respondents believed it's "impossible" for BoJ to achieve the inflation target. 37% believed that BoJ could hit it after three years. 46% said that BoJ's future policy direction should be standing pat. 40% said BoJ should seek exit from monetary easing. And only 14% believed that BoJ should adopt further monetary easing. Inflation expectation was also quite clear with 75% said they don't play to raise prices of their main goods and services.
ECB to hit 33% bond purchase ceiling soon
A report by Financial Times revealed that the ECB is about to break its self-imposed limit of owning 33% of a country's government debt, leading the central bank to taper no matter how well (or bad) inflation goes. It is projected that the limits for German, Portuguese and Irish debts could be breached as early as in February. At the same time, it's believed to be unlikely for ECB to raise the ceiling considering continuous legal challenges from Germany. President Mario Draghi's speech at the Jackson Hole symposium this Thursday is closely awaited. He would likely discuss about the Eurozone's economic outlook and hinted about the central bank's policy stance.
On the data front
Swiss trade surplus widened to CHF 3.51b in July. German ZEW economic sentiment is the main feature in European session. UK will release public sector net borrowing. Canada retail sales will be a major focus in US session. US will release house price index.
EUR/USD Daily Outlook
Daily Pivots: (S1) 1.1753; (P) 1.1790 (R1) 1.1851; More...
While EUR/USD recovered, it's limited below 1.1846 minor resistance so far. Intraday bias remains neutral as consolidation from 1.1908 might extend. In case of another fall, downside should be contained by 38.2% retracement of 1.1119 to 1.1908 at 1.1606 to bring up trend resumption. Break f 1.1846 minor resistance will argue that larger rise from 1.0339 is resuming for 1.2042 long term support turned resistance next.
In the bigger picture, an important bottom was formed at 1.0339 on bullish convergence condition in weekly MACD. Sustained trading above 55 month EMA (now at 1.1768) will pave the way to key fibonacci level at 38.2% retracement of 1.6039 (2008 high) to 1.0339 (2017 low) at 1.2516. While rise from 1.0339 is strong, there is no confirmation that it's developing into a long term up trend yet. Hence, we'll be cautious on strong resistance from 1.2516 to limit upside. But for now, medium term outlook will remain bullish as long as 1.1295 support holds, in case of pull back.
Economic Indicators Update
| GMT | Ccy | Events | Actual | Forecast | Previous | Revised |
|---|---|---|---|---|---|---|
| 06:00 | CHF | Trade Balance (CHF) Jul | 2.88B | 2.81B | ||
| 08:30 | GBP | Public Sector Net Borrowing (GBP) Jul | 0.3B | 6.3B | ||
| 09:00 | EUR | German ZEW (Economic Sentiment) Aug | 15 | 17.5 | ||
| 09:00 | EUR | German ZEW (Current Situation) Aug | 85.5 | 86.4 | ||
| 09:00 | EUR | Eurozone ZEW (Economic Sentiment) Aug | 34.2 | 35.6 | ||
| 10:00 | GBP | CBI Trends Total Orders Aug | 10 | 10 | ||
| 12:30 | CAD | Retail Sales M/M Jun | 0.30% | 0.60% | ||
| 12:30 | CAD | Retail Sales Less Autos M/M Jun | 0.30% | -0.10% | ||
| 13:00 | USD | House Price Index M/M Jun | 0.50% | 0.40% |