Sample Category Title
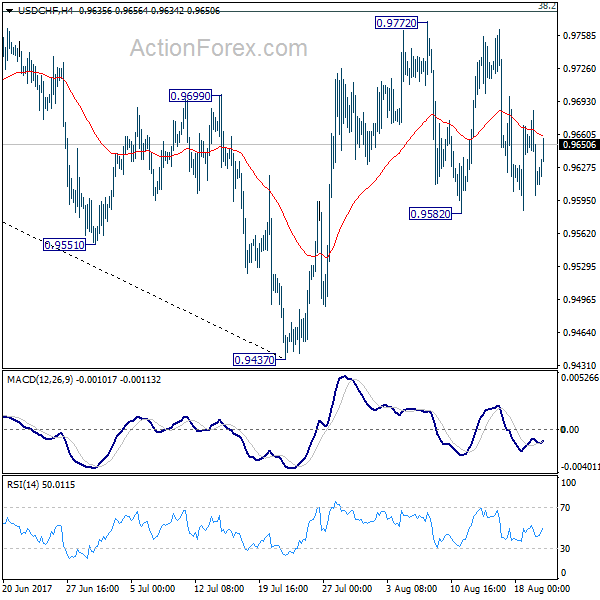
US Dollar Downsides Limited By 0.9600 Vs Swiss Franc
Key Highlights
- The US Dollar is trading in a major range with resistance near 0.9765 and support at 0.9600 against the Swiss Franc.
- There is a crucial bullish trend line with support at 0.9600 forming on the 4-hours chart of USD/CHF.
- Swiss Trade Balance for July 2017 posted a trade surplus of 3511M, better than the last 2,880M.
- Today, the Housing Price Index for July 2017 will be released, which is forecasted to increase by 0.4% (MoM).
USD/CHF Technical Analysis
The US Dollar seems to be trading in a major range with us d and support at 0.9600 against the Swiss Franc. The USD/CHF pair downsides are limited and supported by 0.9600.
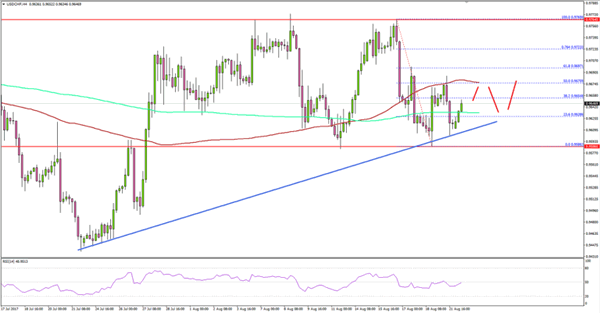
Looking at the 4-hours chart, there is a crucial bullish trend line forming with support at 0.9600. The pair recently tested the trend line at 0.9601 and retreated higher.
On the upside, the most important resistance is near 0.9675, which is near the 100 simple moving average (H4). It also represents the 50% Fib retracement level of the last decline from the 0.9765 high to 0.9586 low.
The pair was already rejected once from 0.9675 and there are chances of USD/CHF retesting it in the near term. In a broader perspective, the pair remains in a long-term range of 0.9765-0.9600. Having said that, downsides are limited by 0.9600, and possibilities of USD/CHF trading higher are high.
Swiss Trade Balance
Today in Switzerland, the Trade Balance report for July 2017 was released by the Federal Customs Administration. The market was looking for a trade surplus of 2,880M compared with the last surplus 2764M.
The actual result was better, as there was a trade surplus of 3511M. Exports of goods and services in July 2017 were 18347M, less than the last revised 18799M. Imports of goods and services in July 2017 were 14836M, less than the last revised 16035M.
The result was mostly neutral, and could weigh on the Swiss Franc. The USD/CHF might trade towards 0.9675 where buyers will be tested. The H4 RSI needs to clear the 50 level to gain momentum and set the pace for USD/CHF towards 0.9675.
On the downside, the 0.9620 and 0.9600 are important support levels.
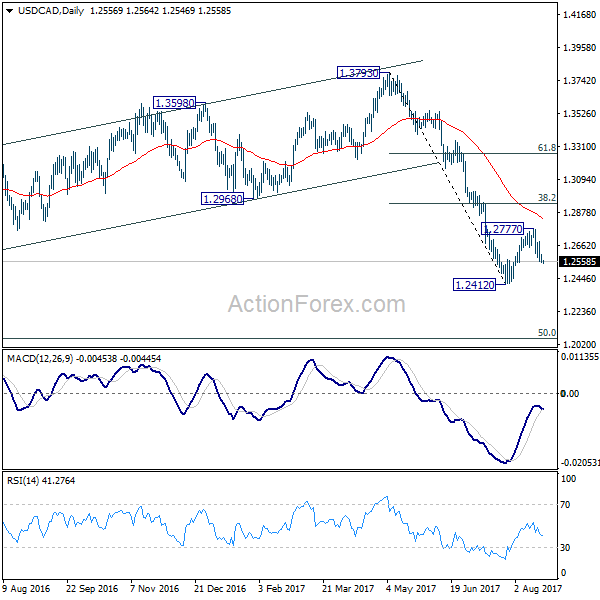
USD/CAD Daily Outlook
Daily Pivots: (S1) 1.2538; (P) 1.2572; (R1) 1.2591; More....
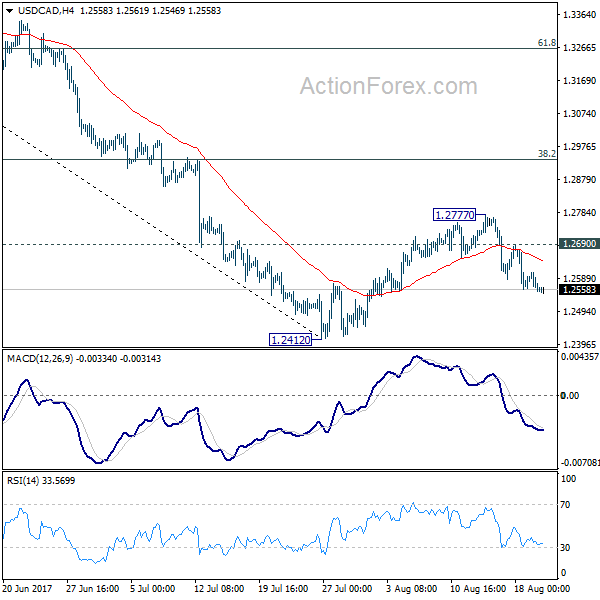
Intraday bias in USD/CAD remains on the downside as fall from 1.2777 is in progress for retesting 1.2412 low. Break there will resume the larger decline and target next long term fibonacci level at 1.2048. On the upside, above 1.2690 will extend the correction from 1.2412 with another rise. But we'd expect upside to be limited by 38.2% retracement of 1.3793 to 1.2412 at 1.2940 to bring fall resumption eventually.
In the bigger picture, price actions from 1.4689 medium term top are seen as a correction pattern. Such corrective fall is still expected to extend to 50% retracement of 0.9406 to 1.4869 at 1.2048. At this point, we'd look for strong support from there to contain downside and bring rebound. Nonetheless, on the upside, sustained break of 1.2968, 38.2% retracement of 1.3793 to 1.2412 at 1.2940 will be the first sign of completion of the correction and will turn focus back to 1.3793 key resistance.
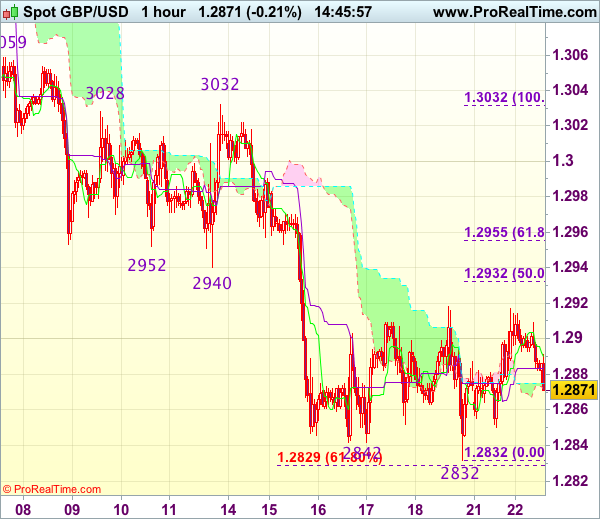
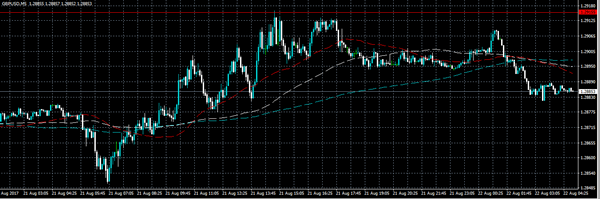
Trade Idea : GBP/USD – Stand aside
GBP/USD - 1.2868
Most recent candlesticks pattern : N/A
Trend : Near term down
Tenkan-Sen level : 1.2887
Kijun-Sen level : 1.2884
Ichimoku cloud top : 1.2875
Ichimoku cloud bottom : 1.2872
New strategy :
Stand aside
Position : -
Target : -
Stop : -
As cable has retreated after faltering below resistance at 1.2918, retest of last week’s low at 1.2832 cannot be ruled out, however, break there is needed to revive bearishness and signal recent decline has resumed and extend weakness to 1.2800 and possibly towards 1.2770 but near term oversold condition should limit downside to 1.2750, bring another rebound later.
On the upside, above 1.2900 would bring another test of 1.2918, then 1.2932-33 (50% Fibonacci retracement of 1.3032-1.2832 and previous support) but above there is needed to signal a temporary low has possibly been formed, bring a stronger rebound to 1.2955-60 (61.8% Fibonacci retracement) and later towards 1.2990-00. As near term outlook is mixed, would be prudent to stand aside in the meantime.
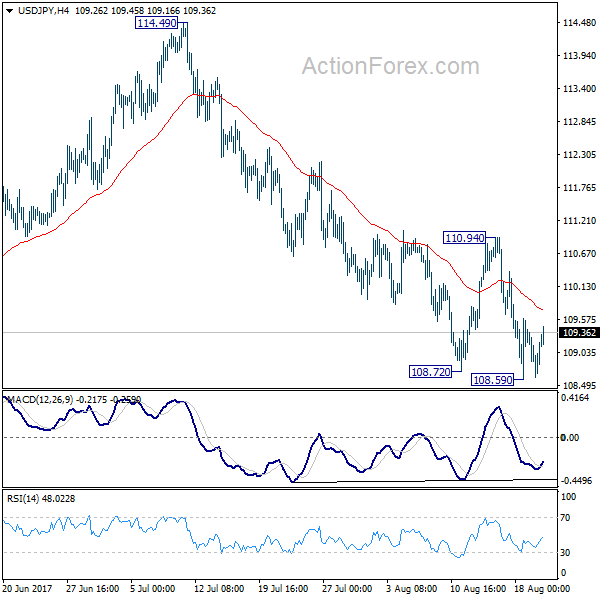
USD/JPY Daily Outlook
Daily Pivots: (S1) 108.59; (P) 109.00; (R1) 109.38; More...
Intraday bias in USD/JPY is turned neutral with another temporary low formed at 108.59. But overall, outlook stays bearish as long as 110.94 resistance holds. Below 108.59 will target a test on 108.12 low. Whole corrective decline from 118.65 is possibly resuming and break of 108.12 will target 61.8% retracement of 98.97 to 118.65 at 106.48.
In the bigger picture, the corrective structure of the fall from 118.65 suggests that rise from 98.97 is not completed yet. Break of 118.65 will target a test on 125.85 high. At this point, it's uncertain whether rise from 98.97 is resuming the long term up trend from 75.56, or it's a leg in the consolidation from 125.85. Hence, we'll be cautious on topping as it approaches 125.85. If fall from 118.65 extends lower, downside should be contained by 61.8% retracement of 98.97 to 118.65 at 106.48 and bring rebound.
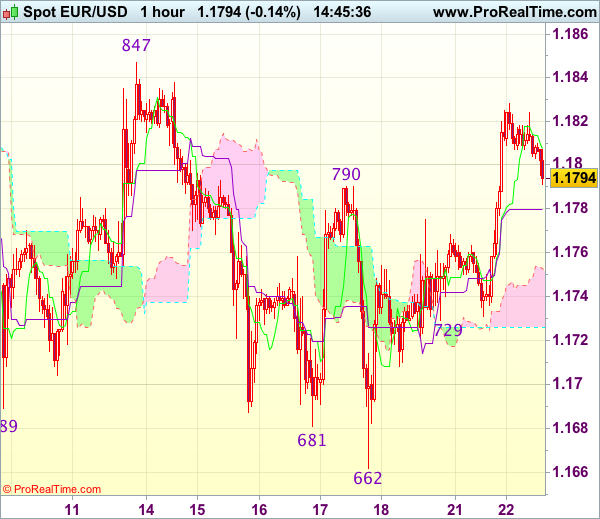
EURUSD Bullish Above 1.1790
The EURUSD pair has softened towards the 1.1800 level, after moving to 1.1828 during the U.S session on Monday. The euro remains technically bullish whilst trading above the downward slopping channel-top, found at 1.1790.
During the European session, we see the release of the German and eurozone ZEW sentiment survey's, and a key speech from European Central Bank Vice-President Vitor Constancio.
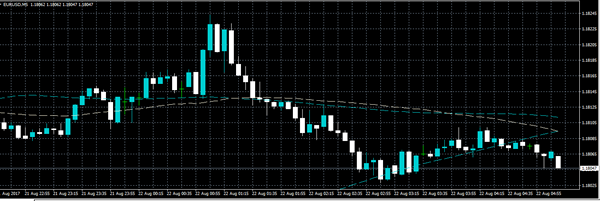
The EURUSD pair remains bullish on all-time frames, with price action now trading firmly above the 200-week moving average, found at the key 1.1783 level.
To the upside, key technical resistance is found at 1.1815, and the current weekly price high, at 1.1828. The weekly swing high adds further resistance, at 1.1847, with longer-term resistance at the crucial 1.1900 level.
To the downside, critical intraday EURUSD support is found at the 1.1790 level. The 200-hour moving average comes in at 1.1770, with the 50-hour moving average adding further support, at 1.1755.
GBPUSD Bearish Below 1.2915
The GBPUSD pair has softened below the 1.2900 level, as British pound buyers struggled to maintain bullish trading momentum above the key 1.2915 resistance level.
So far sterling has fallen towards the trendline support, at 1.2880, after finding intraday resistance from the pairs weekly pivot point, at 1.2910.
Going forward, the GBPUSD pair is likely to remain range-bound between the 1.2830 to 1.2915 trading band, until a clear trading catalyst emerges.
Key technical support is found at the GBPUSD daily pivot point, at 1.2887, the current weekly low offers further support, at 1.2850, whilst 1.2830 acts as critical support.
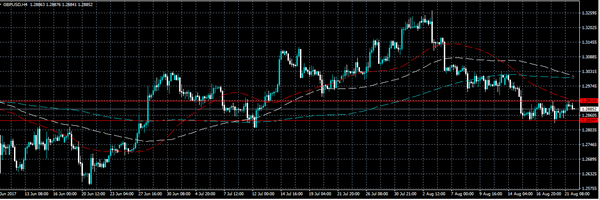
To the upside, the 1.2900 level is strong intraday resistance, while the 1.2915 level acts as key break-out resistance. Once above the 1.2915 level, the 1.2932 and 1.2950 levels come into focus.
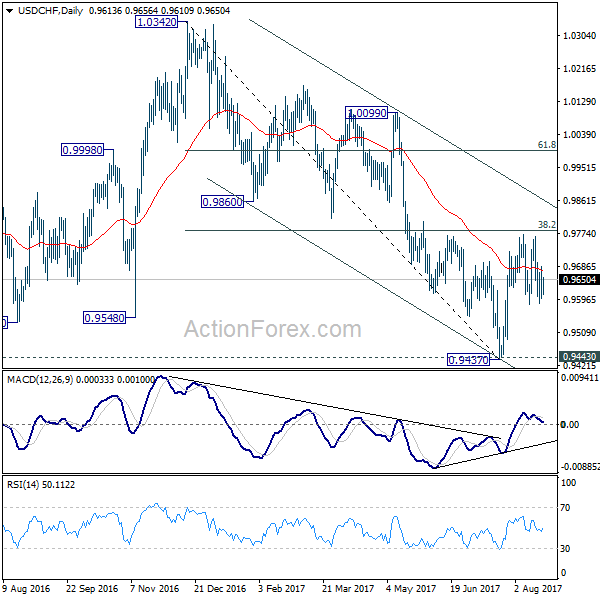
USD/CHF Daily Outlook
Daily Pivots: (S1) 0.9584; (P) 0.9634; (R1) 0.9669; More...
USD/CHF is staying in range of 0.9582/9772 and intraday bias remains neutral. On the upside, decisive break of 0.9772 resistance will revive the bullish case of reversal. That is, whole decline from 1.0342 has completed at 0.9437 after defending 0.9443 support. USD/CHF should then target channel resistance (now at 0.9862) next. Meanwhile, the pair is bounded inside medium term falling channel and limited below 38.2% retracement of 1.0342 to 0.9437 at 0.9783 for the moment. Break of 0.9582 will turn bias back to the downside for 0.9437. This could also extend the fall from 1.0342 through 0.9437/43 key support level.
In the bigger picture, we're slightly favoring the case that USD/CHF has successfully defended 0.9443 key support level. And long term range trading in 0.9443/1.0342 is extending with another rise. At this point, there is no sign of an up trend yet. Hence, while further rise is expected in USD/CHF, we'll start to be cautious on loss of momentum above 61.8% retracement of 1.0342 to 0.9437 at 0.9996. However, firm break of 0.9443 will carry larger bearish implication and would target next key support at 0.9072.
North Korea Warns That The US Risks Starting An ‘Uncontrollable Phase Of Nuclear War’
With the start of US/South Korea War Games tensions have returned between North Korea and the US. North Korea's official propaganda newspaper accused the US of 'reckless behavior', saying it is 'driving the situation into the uncontrollable phase of war'. An editorial said: 'The joint exercise is the most explicit expression of hostility against us, and no one can guarantee that the exercise won't evolve into actual fighting'. The markets are expecting more rhetoric from both Kim Jong-un and Trump. On Monday, the German Bundesbank commented that the German economy is expected to continue its strong growth trend in the current quarter on the back of industrial exports. The comments followed official data released last week showing the German economy grew by 0.6% in quarterly terms, or 2.5% in annualized terms, in Q2, following annualized growth of 2.9% in Q1. These comments helped push EURUSD 0.5% higher on the day to 1.18247. The markets are predominantly focused on the Jackson Hole summit, that starts on Thursday, for clues as to how Central Banks, in many advanced economies, will scale back monetary easing amidst poor inflationary pressures. The markets are keen to hear Fed Chair Yellen comments; as the US suffers from stubbornly low inflation and the expected timeframe, of the Fed reducing its massive balance sheet.
EURUSD is little changed overnight currently trading around 1.1805
USDJPY is up 0.25% in early trading and currently trades around 109.25
GBPUSD is relatively flat on the day currently trading around 1.2890
Gold is down 0.3% in early trading. It currently trades around $1,287.75
WTI has gained 0.5% on Tuesday to currently trade around $47.85pb
At 09:30 BST UK National Statistics will release Public Sector Net Borrowing for July. The previous release of £6.278B was distorted due to an amended EU budget contribution in June but markets are not expecting anything but further increases as the UK economy is, regarded by many, faltering as the Brexit process moves forward.
At 10:00 BST the ZEW Survey (Zentrum für Europäische Wirtschaftsforschung) releases Economic Sentiment for the Eurozone for August. As a sentiment index the results are somewhat subjective but markets are expecting euro-area growth to have slowed in the Q3.
At 14:00 BST the US Federal Housing Finance Agency will release the Housing Price Index for June. Consensus calls for an unchanged 0.4% from the previous reading. Markets will be looking for a positive reading confirming a solid US economy.
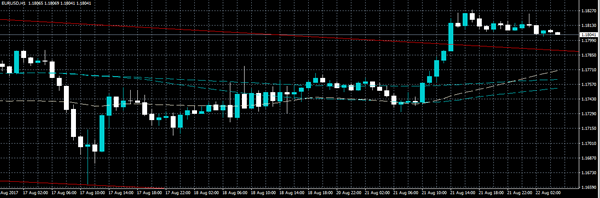
Trade Idea : EUR/USD – Buy at 1.1765
EUR/USD - 1.1788
Most recent candlesticks pattern : N/A
Trend : Sideways
Tenkan-Sen level : 1.1806
Kijun-Sen level : 1.1780
Ichimoku cloud top : 1.1751
Ichimoku cloud bottom : 1.1726
Original strategy :
Buy at 1.1770, Target: 1.1870, Stop: 1.1735
Position : -
Target : -
Stop : -
New strategy :
Buy at 1.1765, Target: 1.1865, Stop: 1.1730
Position : -
Target : -
Stop : -
As the single currency has retreated after meeting resistance at 1.1828 yesterday, suggesting consolidation below this level would be seen initially and pullback to 1.1765-70 cannot be ruled out, however, reckon the upper Kumo (now at 1.1751) would contain downside and bring another rise later, above said resistance at 1.1828 would extend the rise from last week’s low of 1.1662 to resistance at 1.1847, break there would provide confirmation the pullback from 1.1910 has ended and encourage for headway to 1.1870-80 but reckon said resistance at 1.1910 would hold from here.
In view of this, would not chase this rise here and would be prudent to buy euro again on pullback as 1.1760-70 should limit downside. Only below 1.1725-30 would abort and suggest the rebound from 1.1662 has ended instead, risk weakness to 1.1695-00 first.
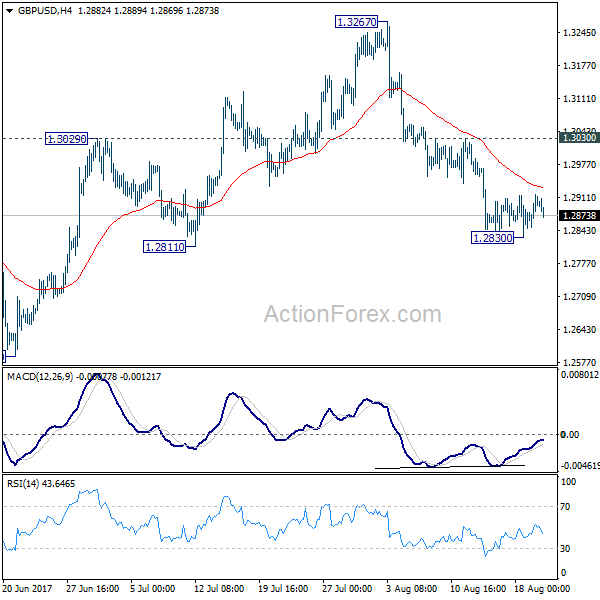
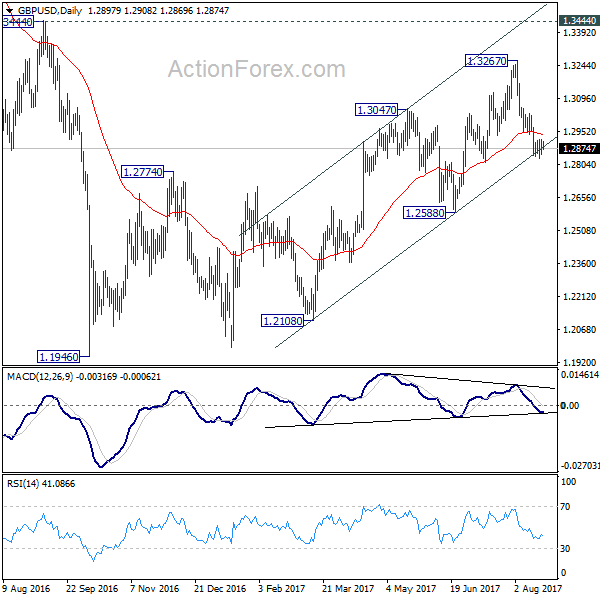
GBP/USD Daily Outlook
Daily Pivots: (S1) 1.2859; (P) 1.2887; (R1) 1.2925; More...
A temporary low is in place at 1.2830 and intraday bias in GBP/USD is turned neutral first. Some consolidation could be seen but upside should be limited by 1.3030 resistance to bring fall resumption. As noted before, we're favoring the case that correction from 1.1946 is completed at 1.3267. Below 1.2830 will target 1.2588 key near term support. Decisive break of 1.2588 will confirm our view and target a test on 1.1946 low.
In the bigger picture, overall, price actions from 1.1946 medium term low are seen as a corrective pattern. While further rise cannot be ruled out, larger outlook remains bearish as long as 1.3444 key resistance holds. Down trend from 1.7190 (2014 high) is expected to resume later after the correction completes. And break of 1.2588 will indicate that such down trend is resuming.