Sample Category Title
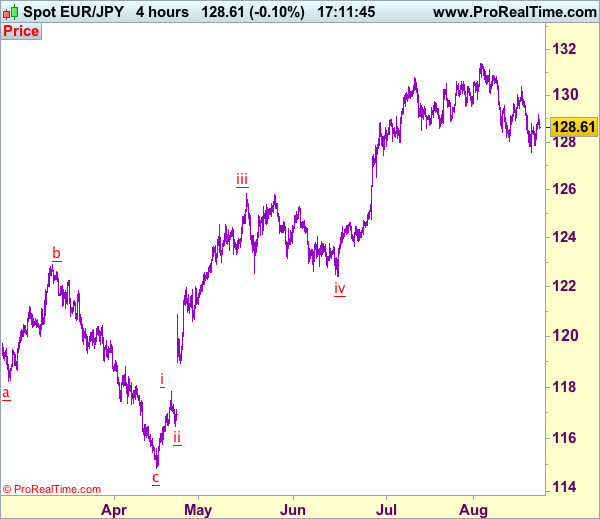
Trade Idea: EUR/JPY – Stand aside
EUR/JPY - 128.54
Recent wave: A 5-waver is unfolding from 114.85 with wave iii and iv ended at 125.82 and 122.40 respectively, wave v has possibly ended at 131.40.
Trend: Near term up
New strategy :
Stand aside
Position: -
Target: -
Stop:-
Although the single currency rebounded again to 129.18, lack of follow through buying and current retreat suggest consolidation would be seen and weakness to 128.10-15 cannot be ruled out, however, break of support at 127.84 is needed to signal the rebound from 127.56 (last week’s low) has ended, bring retest of this level, break there would signal the fall from 131.40 top is still in progress for retracement of early upmove to 127.00, then towards 126.50-60.
On the upside, whilst recovery to 129.00 cannot be ruled out, break of said resistance at 129.18 is needed to signal low has been formed at 127.56, bring a stronger rebound to 129.50-60 and possibly towards 130.00. Looking ahead, only break of indicated resistance at 130.40 would revive bullishness and signal the fall from 131.40 has ended, then gain to 130.90-00 would follow. As near term outlook is mixed, would be prudent to stand aside for now.
Our latest preferred count is that wave (ii) is ABC-X-ABC which ended at 123.33 and wave (iii) is unfolding with wave iii ended at 100.77, followed by wave iv at 111.57 and wave v as well as the wave (iii) has ended at 97.04, followed by wave (iv) at 111.43 and wave (v) has ended at 94.12 which is also the end of the larger degree v, this also implied the major wave (C) has also ended there, hence major correction has commenced from there with (A) leg unfolding in its lower degree wave c which has possibly ended at 145.69. Under this count, A-B-C wave (B) has commenced with A leg ended at 136.23, wave B at 143.79 and wave C has possibly ended at 149.79.
Our larger degree count is that the decline from 139.26 is wave (C) and is sub-divided into a diagonal triangle i-ii-iii-iv-v with wave i - 105.44, wave ii- 123.33, wave iii - 97.03, wave iv - 111.43, followed by the final wave v as well as the end of wave (C) at 94.12, this also mark the bottom of larger degree wave B. Under this count, major rise in wave C has commenced as an impulsive wave with minor wave III ended at 145.69, wave V is still in progress for further gain to 150.00. Having said that, this so-called wave V could well be the first leg of larger degree 5-waver wave C and this wave C should bring at least a retest of wave A top at 169.97 (July 2008).
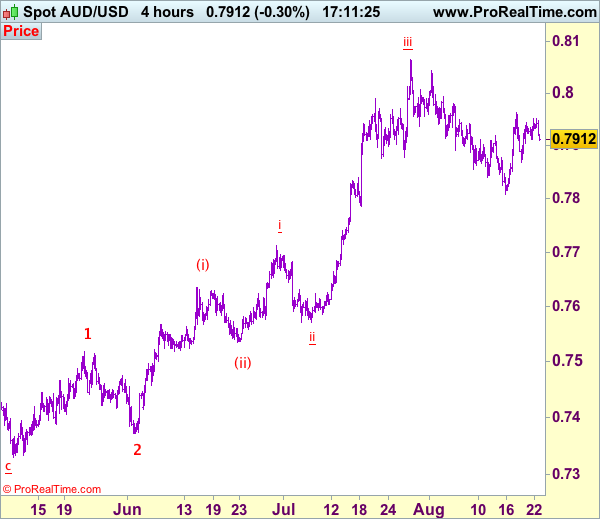
Trade Idea: AUD/USD – Hold long entered at 0.7895
AUD/USD – 0.7912
Recent wave: Wave 5 ended at 1.1081 and major correction has commenced for fall to 0.7000 and then towards 0.6500-10
Trend: Near term up
Original strategy :
Bought at 0.7895, Target: 0.8050, Stop: 0.7865
Position: - Long at 0.7895
Target: - 0.8050
Stop: - 0.7865
New strategy :
Hold long entered at 0.7895, Target: 0.8050, Stop: 0.7865
Position: - Long at 0.7895
Target: - 0.8050
Stop:- 0.7835
As aussie has retreated after faltering below resistance at 0.7963, suggesting further consolidation would be seen, however, as long as support at 0.7869 holds, bullishness remains for another rebound, above indicated resistance at 0.7963 would add credence to our view that low has possibly been formed at 0.7808 early last week, bring a stronger rebound to 0.8000 but break there is needed to signal the pullback from 0.8066 top (wave iii peak) has ended at 0.7808 (wave iv) and bring eventual retest of this level.
In view of this, we are holding on to our long position entered at 0.7895. Below said support at 0.7869 would dampen this bullish scenario and suggest the rebound from 0.9808 has ended, bring another test of this level, below there would signal the wave iv correction from 0.8066 is still in progress for weakness to 0.7786 support, however, oversold condition should prevent sharp fall below 0.7750 and price should stay above i top at 0.7712, bring rebound later. We are keeping our latest bullish count that recent impulsive waves is unfolding as (1 2, (i)(ii), i ii) and may extend headway towards 0.8150.
On the 4-hour chart, the move from 0.8066 is the wave 5 with i: 0.8860, ii: 0.8315, wave iii is an extended move ended at 1.0183, iv: 0.9706 and wave v has ended at 1.1081 (also the top of entire wave 5). The subsequent selloff is the major correction which is unfolding as ABC-X-ABC and 2nd A leg has ended at 0.8848, followed by a-b-c wave B which ended at 0.9758, hence, 2nd C wave is now in progress and indicated downside target at 0.7000 and 0.6950 had been met, so further fall to 0.6710-20 cannot be ruled out.
Forex Technical Analysis: EUR/USD, USD/JPY, GBP/USD
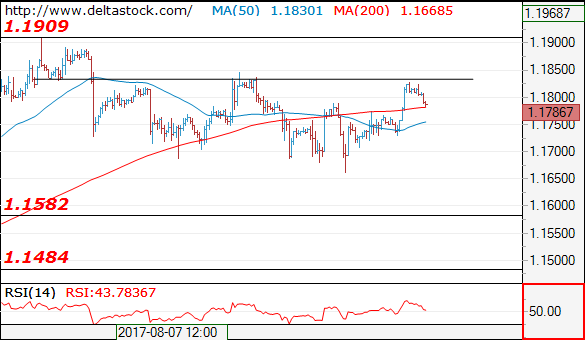
EUR/USD
Current level - 1.1786
The intraday bounce is over with the recent peak at 1.1827 and my outlook is bearish, for a break through the trigger at 1.1730, towards 1.1580.
| Resistance | Support | ||
| intraday | intraweek | intraday | intraweek |
| 1.1830 | 1.1909 | 1.1730 | 1.1580 |
| 1.1850 | 1.2000 | 1.1580 | 1.1480 |
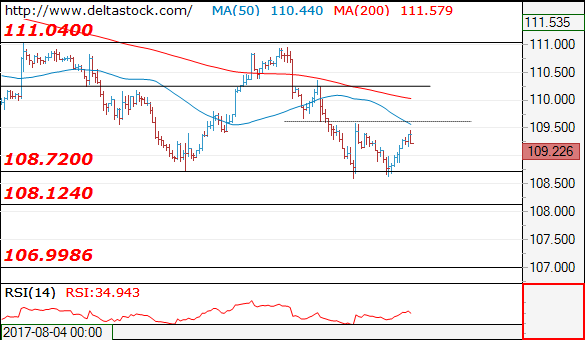
USD/JPY
Current level - 109.22
The consolidation pattern above 108.60 should be close to completion, so I favor a reversal around 109.60, for a sell-ff towards 108.10, en route to 107.00 area.
| Resistance | Support | ||
| intraday | intraweek | intraday | intraweek |
| 109.60 | 111.00 | 108.60 | 108.10 |
| 110.30 | 112.20 | 108.10 | 107.00 |
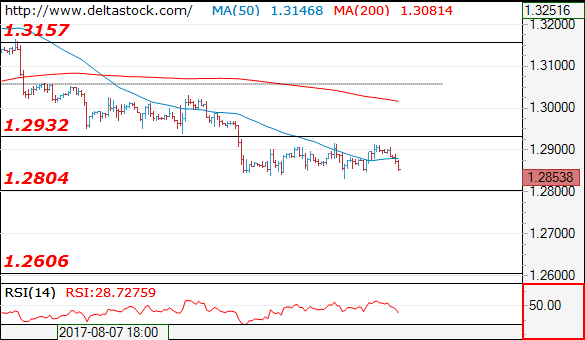
GBP/USD
Current level - 1.2853
The outlook is still bearish, for a break through 1.2800 zone, towards 1.2600 area. Key hurdle remains projected at 1.2930.
| Resistance | Support | ||
| intraday | intraweek | intraday | intraweek |
| 1.2930 | 1.3260 | 1.2804 | 1.2804 |
| 1.3050 | 1.3500 | 1.2705 | 1.2606 |
Technical Outlook: Aussie Pressured By Greenback’s Recovery
The Aussie dollar eases on Tuesday after repeated upside rejections under 0.7967 (Fibo 61.8% of 0.8065/0.7807 downleg), which could generate bearish signal of recovery rally stall on deeper pullback. In addition, falling weekly 200SMA (0.7978) continues to weigh heavily on near-term price action. Full bearish setup of daily studies has been dented on return below 20SMA (0.7924), as fresh weakness pressures 0.7900 handle, with stronger bearish signal to be expected on bearish extension below 10SMA/daily Tenkan-sen (0.7891/85). Dip-buying scenario would be favored while the price stays above daily Tenkan-sen.
Res: 0.7950, 0.7967, 0.7978, 0.8000
Sup: 0.7900, 0.7885, 0.7867, 0.7838
US Dollar Better Bid As Political Fears Ease
Are EU and US government yields set to recover?
Treasuries across the globe have in been in growing demand recently as investors are becoming increasingly worried about the monetary outlook on both side of the Atlantic. US yields have been moving within a downtrend channel since the beginning of the summer. US 10-year rate slid as much as 20bps, from 2.395% down to 2.20% as investors discounted a hawkish unwinding program for Janet Yellen. The 2-year rate fell 13bps to 1.30%. Similarly, Germany’s benchmark 10-year government bond yield lost 22bps to 0.40%, while the 2-year rate gave up 16bps and returned to -0.71%.
However, it seems that the rush for bonds is coming to an end as even the recent risk-off move failed to send yields lower. We are therefore ahead of a recovery in treasury yields, especially in the euro zone and the US. Given the fact that investors will most likely get rid of EU and US bonds at the same time, the effect on EUR/USD will be hard to predict. Nevertheless, the situation is quite different from that of commodity exporter countries such as Australia, New Zealand and Canada. Indeed, the spread has widened during the entire summer. A contraction of the interest rate differential would add incentive to sell those currencies as yield hungry investors reallocate their portfolios.
Still room to fade risk off trade
The current round of risky asset weakness and rise in volatility been partially blamed on Trumps decision to deploy additional troops into Afghanistan. In reaction to news of his announcement, the VIX spiked to a high of 16, US equities fought to sustain gains (clear weakness in Tech and Financial) while USDJPY slid to 108.60. While the speech provides a meaningful shift in campaign rhetoric the lack of details indicate investors should not assume long term structural consequence. Trump acknowledged that he had been critical of the unending war and advocated total withdrawal but as President his generals persuaded him to avoid creating a power vacuum in Afghanistan.
Some Washington pundits have suggested that this was Trumps attempt to stabilize a turbulent administration (following Bannon’s chaotic exit). However, we suspect that this stark reversal reflects Trumps lack of foreign policy experience and broader agenda. Elsewhere, suggestions that Trump pro-growth agenda is further of track, is a trade that has left the station months ago. In investment terms, our short-term view is the current risk-off trade as unjustified, opting to go long risk. We remain focused on Jackson Hole symposium in expectations that Yellen’s remarks indicating the markets are mispricing Fed-tightening risk.
Swiss trade balance widens
The Swiss trade balance has increased in July to 3.51 billion from 2.81 billion in June mostly due the continued decrease of imports growth that accelerated. The Franc overvaluation is pushing down the exports but the trade balance resists well and is still largely positive for July. Watch exports are one of the major exports driver with a growth of 3.6% y/y.
The CHF was down this morning against the single currency and is back towards 1.14 CHF for one euro. Markets did not react much on the trade balance data and focuses on the next ECB meeting the 7th of September. The summer is definitely quiet for Switzerland.
Upside pressures on the EURCHF should continue to happen before the European central bank meeting. Markets seem to buy the rumours. We stand ready to sell the news at the ECB meeting. One week later the September 14th the SNB will likely remains its rate unchanged
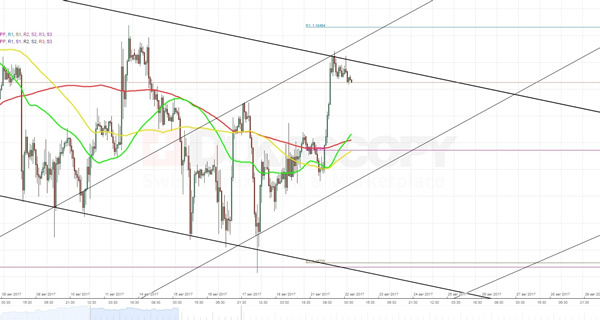
EUR/USD Analysis: Touches Channel’s Boundary
In accordance with expectations, the common European currency continued the surge against the US Dollar in a short-term ascending channel until it met a resistance barrier formed by the upper trend-line of a senior descending channel.
For this reason, the currency exchange rate is expected to move downwards. This course is supported by the overall market sentiment, which is 71% bearish. On the other hand, a summary of various technical indicators for the upcoming trading day sends a strong buy signal. However, both the situation and the forecasts can be altered after release of information on the German Economic Sentiment, which might slightly devaluate the Euro and accelerate the fall.
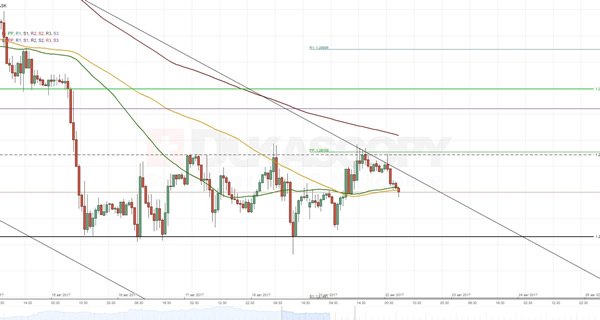
GBP/USD Analysis: Rebounds From Weekly PP At 1.2910
The latest developments in the GBP/USD currency pair forced to partially review the situation. On the one hand, the Pound expectedly rose and bounced off from the weekly PP at 1.2910. On the other hand, the subsequent fall through the 55- and 100-hour SMAs entails that the pair is rather moving in a rectangle or triple bottom formation that in the descending triangle. If the first assumption is true, the Pound has to eventually break through the 1.2846 level to the bottom and continue to move in a downtrend. This scenario seems rational since the 200-hour SMA is located way above the current market price. But if the second assumption is true, the pair should change the direction and start to move to the north.
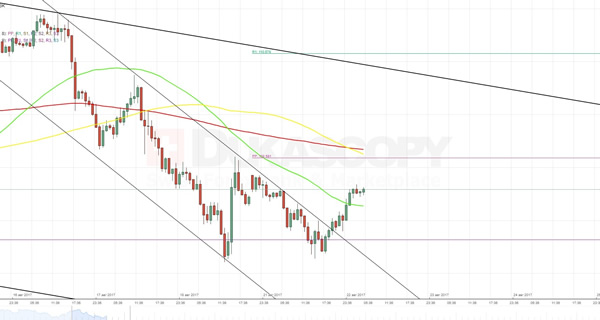
USD/JPY Analysis: Heads Towards 109.59
The USD/JPY exchange rate acted exactly as it was expected. Namely, it made the second attempt to break through the monthly S2 at 108.82, but failed. In result of a rebound, it broke through the upper boundary of a junior descending channel.
At the moment, it is heading upwards towards a combined resistance level set up a combination of the weekly PP at 109.59 in conjunction with the 100- and 200-hour SMAs. Most probably, their combined effort will force the pair to retreat. An aggregate of technical indicators support this possibility by sending strong sell signal. But in the meantime, the average market sentiment remains 68.24% bullish, which should not be disregarded in the larger perspective.
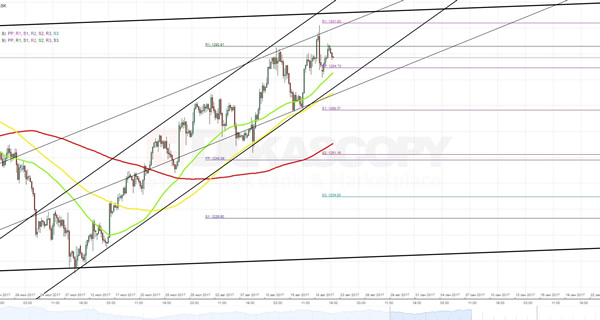
XAUUSD Analysis: Fails To Climb Above 1,292.91
As it was expected, previous trading session the yellow metal spent in a steady surge against the American Dollar. However, the soar did not last for long, as it was stopped already at the closest resistance level set up by the monthly R1 at 1,292.91. At the moment, the pair is moving horizontally, being squeezed between two notable barriers. The first is made of a combination of the 100- and 200-hour SMAs as well as the weekly PP at 1,284.70. The other one is made of the above monthly R1, but most importantly of an area located around the 1,296.00 mark, which represents a crossroad of the two junior ascending channels' upper boundaries. Hence, it seems that the bullion will prefer to move either horizontally, or downwards.
Technical Outlook: USDJPY – Bears Show Strong Hesitation At Weekly Cloud Base
The pair bounces on Tuesday after repeated rejection at strong support at 108.83 (weekly cloud base) that signals strong hesitation at key support zone.
Overall picture remains firmly bearish and favors further downside after completion of current consolidative phase.
Firm break below 108.83 and last Friday's low at 108.60 is needed to signal bearish continuation towards key med-term support at 108.11 (17 Apr low).
Upside attempts so far hold below initial resistance at 109.64 (falling 10SMA), which guards sideways-moving daily Tenkan-sen (109.77), and psychological 110.00 barrier, where extended upticks should be capped.
Res: 109.49, 109.64, 109.77, 110.00
Sup: 108.83, 108.60, 108.11, 107.88