Sample Category Title
Jackson Hole Symposium Preview: Draghi to Skip Policy Discussions
The ZEW survey surprised to the downside with the economic sentiment index in Germany plunged -7.5 points to 10 in August. The reading for the Eurozone as a whole fell -6.3 points to 29.3. Both readings came in weaker than expectations. The current situation index for Germany, however, climbed +0.3 point higher to 86.7, compared with consensus of 85.5. The euro fell against US dollar after the report on profit-taking. Indeed, EURUSD has been in consolidative mode since the beginning of August, following a 5% rally in July. We believe the pair would remain range-bound ahead of the Jackson Hole Symposium beginning on Thursday.
Jackson Hole Preview
Speeches by ECB President Mario Draghi and Fed Chair Janet Yellen are the key focuses. The market is anticipating Draghi to give more hints on ECB's asset purchases tapering. However, an ECB spokesman indicated last week that Draghi would not deliver a new policy message, but focus on the symposium's theme of "Fostering a Dynamic Global Economy". We believe Draghi would refrain from sending more signals about the policy outlook this week as the ECB is still working on the new economic projections for the September meeting. It would be prudent to wait for the updated economic forecasts and make announcement thereafter.
More Cautious over Currency Strength
We acknowledge that Draghi has turned more cautious in his communications, after his speech in late-June had accelerated euro's rally. The President noted in the Sintra forum (Speech: https://www.ecb.europa.eu/press/key/date/2017/html/ecb.sp170627.en.html) on June 27 that he is confident that "monetary policy is effective and the transmission process will work". Moreover, "all the signs now point to a strengthening and broadening recovery in the Euro area. Deflationary forces have been replaced by reflationary ones". EURUSD jumped +1.41% on the day, marking the biggest one-day rally for 2017. Euro's strength was then supported by encouraging macroeconomic data and June's ECB minutes released on July 6. The June minutes revealed that the members had considered "revisiting the easing bias with respect to the APP purchases, whereby the Governing Council signaled its readiness to increase the pace and/or duration of the asset purchases if necessary". They eventually decided to remain cautious and prudent, and maintain the original language.
Draghi apparently turned more dovish at the July meeting, attempting to tame euro's strength. He emphasized that the members had not discussed tapering and reiterated that the ECB is ready to increase the pace and/or duration of the asset purchases if necessary. Yet, EURUSD soared to almost a 2-year high after Draghi noted at the press conference that the adjustment of asset purchases might be discussed in autumn. The members expressed concerned about euro's appreciation, as suggested in the July minutes. They worried about "a possible overshooting in the repricing by financial markets, notably the foreign exchange markets, in the future". They emphasized that "the still favourable financing conditions could not be taken for granted and relied to a considerable extent on a continued high degree of monetary policy support". The ECB does not prefer the euro to appreciate excessively as this might affect its tapering plan.
Therefore, we believe Draghi would be cautious and refrain from sending any signal that might be interoperated as "hawkish" at the Jackson Hole Symposium. Yet, he might touch upon currency strength and its relations with inflation expectations, given that the final reading of Eurozone's CPI contracted -0.5% m/m in July, revised from the preliminary reading of 0%.
Risk Appetite Flickers ahead of Jackson Hole
Investors in Asia and Europe swiftly discarded safe-haven assets on Tuesday, as risk appetite staged a modest recovery ahead of the upcoming Jackson Hole Economic Policy Symposium this week.
Most Asian shares were boosted by the mild improvement in risk sentiment during early trading, with European stocks venturing higher and subsequently breaking a three-day losing streak. The domino effect from Asian and European markets, coupled with rising commodity prices, is likely to support Wall Street this afternoon. Although world stocks may continue to trade cautiously higher this week, geopolitical risk and political uncertainty in Washington both have the ability to limit upside gains.
Dollar Index edges towards 93.50
King Dollar appreciated against a basket of major currencies on Tuesday, as investors directed their attention to the upcoming meeting of financial heavyweights in Jackson Hole, on 24 - 26 August.
The Greenback has struggled for direction this month, with prices oscillating within a wide range as market players juggled a multitude of themes. Ongoing uncertainty over US President Donald Trump's economic agenda continues to punish the currency, while concerns regarding low inflation in the US have weighed heavily on the prospects of higher interest rates. Although the Dollar Index edged slightly higher on Tuesday, bulls are becoming increasingly exhausted and may rely on Janet Yellen's missive for fresh inspiration to send prices higher.
Market players will be paying very close attention to Yellen's speech at Jackson Hole this Friday and it will be closely scrutinized for any comments regarding monetary policy. Fresh policy insight by Yellen, on when the central bank plans to unwind its balance sheet and raise US interest rates this year, should support the Dollar.
From a technical standpoint, the Dollar Index still remains under pressure on the daily charts. There have been consistently lower lows and lower highs, while prices are trading below the daily 20 SMA. Sustained weakness below 94.00 should encourage a further depreciation towards 92.50.
Crude oil trapped in tug of war
WTI Crude struggled to maintain gains on Tuesday, with prices eventually descending towards $47.50 as lingering oversupply concerns weighed on sentiment.
This has certainly been an interesting period for oil markets, with the commodity trapped in a tough tug of war as conflicting news excites both the bulls and bears. Although OPEC's optimism over the production cut deal sparked speculative boosts in prices, reports of compliance faltering in July and output jumping to a 2017 high in the same month attracted bears. This tug of war may be coming to an end with oil's bearish price action, suggesting that investors are becoming increasingly skeptical of the cartel's ability to rebalance the oil markets.
Sentiment towards oil remains bearish amid oversupply fears and the possible threat of OPEC's supply cut deal falling apart; if oil prices fail to rebound, this is likely to weigh on investor sentiment. From a technical standpoint, WTI Crude has broken below $48 with $46.50 acting as the next level of interest.
Commodity spotlight - Gold
Gold was under noticeable pressure on Tuesday, with prices tumbling towards $1283 as the Dollar stabilized.
Regardless of the short-term losses, the yellow metal remains heavily supported by geopolitical risk and political drama in Washington. There is still a lingering air of caution ahead of the Jackson Hole conference later this week and this should empower Gold bulls. From a technical standpoint, the yellow metal is bullish on the daily charts, as there have been consistently higher highs and higher lows. Bulls still have some control above the $1283 support, with a break above $1293 opening a path towards $1300. In an alternative scenario, sustained weakness below $1283 should open a path back to $1270.
GBP/USD Mid-Day Outlook
Daily Pivots: (S1) 1.2859; (P) 1.2887; (R1) 1.2925; More...
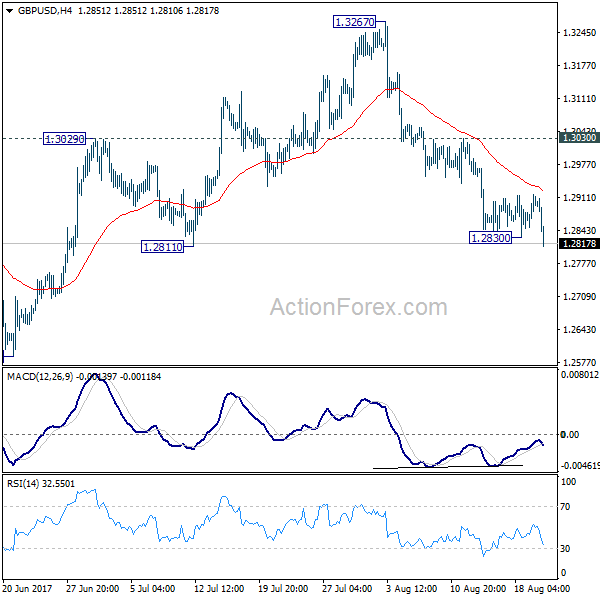
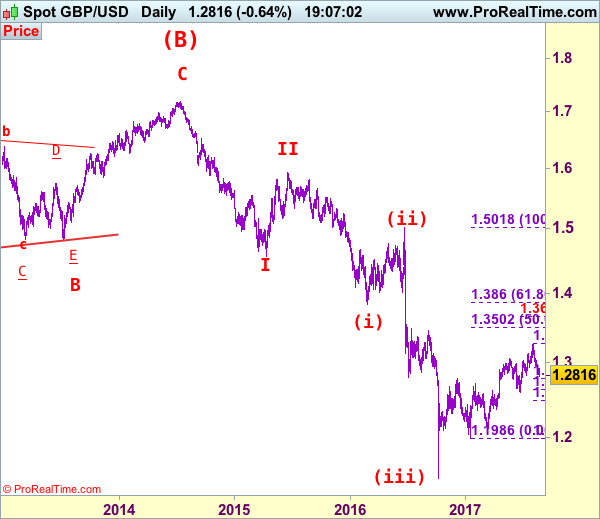
GBP/USD's decline resumed after brief consolidation and reaches as low as 1.2810 so far. Intraday bias is back on the downside for 1.2588 key near term support. . As noted before, we're favoring the case that correction from 1.1946 is completed at 1.3267. Decisive break of 1.2588 will confirm our view and target a test on 1.1946 low. On the upside, break of 1.3030 resistance is needed to indicate completion of the fall from 1.3267. Otherwise, outlook will stay cautiously bearish in case of recovery.
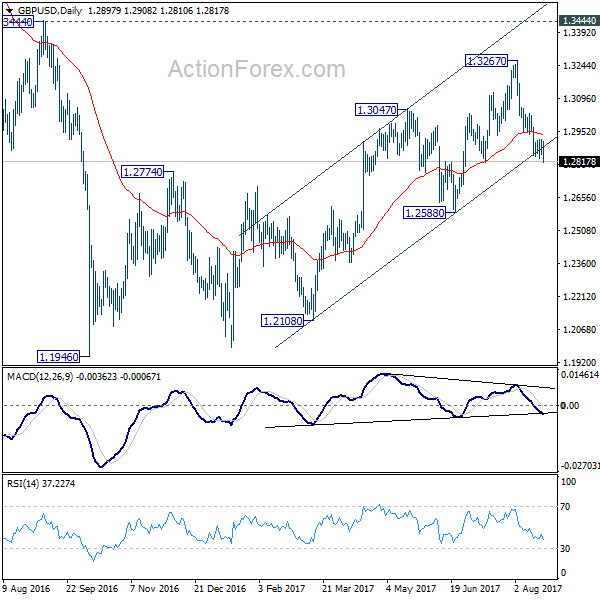
In the bigger picture, overall, price actions from 1.1946 medium term low are seen as a corrective pattern. While further rise cannot be ruled out, larger outlook remains bearish as long as 1.3444 key resistance holds. Down trend from 1.7190 (2014 high) is expected to resume later after the correction completes. And break of 1.2588 will indicate that such down trend is resuming.
Canadian Dollar Higher after Retail Sales, Sterling Back Under Pressure
Trading in the forex markets remain rather subdued today. Nonetheless, fresh selling is seen in Sterling in early US session. EUR/GBP is extending recent rally while GBP/USD also breaks 1.2830 minor support. At the same time, Canadian Dollar is given a boost from retail sales data. EUR/USD turns soft as Dollar recovers, after the pair failed to break out 1.1846 minor resistance. But overall, the markets are awaiting new trading theme and would probably need to wait till Jackson Hole Symposium on Thursday and Friday.
CAD lifted by 0.7% growth in ex-auto sales
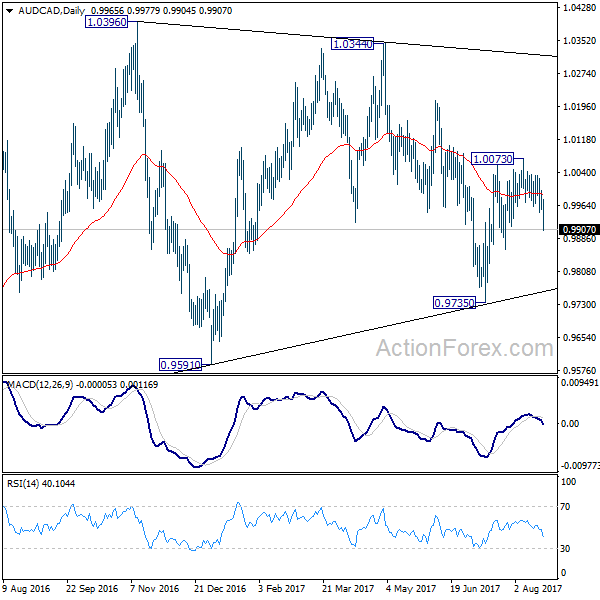
Released from Canada, headline retail sales rose 0.1% mom in July, below expectation of 0.3%. But ex-auto sales posted a strong upside surprise by rising 0.7% mom, versus expectation of 0.3% mom. AUD/CAD's sharp decline after the release suggests that the cross is finally moving away from 55 day EMA. And, the rebound from 0.9735 should be completed at 1.0073. Deeper fall should be seen back to 0.9735 support. Break there will target 0.9591.
North Korean warned US of "merciless revenge"
In response to the joint annual military drills of US and South Korea, North Korea warned that US will face "merciless revenge". And North Korea the state-run Korean Central News Agency said, said it's wrong to assume they will "sit comfortably without doing anything." US Pacific Command chief Harry Harris said today that "we hope for a diplomatic solution to the challenge presented by Kim Jong Un." And, Harris emphasized that "a strong diplomatic effort backed by a strong military effort is key because credible combat power should be a support to diplomacy and not the other way round." Japan's Foreign Minister Taro Kono urged that "it's time to exert pressure" on North Korea, not the time to discuss six-party talks between Koreas, US, Russia, China and Japan
German ZEW hit 10-month low
Germany ZEW economic sentiment dropped sharply to 10 in August, down fro 17.5 and missed expectation of 15. That's also the lowest level since October 2016. Current situation gauge rose slightly to 86.7, up from 86.4 and beat expectation of 85.5. Eurozone ZEW economic sentiment also dropped sharply to 29.3, down from 35.6, below expectation of 34.2. ZEW President Achim Wambach said that "the significant decrease of the ZEW economic sentiment indicator reflects the high degree of nervousness over the future path of growth in Germany." And, "both weaker than expected German exports as well as the widening scandal in the German automobile sector in particular have helped contribute to this situation". Nonetheless, Wambach also noted that "overall, the economic outlook still remains relatively stable at a fairly high level."
Also released in European session, UK public sector net borrowing dropped -GBP -0.8b in July, CBI trends total orders rose to 13 in August. Swiss trade surplus widened to CHF 3.51b in July.
GBP/USD Mid-Day Outlook
Daily Pivots: (S1) 1.2859; (P) 1.2887; (R1) 1.2925; More...
GBP/USD's decline resumed after brief consolidation and reaches as low as 1.2810 so far. Intraday bias is back on the downside for 1.2588 key near term support. . As noted before, we're favoring the case that correction from 1.1946 is completed at 1.3267. Decisive break of 1.2588 will confirm our view and target a test on 1.1946 low. On the upside, break of 1.3030 resistance is needed to indicate completion of the fall from 1.3267. Otherwise, outlook will stay cautiously bearish in case of recovery.
In the bigger picture, overall, price actions from 1.1946 medium term low are seen as a corrective pattern. While further rise cannot be ruled out, larger outlook remains bearish as long as 1.3444 key resistance holds. Down trend from 1.7190 (2014 high) is expected to resume later after the correction completes. And break of 1.2588 will indicate that such down trend is resuming.
Economic Indicators Update
| GMT | Ccy | Events | Actual | Forecast | Previous | Revised |
|---|---|---|---|---|---|---|
| 06:00 | CHF | Trade Balance (CHF) Jul | 3.51B | 2.88B | 2.81B | 2.76B |
| 08:30 | GBP | Public Sector Net Borrowing (GBP) Jul | -0.8B | 0.3B | 6.3B | 5.7B |
| 09:00 | EUR | German ZEW (Economic Sentiment) Aug | 10 | 15 | 17.5 | |
| 09:00 | EUR | German ZEW (Current Situation) Aug | 86.7 | 85.5 | 86.4 | |
| 09:00 | EUR | Eurozone ZEW (Economic Sentiment) Aug | 29.3 | 34.2 | 35.6 | |
| 10:00 | GBP | CBI Trends Total Orders Aug | 13 | 10 | 10 | |
| 12:30 | CAD | Retail Sales M/M Jun | 0.10% | 0.30% | 0.60% | 0.50% |
| 12:30 | CAD | Retail Sales Less Autos M/M Jun | 0.70% | 0.30% | -0.10% | |
| 13:00 | USD | House Price Index M/M Jun | 0.50% | 0.40% |
USD/CAD Bounce Or Break?
The USD/CAD has increased today and is struggling to recover after the significant drop. It is pressuring an important dynamic support, has dropped below it, but this could still be a false breakdown. The USD has dragged the price higher as the USDX has managed to rebound and to climb above the 93.50 psychological level.
Is very important to see what impact will have the Canadian data, the Retail Sales figures may bring some volatility, but remains to see the direction. USD/CAD will increase sharply in the upcoming hours if the numbers will disappoint.
The Core Retail Sales are expected to increase by 0.0% in June versus a 0.1% drop in May, while the Retail Sales could increase by 0.2% in June, but less compared to the 0.6% growth in the former reading period.
You can see that the rate failed to retest the median line (ml) of the minor descending pitchfork and now is trying to climb above the fourth warning line (wl4) of the former minor ascending pitchfork. Technically, it could move towards the upper median line (uml) again, but unfortunately, the fundamental factors will take the lead.
Could move in range on the short term because needs to accumulate more directional energy before will start really start another significant upside movement. Only an accumulation will signal a reversal on the daily chart.
USD/CAD could come down to retest the 1.2460 major static support and the lower median line (ascending black line) of the major ascending pitchfork.
Brent Oil The Morning Gains Have Vanished
Price dropped aggressively in the yesterday's trading session and seems to heavy to be stopped. Brent increased in the morning, but the bears are still in the game and have sent the rate down again. The perspective is still bullish on the short term as long as is trading within the ascending channel's body. Technically, a breakdown is favored after another false breakout above the 53.03 major static resistance.
USD/JPY Valid Or False Breakdown?
USD/JPY posted significant gains today and is challenging the confluence area formed between the 50% retracement level with the warning line (wl1). Price will resume the downside movement if will stay under the mentioned broken support levels, could also retest the minor uptrend line before will drop much deeper.
EURGBP: Risk Continues To Point Higher Medium Term
EURGBP- The cross closed higher on Monday opening the door for additional gains in the days ahead. Support lies at the 0.9100 level where a violation will turn focus to the 0.9050 level. A break will expose the 0.9000 level. Resistance resides at the 0.9200 level where a violation if seen will turn risk towards the 0.9250 level. Further up, resistance resides at 0.9300 level followed by the 0.9350 level. Its daily RSI is bearish and pointing lower supporting this view. All in all, EURGBP remains biased to the upside medium term.
GBP/USD Elliott Wave Analysis
GBP/USD – 1.2825
As cable has remained under pressure after brief recovery, suggesting the fall from 1.3269 top is still in progress and bearishness remains for this fall to extend weakness to support at 1.2812, break there would encourage for decline to 1.2775-80 (38.2% Fibonacci retracement of 1.1986-1.3269), then towards 1.2700, however, near term oversold condition should limit downside to 1.2650-60 and reckon 1.2620-30 (50% Fibonacci retracement) would hold from here, price should stay well above previous chart support at 1.2589, bring rebound later.
Our preferred count on the daily chart is that cable's rebound from 1.3500 (wave (A) trough) is unfolding as a wave (B) with A ended at 1.7043, followed by triangle wave B and wave C as well as wave (B) has possibly ended at 1.7192, below support at 1.4232 would add credence to this count, then further fall to 1.4000 level would follow but reckon downside would be limited to 1.3655 support and price should stay above previous support at 1.3500.
On the upside, expect recovery to be limited to 1.2915-20 and renewed selling interest should emerge below previous support at 1.2933 (now resistance), bring another decline. Above 1.2970 would risk test of 1.3000 but only break of resistance at 1.3032 would suggest first leg of decline from 1.3269 has ended, bring a stronger rebound to 1.3100 but still reckon upside would be limited to 1.3165 and price should falter well below said resistance at 1.3269, bring another decline later.
Recommendation: Sell at 1.2910 for 1.2710 with stop above 1.3010.
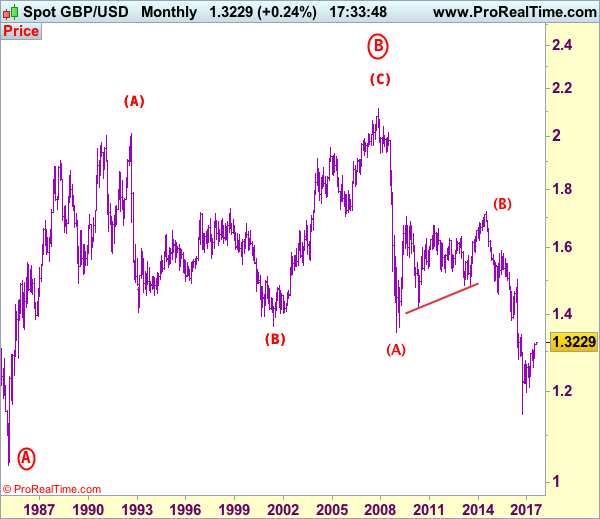
Longer term - Cable's rise from 1.0520 (Feb 1985) to 2.0100 (September 1992) is seen as [A], the decline to 1.3682 is labeled as (B) and (C) wave rally has ended at 2.1162 (9 Nov, 2007) which is also the top of larger degree wave B with circle. The selloff from there is a 5-waver with wave (A) ended at 1.3500 (23 Jan 2009), wave (B) itself is labeled as A: 1.6733, triangle wave B: 1.4813 and wave C as well as top of wave (B) ended at 1.7192 (2014), hence the selloff from there is an impulsive wave (C) with wave I : 1.4566, wave II 1.5930, an extended wave III is unfolding and already exceeded our downside target at 1.3500 and 1.3000, hence weakness to 1.2500 and possibly 1.2000 cannot be ruled out, however, price should stay well above psychological level at 1.0000.
GBP/CHF Elliott Wave Analysis
GBP/CHF – 1.2385
Sterling ran into renewed selling interest at 1.2854 earlier this month and has dropped sharply from there, reviving our bearish view and suggesting the rebound from 1.2241 (June low) has ended there, hence consolidation with downside bias is seen for weakness to 1.2300, then test of support at 1.2270, however, break of latter level is needed to add credence to this view and signal the decline from 1.3069 top has resumed for retest of 1.2241. Looking ahead, a drop below this level would suggest early correction from 1.1475 (2016 low) has ended at 1.3069, bring further weakness towards previous support at 1.2102 but psychological support at 1.2000 would hold on first testing.
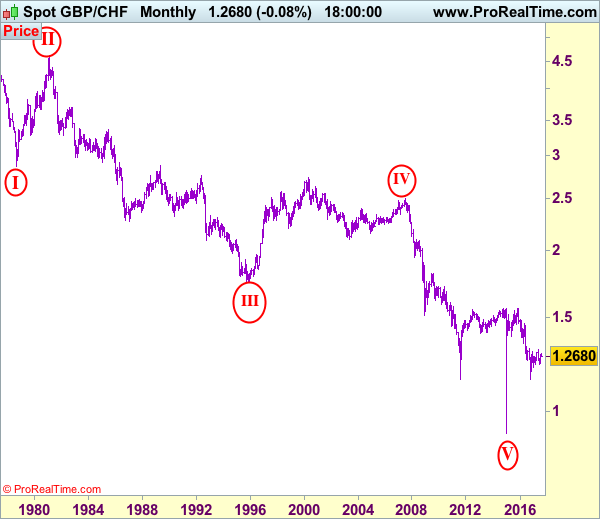
To recap the larger degree count, the selloff from 2.4965 (July 2007) is the beginning of wave V with circle and is labeled as 1: 2.3760, 2: 2.4425, wave 3 extension ended at 1.1470, followed by wave 4 at 1.5547, the quick rebound from 0.9106 suggests wave 5 as well as entire circle wave V could have ended there, hence consolidation with mild upside bias is seen for major correction to take place, bring initial test of 1.5547 (previous 4th of a lesser degree).
On the upside, whilst recovery to 1.2450 cannot be ruled out, reckon upside would be limited to 1.2500-10 and bring another decline later. Above 1.2580-85 would defer and risk test of resistance at 1.2646 but only a daily close above this level would suggest the retreat from 1.2854 has ended instead, risk a stronger rebound to 1.2700-10 and then 1.2750-55 but price should falter well below said resistance at 1.2854, bring another selloff later.
Recommendation: Sell at 1.2500 for 1.2275 with stop above 1.2600.

On the Monthly chart, the longer-term count is that major downtrend is under way with circle wave I at 2.8645 (Sep 1.978), then wave II with circle at 4.6175 (Feb 1981), the wave III with circle ended at 1.7425 (Nov 1995) and followed by wave IV with circle at 2.4965 (July 2007 with a short wave C) and wave V with circle has possibly ended at 0.9106. A monthly close above 1.5547 would add credence to this view, bring major correction to 1.7000, then towards psychological level at 2.0000.