
Sample Category Title
Trade Idea Update: EUR/USD – Hold long entered at 1.1765
EUR/USD - 1.1763
Original strategy :
Bought at 1.1765, Target: 1.1865, Stop: 1.1730
Position : - Long at 1.1765
Target : - 1.1865
Stop : - 1.1730
New strategy :
Hold long entered at 1.1765, Target: 1.1865, Stop: 1.1730
Position : - Long at 1.1765
Target : - 1.1865
Stop : - 1.1730
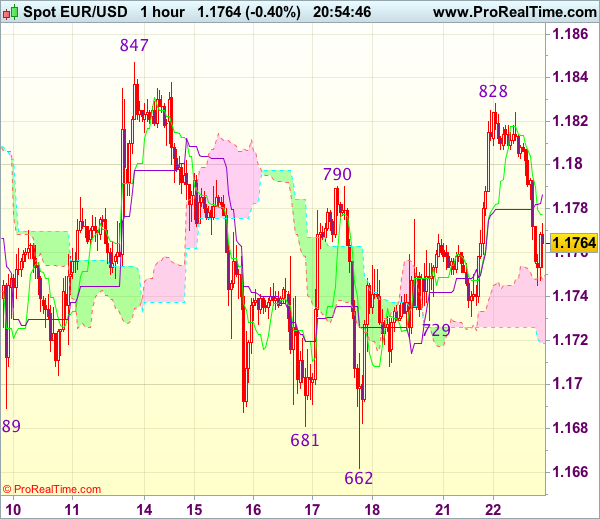
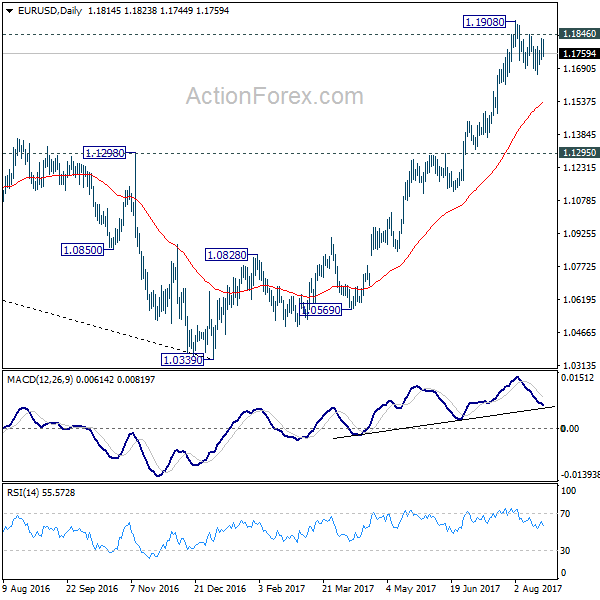
As the single currency has retreated after meeting resistance at 1.1828 yesterday, suggesting consolidation below this level would be seen, however, reckon minor support at 1.1745 would limit downside and bring another rise later, above said resistance at 1.1828 would extend the rise from last week’s low of 1.1662 to resistance at 1.1847, break there would provide confirmation the pullback from 1.1910 has ended and encourage for headway to 1.1870-80 but reckon said resistance at 1.1910 would hold from here.
In view of this, we are holding on to our long position entered at 1.1765. Only below 1.1725-30 would abort and suggest the rebound from 1.1662 has ended instead, risk weakness to 1.1695-00 first.
Canadian Retail Sales Volumes Up Again in June
Highlights
- Nominal retail sales in June inched up 0.1% despite a large drop in gasoline prices.
- In volume terms, sales rose 0.5% from May and 7.8% from a year-ago.
- E-commerce sales (not all of which are included in the retail sales totals) were up 43.5% from a year ago in June and 42% year-to-date.
Consumer spending in Canada continues to build on levels that already accounted for a record share of overall GDP last year. The 0.5% gain in sale volumes in June was the sixth consecutive monthly increase and the 11th of the last 12. Sales have increased at an 81/2% (annualized) rate over the last three quarters, on average. That is the strongest three-quarter increase in almost 13 years.
Other economic reports haven't been as strong in June with earlier-reported declines in both manufacturing and wholesale trade volumes. It nonetheless looks like overall GDP inched up another 0.1% in the month. That is admittedly a very modest pace but would be the 8th consecutive rise in a measure that is typically very volatile. GDP still looks on track to rise 3.7% (annualized) in Q2 as a whole, in line with the Q1 increase. That outsized pace isn't likely to be sustained and significant risks around NAFTA renegotiation remain. Labour markets have also been very solid through July, though, consistent with our call for growth to remain at a modestly 'above-trend' 1.9% pace in Q3. Lack of significant upward wage and inflation pressure continue to provide the Bank of Canada with some room to maneuver but the broader economic data also still suggests the economy is strong enough to absorb further modest interest rate hikes.
USD/CAD Mid-Day Outlook
Daily Pivots: (S1) 1.2538; (P) 1.2572; (R1) 1.2591; More....
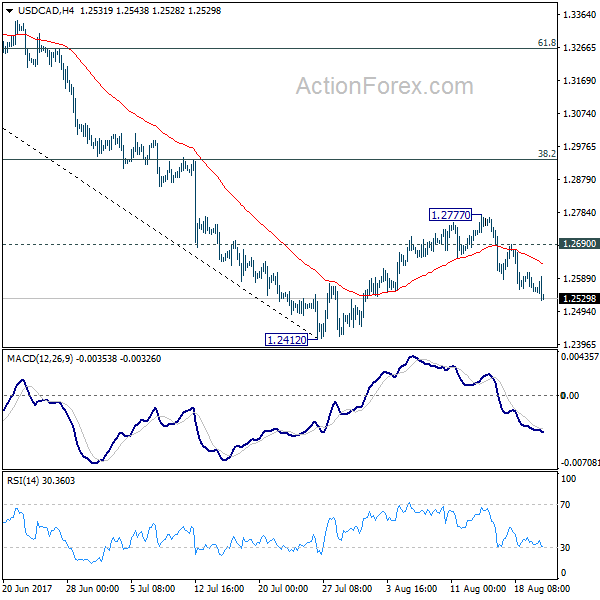
USD/CAD's fall from 1.2777 is still in progress and intraday bias remains on the downside for retesting 1.2412 low. Break there will resume the larger decline and target next long term fibonacci level at 1.2048. On the upside, above 1.2690 will extend the correction from 1.2412 with another rise. But we'd expect upside to be limited by 38.2% retracement of 1.3793 to 1.2412 at 1.2940 to bring fall resumption eventually.
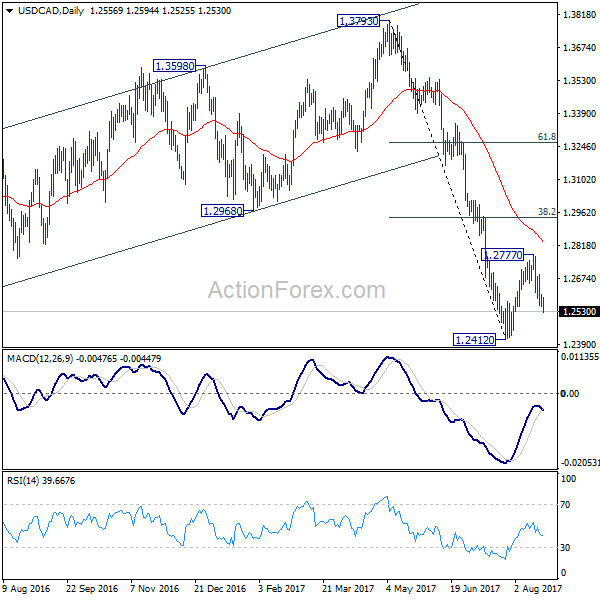
In the bigger picture, price actions from 1.4689 medium term top are seen as a correction pattern. Such corrective fall is still expected to extend to 50% retracement of 0.9406 to 1.4869 at 1.2048. At this point, we'd look for strong support from there to contain downside and bring rebound. Nonetheless, on the upside, sustained break of 1.2968, 38.2% retracement of 1.3793 to 1.2412 at 1.2940 will be the first sign of completion of the correction and will turn focus back to 1.3793 key resistance.
USD/JPY Mid-Day Outlook
Daily Pivots: (S1) 108.59; (P) 109.00; (R1) 109.38; More...
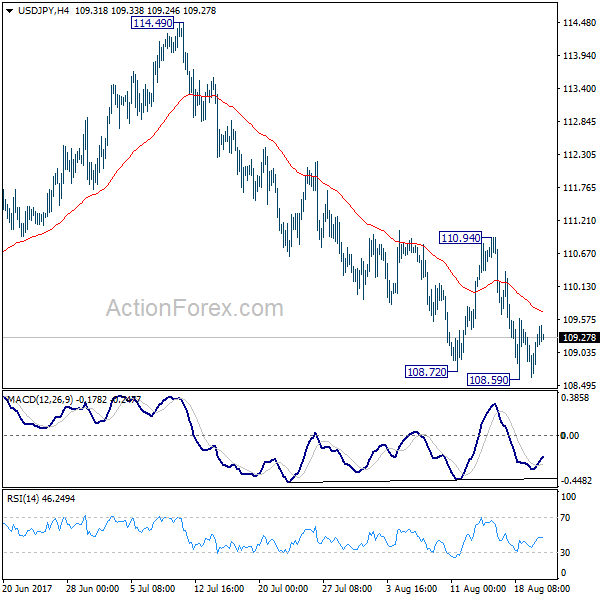
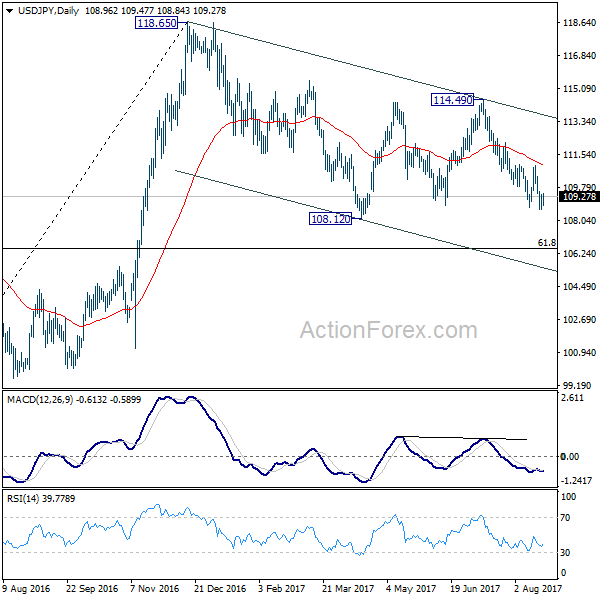
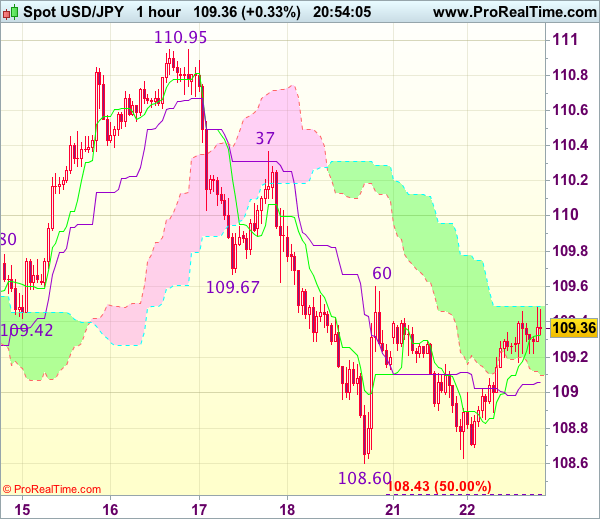
Intraday bias in USD/JPY remains neutral for consolidation above 108.59 temporary low. Overall outlook stays bearish as long as 110.94 resistance holds. Below 108.59 will target a test on 108.12 low. Whole corrective decline from 118.65 is possibly resuming and break of 108.12 will target 61.8% retracement of 98.97 to 118.65 at 106.48.
In the bigger picture, the corrective structure of the fall from 118.65 suggests that rise from 98.97 is not completed yet. Break of 118.65 will target a test on 125.85 high. At this point, it's uncertain whether rise from 98.97 is resuming the long term up trend from 75.56, or it's a leg in the consolidation from 125.85. Hence, we'll be cautious on topping as it approaches 125.85. If fall from 118.65 extends lower, downside should be contained by 61.8% retracement of 98.97 to 118.65 at 106.48 and bring rebound.
USD/CHF Mid-Day Outlook
Daily Pivots: (S1) 0.9584; (P) 0.9634; (R1) 0.9669; More....
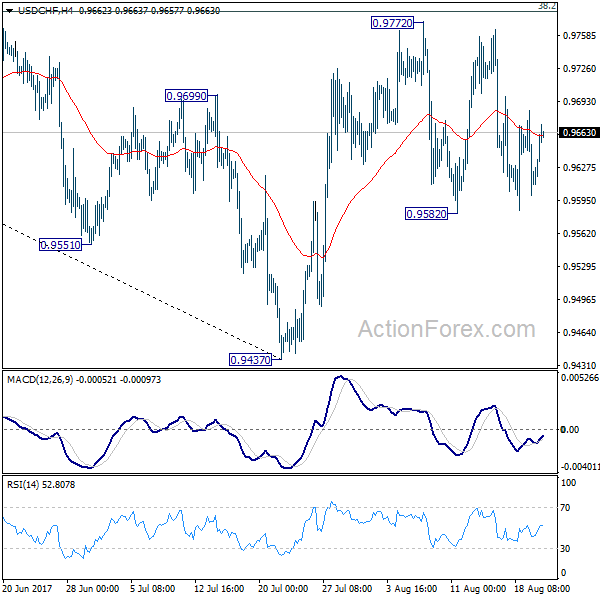
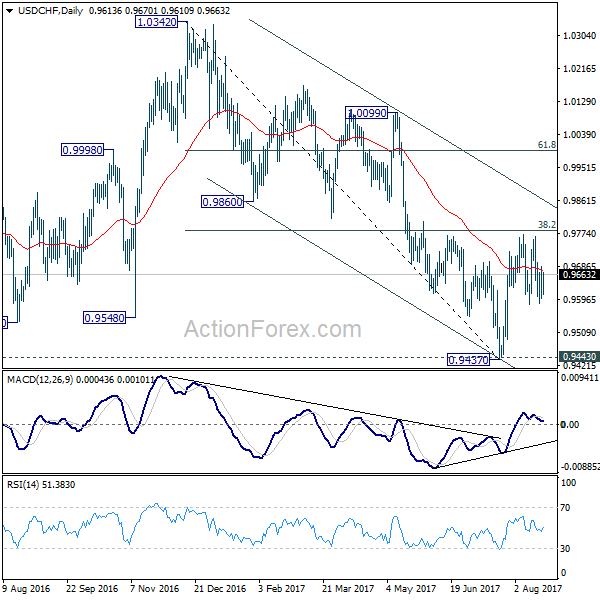
Intraday bias in USD/CHF remains neutral as the pair is bounded in range of 0.9582/9772. On the upside, decisive break of 0.9772 resistance will revive the bullish case of reversal. That is, whole decline from 1.0342 has completed at 0.9437 after defending 0.9443 support. USD/CHF should then target channel resistance (now at 0.9862) next. Meanwhile, the pair is bounded inside medium term falling channel and limited below 38.2% retracement of 1.0342 to 0.9437 at 0.9783 for the moment. Break of 0.9582 will turn bias back to the downside for 0.9437. This could also extend the fall from 1.0342 through 0.9437/43 key support level.
In the bigger picture, we're slightly favoring the case that USD/CHF has successfully defended 0.9443 key support level. And long term range trading in 0.9443/1.0342 is extending with another rise. At this point, there is no sign of an up trend yet. Hence, while further rise is expected in USD/CHF, we'll start to be cautious on loss of momentum above 61.8% retracement of 1.0342 to 0.9437 at 0.9996. However, firm break of 0.9443 will carry larger bearish implication and would target next key support at 0.9072.
EUR/USD Mid-Day Outlook
Daily Pivots: (S1) 1.1753; (P) 1.1790 (R1) 1.1851; More...
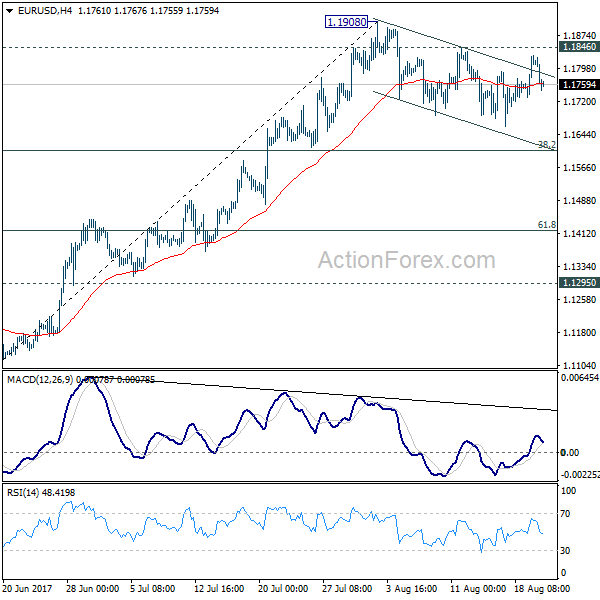
Intraday bias in EUR/USD remains neutral as consolidation from 1.1908 is extending. In case of deeper fall, downside should be contained by 38.2% retracement of 1.1119 to 1.1908 at 1.1606 to bring up trend resumption. Break of 1.1846 minor resistance will argue that larger rise from 1.0339 is resuming for 1.2042 long term support turned resistance next.
In the bigger picture, an important bottom was formed at 1.0339 on bullish convergence condition in weekly MACD. Sustained trading above 55 month EMA (now at 1.1768) will pave the way to key fibonacci level at 38.2% retracement of 1.6039 (2008 high) to 1.0339 (2017 low) at 1.2516. While rise from 1.0339 is strong, there is no confirmation that it's developing into a long term up trend yet. Hence, we'll be cautious on strong resistance from 1.2516 to limit upside. But for now, medium term outlook will remain bullish as long as 1.1295 support holds, in case of pull back.
Trade Idea Update: USD/JPY – Stand aside
USD/JPY - 109.27
New strategy :
Stand aside
Position : -
Target : -
Stop : -
Despite yesterday’s all to 108.63, the subsequent rebound after holding above indicated support at 108.60 has retained our view that further consolidation would take place and another test of resistance at 109.60-67 cannot be ruled out, however, a firm break above there is needed to signal low has been formed at 108.60, bring a stronger rebound to 110.00 and later towards resistance at 110.37 which is likely to hold from here.
On the downside, below 108.80 would bring retest of 108.60 but only break there would signal recent decline has resumed and may extend further weakness to 108.30 (1.618 times projection of 110.95-109.67 measuring from 110.37), then towards 108.10-15 (61.8% projection of 110.95-108.60 measuring from 109.60), however, loss of downward momentum should prevent sharp fall below latter level and reckon 108.00 would hold from here, bring rebound later. As near term outlook is mixed, would be prudent to stand aside for now, then look to sell dollar on subsequent rebound.
German ZEW Economic Sentiment Misses Forecasts; Euro Extends Losses
Germany's ZEW economic sentiment indicator for the month of August highlighted on Tuesday that German investors feel less optimistic about the outlook for the economy in the next six months, adding to the euro's losses. However, the negative impact on the currency was softened as views on the current economic conditions came in higher than expected.
According to the figures, the German ZEW economic sentiment index, which is a closely watched survey that asks companies about their six-month expectations regarding economic conditions, came in lower than projected. While forecasts were for the indicator to decrease by 2.5 points to 15 in August, the actual decline was 7.5 points with the indicator standing at 10 instead, below the 23.8 long-term average. This was the third consecutive drop since the index touched a 21-month high of 20.6 in May.
The main factors weighing on the index were weaker exports and the ongoing scandals in the automobile industry. Monthly exports in July dropped unexpectedly by 2.8% after rising for five consecutive months, while the car makers Volkswagen, BMW and Daimler continued facing allegations of more than a decade of collusion, with the companies developing a cartel over the period to cheat on diesel emission tests in the US.
Despite this, the ZEW President, Professor Achim Wambach, expressed that overall the country's economic outlook "remains relatively stable at a fairly high level". Note that the preliminary GDP growth figures for Germany for the second quarter increased surprisingly to 2.1% year-on-year, posting the highest growth since August 2016.
Moreover, ZEW participants, in contrast to their pessimistic forecasts about future conditions, held an optimistic stance over the current economic situation. The corresponding ZEW index rose to 86.7 in August, exceeding the anticipated figure of 85.5 and the 86.4 seen in the previous month. This was close to the six-year high of 88.0 reached in June.
Meanwhile, the ZEW economic sentiment for the eurozone was also published on Tuesday, showing a moderation in investor's future expectations. The index fell by 6.3 points in August to 29.3, missing the forecast of 34.2.
Looking at the reaction in the forex markets, the euro reversed yesterday's gains against the dollar, falling by 0.17% to an intra-day low of $1.1751. Euro/yen declined by 0.21% to 128.41, while euro/swiss franc slid by 0.11% to 1.1351.
USD/JPY Two Confluence Zones Hovering Above The Price
The USD/JPY is showing a confluence zone above the price and it could reject soon. H1 chart shows a downtrend and 109.50-70 (EMA89, 61.8, order block, ATR pivot, D H5) should reject the price possibly towards D H3 109.14 and 108.71 D L3. A spike above weekly H3 109.84 could reverse the trend to the upside possibly targeting 110.16 a confluence of 88.6 and previous order block.
Momentum in Canadian Retail Sales Continues
Momentum in Canadian retail sales extended into June, with sales edging up 0.1% during the month. In real terms, the gains were even more pronounced, with volumes up by 0.5%.
June's gains were led by higher sales at general merchandise stores (+2.9%), clothing and accessories stores (+2.7%) and building material and garden equipment dealers (+2.2%). Meanwhile, sales at motor vehicle and parts dealers (-1.4%) and gasoline stations (-1.8%) provided some offset. Excluding these two subsectors, retail sales were up 1.1% during the month.
Regionally, the results were mixed, with sales up in 5 provinces. B.C. (+1.9%) led the way, followed by Alberta (+1.0%) and Nova Scotia (+1.0%). Retail sales in Ontario were down 0.7%.
Key Implications
Strong gains in sales volumes in recent months have pushed retail sales up by 2.1% in the second quarter as a whole. This bodes well for overall economic growth, which is tracking 3.7% for the quarter.
Going forward, this robust pace of growth is likely to moderate. The cooling housing market – particularly in Ontario – is likely to weigh on demand, especially for housing related goods. Meanwhile, rising interest rates should help to rein in household spending more broadly.
That said, credit channels remain healthy and overall consumer spending is projected to grow by close to 2% over the second half of this year, remaining a key support for the overall economy. As such, even with a moderation in household spending, the Bank of Canada is likely to remain in tightening mode, with another rate hike likely to come in the fall of this year.