Sample Category Title
AUD/USD Daily Outlook
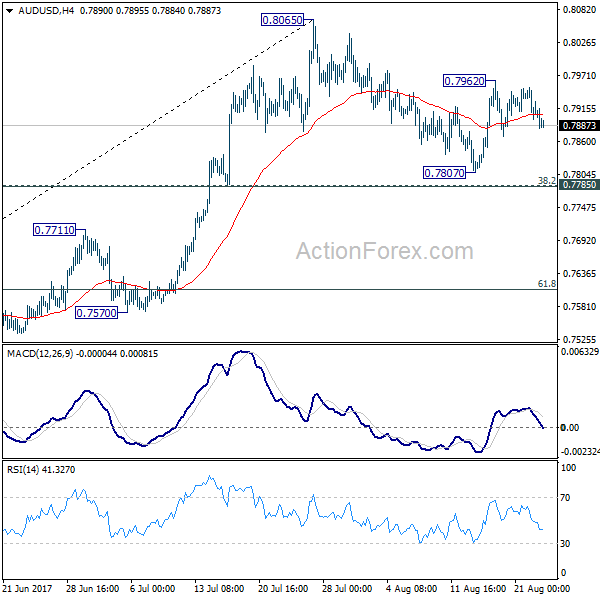
Daily Pivots: (S1) 0.7887; (P) 0.7919; (R1) 0.7940; More...
Intraday bias in AUD/USD is turned neutral again as the pair lost upside moment. Correction from 0.8065 might extend. But downside should be contained by 0.7785 cluster support (38.2% retracement of 0.7328 to 0.8065 at 0.7783) to bring rebound. Above 0.7962 will target a test on 0.8065 resistance first. Firm break of 0.8065 will resume the medium term rise and target 100% projection of 0.6826 to 0.7833 from 0.7328 at 0.8335.
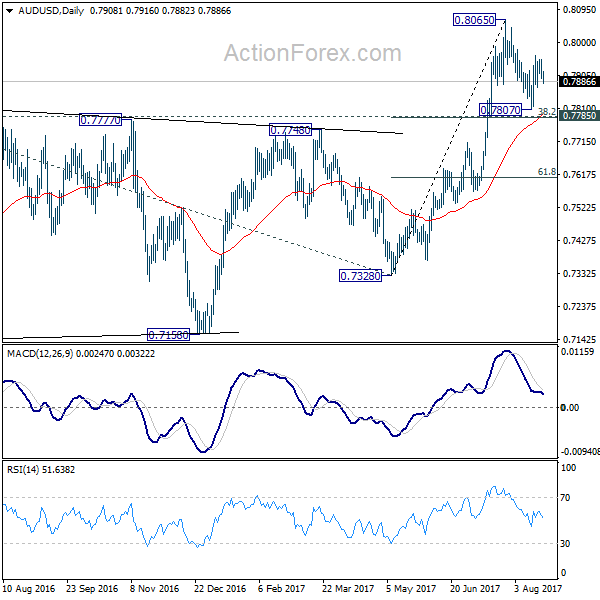
In the bigger picture, rise from 0.6826 medium term bottom is still in progress. At this point, there is no confirmation of trend reversal yet and we'll continue to treat such rebound as a corrective pattern. But in any case, break of 55 month EMA (now at 0.8097) will target 38.2% retracement of 1.1079 to 0.6826 at 0.8451. Break of 0.7328 support is needed to confirm completion of the rebound. Otherwise, further rise is now in favor.
USD/CAD Daily Outlook
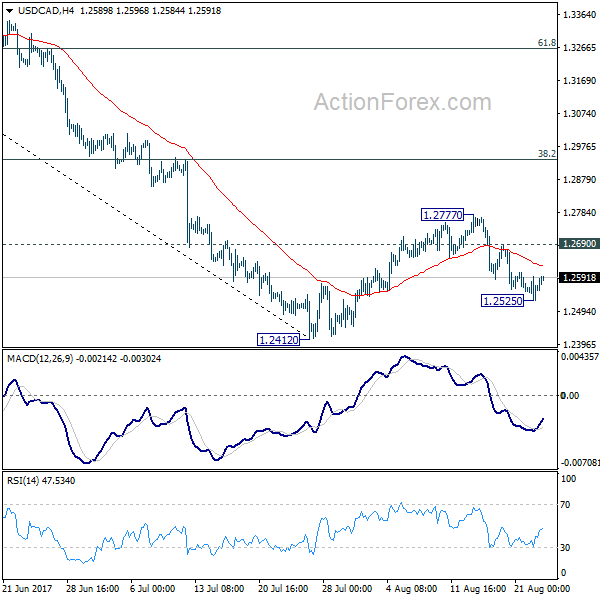
Daily Pivots: (S1) 1.2527; (P) 1.2560; (R1) 1.2596; More....
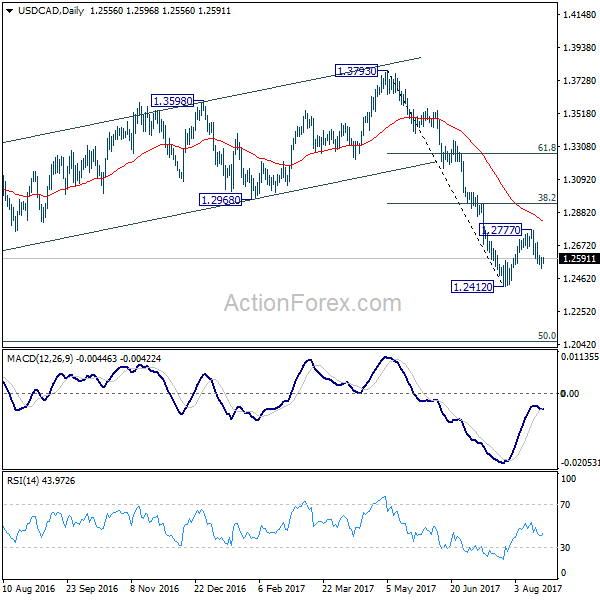
A temporary low is in place at 1.2525 in USD/CAD and intraday bias is turned neutral first. Deeper fall is expected as long as 1.2690 minor resistance holds. Below 1.2525 will target 1.2412 first. Break there will resume the larger decline and target next long term fibonacci level at 1.2048. On the upside, above 1.2690 will extend the correction from 1.2412 with another rise. But we'd expect upside to be limited by 38.2% retracement of 1.3793 to 1.2412 at 1.2940 to bring fall resumption eventually.
In the bigger picture, price actions from 1.4689 medium term top are seen as a correction pattern. Such corrective fall is still expected to extend to 50% retracement of 0.9406 to 1.4869 at 1.2048. At this point, we'd look for strong support from there to contain downside and bring rebound. Nonetheless, on the upside, sustained break of 1.2968, 38.2% retracement of 1.3793 to 1.2412 at 1.2940 will be the first sign of completion of the correction and will turn focus back to 1.3793 key resistance.
Sentiments Lifted by Renewed US Tax Reform Hope, But Dollar Yet to Confirm Trend Reversal
Markets sentiments were given a strong boost as the US appears to be breaking the tax reform deadlock. DOW closed up 196.14 points or 0.90%. S&P 500 also rose 24.14 points or 0.00% to close at 2452.51. 10 year yield gained 0.035 to close at 2.215, back above 2.2 handle. The development also gave the greenback a mild lift but there dollar index is held well below key near term resistance at 94.28. In the currency markets, EUR/USD is considered as staying in consolidation from 1.1908 and near term up trend is expected to resume sooner or later. USD/JPY is staying below 110.94 and recent fall from 114.49 is expected to extend too. There is no clear evidence for a trend reversal in Dollar yet.
House Speaker Ryan: Tax reform is far easier
In US, House Speaker Paul Ryan reiterated that tax reform is different from healthcare reform. The former is "far easier" to pass as Republicans, which is control of both the House and the Senate, have built a consensus. He added that, for the sake of procedural simplification, the entire tax reform bill could be rolled into one bill. Meanwhile, some media reports revealed that Trump's administration and congressional leaders have reached a consensus on how to reduce individual and corporate tax rates. They have also hammered out a more extensive reform plan which is more concrete and than the one released in July. Meanwhile, the market seemed to be more confident that US congress would be able to raise the debt ceiling and the government would not default on its debt.
Fed agreed to keep discount rate unchanged unanimously
Minutes of Fed's discount rate (not federal funds rate) meeting on July 25/26 showed that all of Fed's 12 regional banks decided to keep discount rate unchanged at 1.75%. The minutes showed that policy makers wanted to wait and "assess whether incoming data support the current outlook for continued moderate economic growth, some further strengthening in labor market conditions, and a gradual return of inflation to 2 percent over the medium term." The discount rate is the interest rate charged by Fed on collateralized loans. The more commonly referred federal funds rate is the interest rate on the overnight borrowing of reserves, the interest rate that depository institutions - banks, savings and loans, and credit unions - charge each other for overnight loans.
UK May softens stance on European Court of Justice
In UK, it's reported that Prime Minister Theresa May is softening her stance on EU Court in Brexit negotiation in hope of speeding up the process to trade agreements. May was clear with her stance that UK could "take back control of our laws and bring an end to the jurisdiction". But now, May said that UK will avoid European Court of Justice's "direct jurisdiction". That is seen as a compromise for ECJ to have some say in governing and any post Brexit dispute. And of course, there could still be some influence from ECJ on UK laws.
On the data front
Japan PMI manufacturing rose to 52.8 in August, up from 52.1 and beat expectation of 52.3. That's also the highest level in six months. Markit noted that expansion in the Japanese economy "continues to be supported by a mix of strengthened demand from both domestic and external sources: public work projects and stronger sales to South East Asia were both reported by panellists as areas of growth in August."
Eurozone PMIs will be the main feature in European session. US will also release PMIs and new home sales.
USD/CAD Daily Outlook
Daily Pivots: (S1) 1.2527; (P) 1.2560; (R1) 1.2596; More....
A temporary low is in place at 1.2525 in USD/CAD and intraday bias is turned neutral first. Deeper fall is expected as long as 1.2690 minor resistance holds. Below 1.2525 will target 1.2412 first. Break there will resume the larger decline and target next long term fibonacci level at 1.2048. On the upside, above 1.2690 will extend the correction from 1.2412 with another rise. But we'd expect upside to be limited by 38.2% retracement of 1.3793 to 1.2412 at 1.2940 to bring fall resumption eventually.
In the bigger picture, price actions from 1.4689 medium term top are seen as a correction pattern. Such corrective fall is still expected to extend to 50% retracement of 0.9406 to 1.4869 at 1.2048. At this point, we'd look for strong support from there to contain downside and bring rebound. Nonetheless, on the upside, sustained break of 1.2968, 38.2% retracement of 1.3793 to 1.2412 at 1.2940 will be the first sign of completion of the correction and will turn focus back to 1.3793 key resistance.
Economic Indicators Update
| GMT | Ccy | Events | Actual | Forecast | Previous | Revised |
|---|---|---|---|---|---|---|
| 0:30 | JPY | PMI Manufacturing Aug P | 52.8 | 52.3 | 52.1 | |
| 7:00 | EUR | France Manufacturing PMI Aug P | 54.5 | 54.9 | ||
| 7:00 | EUR | France Services PMI Aug P | 55.8 | 56 | ||
| 7:30 | EUR | Germany Manufacturing PMI Aug P | 57.7 | 58.1 | ||
| 7:30 | EUR | Germany Services PMI Aug P | 53.3 | 53.1 | ||
| 8:00 | EUR | Eurozone Manufacturing PMI Aug P | 56.3 | 56.6 | ||
| 8:00 | EUR | Eurozone Services PMI Aug P | 55.4 | 55.4 | ||
| 13:45 | USD | US Manufacturing PMI Aug P | 53.4 | 53.3 | ||
| 13:45 | USD | US Services PMI Aug P | 54.9 | 54.7 | ||
| 14:00 | USD | New Home Sales Jul | 610K | 610K | ||
| 14:00 | EUR | Eurozone Consumer Confidence Aug A | -2 | -2 | ||
| 14:30 | USD | Crude Oil Inventories | -8.9M |
Aussie Dollar Trading Lower In The Asian Session
For the 24 hours to 23:00 GMT, the AUD declined 0.31% against the USD and closed at 0.7912.
LME Copper prices rose 1.1% or $69.5/MT to $6584.0/MT. Aluminium prices rose 1.0% or $20.0/MT to $2104.5/MT.
Yesterday, in China, Australia’s largest trading partner, the leading economic index climbed 0.9% on a monthly basis in July. In the previous month, the index had advanced by a revised 1.7%.
In the Asian session, at GMT0300, the pair is trading at 0.7897, with the AUD trading 0.19% lower against the USD from yesterday’s close.
The pair is expected to find support at 0.7871, and a fall through could take it to the next support level of 0.7845. The pair is expected to find its first resistance at 0.7935, and a rise through could take it to the next resistance level of 0.7973.
The currency pair is trading below its 20 Hr and 50 Hr moving averages.

German Investor Confidence At 10-Month Low In August
For the 24 hours to 23:00 GMT, the EUR declined 0.38% against the USD and closed at 1.1764, pressured by a weaker-than-expected reading on investor confidence across the Euro-zone.
Data indicated that the Euro-zone’s ZEW economic sentiment index dropped more-than-anticipated to a level of 29.3 in August, hitting its lowest since April 2017, thus suggesting that a surge in the Euro may be denting investor confidence. The index had recorded a level of 35.6 in the prior month.
Separately, mood among German investor deteriorated to a ten-month low level of 10.0 in August, amid concerns over the nation’s growth outlook and emissions scandal engulfing the German automobile industry. The index had recorded a reading of 17.5 in the previous month, while markets had expected for a fall to a level of 15.0. On the other hand, the nation’s ZEW current situation index unexpectedly rose to a level of 86.7 in August, defying market expectations for a fall to a level of 85.2. In the previous month, the index had registered a reading of 86.4.
In the US, data indicated that the housing price index climbed 0.1% on a monthly basis in June, falling short of market consensus for a rise of 0.5% and posting the slowest pace of growth since November 2013. In the prior month, the index had recorded a rise of 0.4%. Meanwhile, the nation’s Richmond Fed manufacturing index remained steady at 14.0 in August, while investors had envisaged for a drop to a level of 10.0.
In the Asian session, at GMT0300, the pair is trading at 1.1763, with the EUR trading a tad lower against the USD from yesterday’s close.
The pair is expected to find support at 1.1734, and a fall through could take it to the next support level of 1.1706. The pair is expected to find its first resistance at 1.1802, and a rise through could take it to the next resistance level of 1.1842.
Moving ahead, investors will focus on the flash Markit manufacturing and services PMIs data for August across the Eurozone, slated to release in a few hours. Also, the Euro-zone’s flash consumer confidence data for August, due to release later in the day, will be on investors’ radar. Moreover, the US Markit manufacturing and services PMIs for August and new home sales data for July, scheduled to release later today, will garner significant amount of investor attention.
The currency pair is showing convergence with its 20 Hr moving average and trading below its 50 Hr moving average.

Britain’s Public Sector Net Borrowing Posted A Surplus In July
For the 24 hours to 23:00 GMT, the GBP declined 0.58% against the USD and closed at 1.2821.
On the data front, UK's public sector net borrowing has reported a surplus of £0.8 billion in July, as compared to a revised deficit of £5.7 billion in the prior month. Market participants were expecting public sector net borrowing to post a deficit of £0.3 billion.
Other economic data showed that the nation's CBI industrial trends total orders surprisingly advanced to a level of 13.0 in August, compared to a reading of 10.0 in the previous month.
In the Asian session, at GMT0300, the pair is trading at 1.2821, with the GBP trading flat against the USD from yesterday's close.
The pair is expected to find support at 1.2787, and a fall through could take it to the next support level of 1.2752. The pair is expected to find its first resistance at 1.2877, and a rise through could take it to the next resistance level of 1.2932.
Amid a lack of macroeconomic releases in the UK today, investors will look forward to global macroeconomic events for further direction.
The currency pair is showing convergence with its 20 Hr moving average and trading below its 50 Hr moving average.

Japan’s Manufacturing Sector Notches A 3-Month High Level In August
For the 24 hours to 23:00 GMT, the USD rose 0.64% against the JPY and closed at 109.71.
In the Asian session, at GMT0300, the pair is trading at 109.52, with the USD trading 0.17% lower against the JPY from yesterday's close.
Overnight data indicated that Japan's flash Nikkei manufacturing PMI rose to a level of 52.8 in August, expanding at its fastest pace in three months, as domestic as well as export orders rebounded. The PMI had recorded a level of 52.1 in the prior month.
The pair is expected to find support at 109.16, and a fall through could take it to the next support level of 108.81. The pair is expected to find its first resistance at 109.85, and a rise through could take it to the next resistance level of 110.19.
Going ahead, Japan's final machine tool orders for July, set to release in a while, will be eyed by investors.
The currency pair is showing convergence with its 20 Hr moving average and trading above its 50 Hr moving average.

Switzerland’s Trade Surplus Widened In July
For the 24 hours to 23:00 GMT, the USD rose 0.58% against the CHF and closed at 0.9684.
Macroeconomic data indicated that Switzerland's trade surplus widened more-than-anticipated to a level of CHF3.51 billion in July, from a revised trade surplus of CHF2.76 billion posted in the previous month. Market participants had expected the nation's trade surplus to widen to a level of CHF2.88 billion.
In the Asian session, at GMT0300, the pair is trading at 0.9682, with the USD trading marginally lower against the CHF from yesterday's close.
The pair is expected to find support at 0.9640, and a fall through could take it to the next support level of 0.9598. The pair is expected to find its first resistance at 0.9711, and a rise through could take it to the next resistance level of 0.9740.
The currency pair is trading above its 20 Hr and 50 Hr moving averages.

Canada’s Retail Sales Posted A Modest Rise In June
For the 24 hours to 23:00 GMT, the USD marginally rose against the CAD and closed at 1.2567.
On the economic front, Canada's retail sales rose 0.1% MoM in June, lower than market expectations for a rise of 0.2%. Retail sales had recorded a revised rise of 0.5% in the previous month.
In the Asian session, at GMT0300, the pair is trading at 1.2577, with the USD trading 0.08% higher against the CAD from yesterday's close.
The pair is expected to find support at 1.2537, and a fall through could take it to the next support level of 1.2497. The pair is expected to find its first resistance at 1.2606, and a rise through could take it to the next resistance level of 1.2635.
The currency pair is showing convergence with its 20 Hr and 50 Hr moving averages

Elliott Wave View: USDJPY Turning Lower
Short term USDJPY Elliott wave view suggest that the decline from 7/11 peak is unfolding as a double three Elliott wave structure. Decline to 108.71 low ended Minor wave W and Minor wave X bounce ended at 110.95 peak. Subdivision of Minor wave Y is unfolding as a Zigzag structure. Minute wave ((w)) of ((Y) ended at 108.59 low and Minute wave ((x)) of (Y) bounce is proposed complete at 109.82.
However, a break below 108.59 is needed to add conviction to this view. Until then a double correction in Minutte wave ((x)) can’t be ruled out. Near term, as far as pivot from 110.95 peak stays intact, expect pair to extend lower in Minute wave ((y)) or pullback in 3 waves at least. We don’t advise buying the pair and expect more downside in the pair towards 107.46-106.92 area next before a bounce is seen.
USDJPY 1 Hour Elliott Wave Chart
Double Three is the most important pattern in Elliott wave’s new theory and probably the most common pattern in the market these days. Double three is also known as a 7-swing structure. It is a very reliable pattern that gives traders a good opportunity to trade with a well-defined level of risk and target areas. The image below shows what Elliott Wave Double Three looks like. It has labels (W), (X), (Y) and an internal structure of 3-3-3. This means that all 3 legs has corrective sequences. Each (W) and (Y) is formed by 3 wave oscillations and has a structure of A, B, C or W, X, Y of smaller degrees.