Sample Category Title
NZD/USD Head And Shoulders?
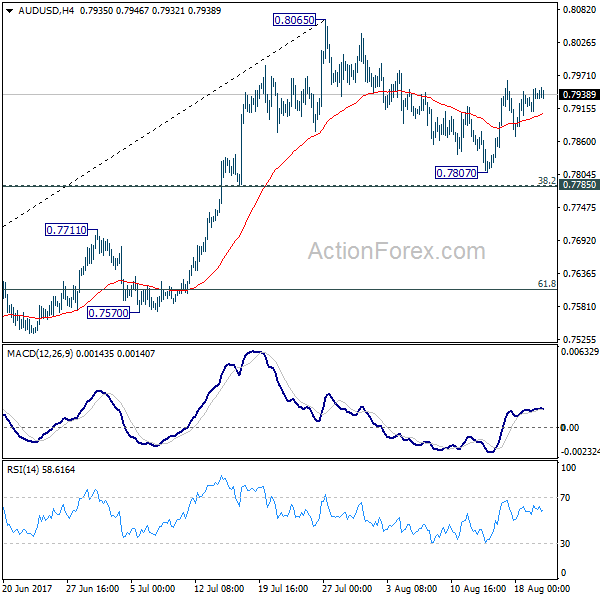
Price drops right now after the retest of the fourth warning line (wl4) of the former ascending pitchfork. Technically is expected to drop on the short term, at least till will hit the 38.2% retracement level. NZD/USD is developing a Head and Shoulders pattern on the Daily chart, will be confirmed after a valid breakdown below the Neckline (red line).
GBP/JPY Downside Paused
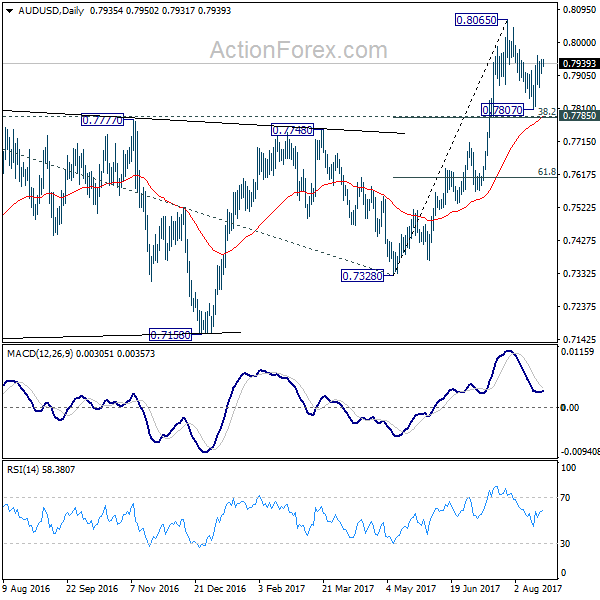
Price increased a little and is trying to retest the median line (ml) of the minor descending pitchfork. The next downside target remains at the first warning line (WL1) of the major ascending pitchfork. Only a failure to retest this level will signal a rebound towards the 150% Fibonacci line (ascending dotted line). However, a breakdown will confirm a major drop, but is premature to say what will happen because Nikkei has opened with a gap up in the morning and is fighting hard to recover after the yesterday’s massive drop.
EUR/USD Changed Little
The EUR/USD has decreased a little in the morning as the USDX has managed to rebound. The currency pair maintains a bullish perspective on the daily chart, but we may have a minor consolidation before will resume the upside movement. Needs to recapture more directional energy to be able to climb above the 1.1909 previous high.
USD has dragged the pair lower, but this could be only temporary as the dollar index is expected to drop deeper on the short term. The USDX stays above the 93.00 psychological level above the 92.94 previous low, a drop towards the 92.55 swing low is possible if will close below these levels.
The German ZEW Economic Sentiment will be released later and is forecasted to decrease from 17.5 to 14.8 points, while the Euro-zone ZEW Economic Sentiment could decrease from 35.6 to 34.2 points. On the other hand, is to release the HPI and the Richmond Manufacturing Index in the afternoon.
Price decreased a little, but is somehow expected to resume the upside movement. Has found strong support at the 1.1712 downside obstacle and now could move in range before will start another significant move. Only a failure to close above the 1.1909 will signal an exhaustion and a potential reversal on the short term. However, a retest of the median line (ml) will signal a further increase in the upcoming period, the next major upside target will be at the 1.2037 level.
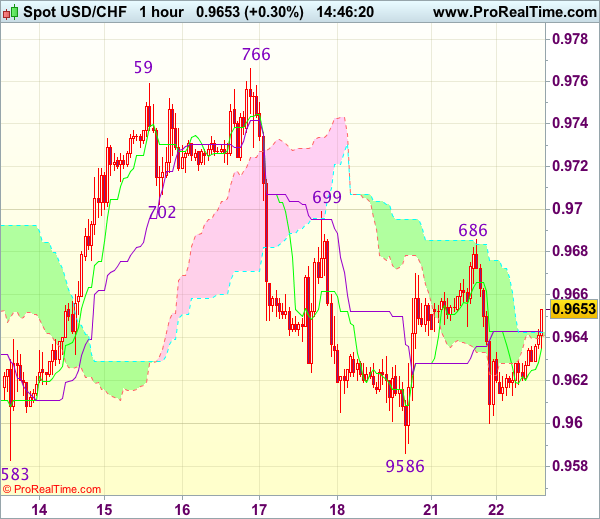
Trade Idea : USD/CHF – Stand aside
USD/CHF - 0.9649
Most recent candlesticks pattern : N/A
Trend : Sideways
Tenkan-Sen level : 0.9638
Kijun-Sen level : 0.9643
Ichimoku cloud top : 0.9643
Ichimoku cloud bottom : 0.9641
New strategy :
Stand aside
Position : -
Target : -
Stop : -
As the greenback has rebounded again after finding support at 0.9600, retaining our view that further consolidation above support at 0.9583 would take place, however, still reckon resistance at 0.9686 would limit upside and bring another decline, below 0.9600 would bring test of said support at 0.9583 but break there is needed to retain bearishness and signal another leg of decline from 0.9773 is underway for further weakness to 0.9550, then 0.9515-20 which is likely to hold from here.
In view of this, would not chase this fall here and would be prudent to stand aside for now. Above said resistance at 0.9686 would bring test of 0.9699 but only break there would signal the fall from 0.9766 has ended and bring a stronger rebound to 0.9725-30 first.
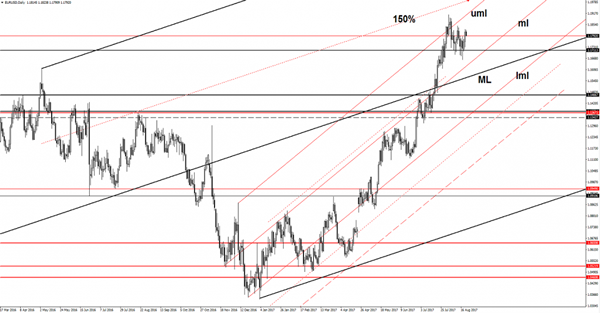
Technical Outlook: EURUSD Lower In Asia, Broken Bear T/L Expected To Hold
The Euro edged lower in Asia on Tuesday after previous day's rally and close above 1.1800 barrier. The single currency came under pressure on comments from president Trump who said that US would stay on course on military support to Afghanistan that inflated US dollar. With negative impact on dollar over geopolitical tensions in the Korean peninsula fading, focus turns towards Trump's plans for tax cut. Traders hope that president Trump could recover from political setback in the recent weeks and set the stage for tax cut plan after US Congress starts after summer break. Jackson Hole symposium is also in focus as the key event this week, with markets awaiting comments from two top central bankers, Fed chief Janet Yellen and ECB's President Mario Draghi, for stronger signals about policies of central banks. Technical studies for the EURUSD pair remain bullish, with Monday's break and close above bear trendline from 1.1910 peak, seen as bullish signal. Broken bear-trendline marks good support at 1.1776, followed by broken daily Tenkan-sen at 1.1754, above which extended downticks should find support to keep near-term bulls in play. Also, the pair is establishing above weekly 200SMA (1.1758) after showing hesitation to break it clearly in past three weeks. Weekly close above 200SMA will be an additional bullish signal. Release of German and EU ZEW economic sentiment data is the key release for Euro. Both indicators are forecasted lower in August (German 15.0 vs 17.5 and EU 34.2 vs 35.6) which would risk further Euro's easing on release at / below forecasts.
Res: 1.1815, 1.1828, 1.1846, 1.1889
Sup: 1.1776, 1.1754, 1.1731, 1.1708
Investors On The Sidelines Ahead Of Jackson Hole Summit
U.S. equity markets kicked off the week on a positive note, ending a two-day fall which sent the S&P 500 to its lowest levels since 11 July - total declines of 2.6% from the 2,490.9 peak were recorded on 8 August. The low trading volumes on Wall Street indicate that investors are still uncertain as to where to head next, and many have been hedging their portfolios by adding gold. According to the latest data from the Commodity Futures Trading Commission, net-long positions rose to their highest levels since October 2016, and gold ETFs have seen some decent inflows so far this month. However, the precious metal continues to be challenged by the $1,300 resistance level, where it has failed on two occasions this year to break through. If gold gathers momentum and manages to close the week above $1,300, I believe we'll be seeing another leg higher, with a potential to test 2016 highs around $1,375.
It seems the political turmoil in Washington will keep investors on edge for now. The clashes with North Korea, divisions within the Congress, debt ceiling negotiations and the ability to implement longawaited tax and stimulus measures, will all play a significant role in where markets go next. However, it's evident that investors will remain on the defensive for some time.
This week's key event continues to be the Jackson Hole Economic Policy Symposium. Euro traders managed to push the single currency above 1.18 yesterday, on expectations that the ECB's President might announce a shift in policy. On this date five years ago, Mario Draghi delivered his famous "whatever it takes" speech. During the following ECB meeting, a new plan for buying bonds from Eurozone countries was announced, and since then, the monetary policy has been slackening. This time, investors are expecting Mr. Draghi to take the opposite direction and announce the beginning of policy normalization. While the Euro has already priced in much of the policy shift, an official announcement will provide further support. However, I expect Mario Draghi to choose his words very carefully, and he probably won't provide a clear roadmap on what's coming next. Even when the ECB starts normalizing policy, it will be very slow and not a significant shift. This is why I expect a slight pullback in the Euro from current levels, but given the recent strength in Eurozone data, I would still prefer to buy the dips than sell the rallies.
USDCAD Extends Bearish Run, Falls To 2-Week Low
USDCAD is showing little sign of ending the current bearish run that began on August 15, with the pair hitting a 2-week low of 1.2546 earlier today. This low is just below the 61.8% Fibonacci retracement level of the July-August uptrend from 1.2413 to 1.2777.
Technical indicators remain in bearish area with the MACD deep below zero and still declining. However, the stochastics are in oversold territory and the %D line is attempting to cross above the %K line, suggesting a possible easing of the downside momentum.
Should we see an upside push, resistance will likely come from the 50% Fibonacci retracement level of 1.2595, followed by the 38.2% Fibonacci level at 1.2638. Further up, the 200- and 50-period moving averages (currently at 1.2655 and 1.2668, respectively) could stand in the way of prices reaching the 23.6% Fibonacci level at 1.2690.
If the pair fails to hold above the 61.8% Fibonacci support level of 1.2552, further losses would lead the way towards the 78.6% Fibonacci level of 1.2491. A break below this mark would clear the way to July’s 2-year trough of 1.2413. A breach of this low would signal a resumption of the longer-run downtrend that began in May and reinforce the bearish outlook in the medium term.
GBPUSD Risk Remains To The Downside, Neutral Phase In Near-Term
GBPUSD has been trading sideways since breaking below its 50-day moving average last week. The shift to a more neutral stance follows a prior range that was capped at the key 1.3000 level after a decline from the multi-month high of 1.3267 reached on August 3.
The pair has been trading between two important Fibonacci retracement levels of the rise from 1.2588 to 1.3267. The 50% Fibonacci at 1.2927 is capping the top of the range while the 61.8% Fibonacci is providing support at 1.2845.
Only a break of 1.2927 (50% Fibonacci) and a rise above the 50-day MA would ease downside pressure to target 1.3000. This is a strong resistance level and a break of this would shift the focus back to the upside for a re-test of 1.3267.
The near-term bias is expected to remain neutral with further range trading as RSI is moving sideways. But since the indicator is below 50 in bearish territory and MACD is falling, another leg lower cannot be ruled out yet. A break below the 5-week low touched last Friday at 1.2831 would increase downside momentum with scope to test the key 1.2800 level ahead of 1.2720. From here the 200-day MA and 1.2588 low come into view as potential targets.
The overall risk remains to the downside and the bearish move from 1.3267 is still intact.
Dollar Firms Up In Humdrum Market, Oil Rises On Tightening US Supply
In an uneventful trading during the Asian session due to the absence of any economic data releases, the dollar edged up. The dollar index, which measures the greenback's value against a basket of six major currencies inched up 0.12% to last trade at 93.21. Oil prices rose amid indications that supply is tightening.
Looking at reactions in the forex market, the dollar strengthened against most majors. Euro/dollar fell just below the $1.18 mark to last trade at $1.1795. The pound weakened and was trading at $1.2872 ahead of the European open. The greenback strengthened against the yen with the pair trading at 109.29 yen, erasing all of its yesterday's losses. This signals that geopolitical anxiety has temporarily eased and market participants are now fully focused on the events in the second part of the week.
European Central Bank President Mario Draghi is due to speak on Wednesday in Germany and will join Federal Reserve Chair Janet Yellen in the Fed's conference starting on Thursday. While many news reports have warned the markets that the two central bankers will likely not reveal anything new about their respective monetary policy outlooks, traders will still be focused on their speeches for any potential clues.
In a relatively quiet trading week, some of the key data releases that are expected later in the day include the German ZEW economic sentiment index, CBI industrial orders for the UK and monthly core retail sales in Canada. The Vice-President of ECB's Vitor Constancio is due to speak at 12:00 GMT.
Economists are expecting the German ZEW economic sentiment index to show a slowdown in Germany's economy. The index gauges the six-month economic outlook and its August forecasts stand at 15, down from 17.5 recorded in July. Current conditions also look to have cooled down as the estimates predict a reading of 85.5, below the prior's months reading of 86.4. Any surprise to the upside could be supportive for the euro.
Oil prices gained during Asian trading on signs that supply is tightening, especially in the US. These indications will be put to test in the late US session when the American Petroleum Institute publishes statistics on crude inventories and refinery operations for the week of August 14. Should the report show a fall in inventories, oil prices could find support for a further boost. WTI was last trading at $47.64 a barrel and Brent was at $51.96.
Gold weakened during today's first session of the day to last trade at $1,285.26 an ounce.
AUD/USD Daily Outlook
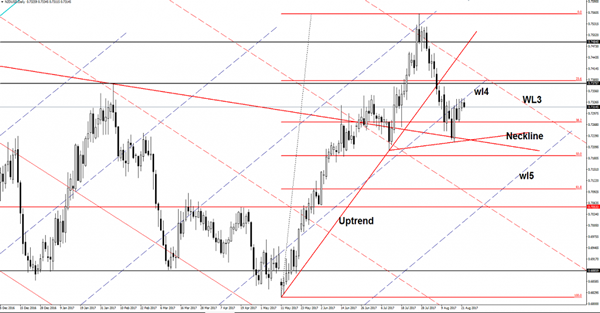
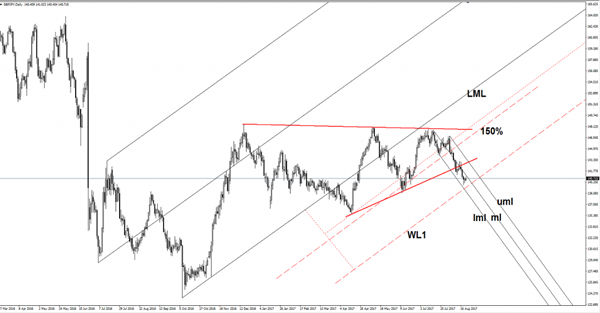
Daily Pivots: (S1) 0.7917; (P) 0.7934; (R1) 0.7956; More...
Intraday bias in AUD/USD remains mildly on the upside for retesting 0.8065. The pull back from there should have completed at 0.7807 already. Firm break of 0.8065 will resume the medium term rise and target 100% projection of 0.6826 to 0.7833 from 0.7328 at 0.8335. In case of another fall, we'd continue to expect strong support from 0.7785 cluster support (38.2% retracement of 0.7328 to 0.8065 at 0.7783) to contain downside and bring rebound.
In the bigger picture, rise from 0.6826 medium term bottom is still in progress. At this point, there is no confirmation of trend reversal yet and we'll continue to treat such rebound as a corrective pattern. But in any case, break of 55 month EMA (now at 0.8097) will target 38.2% retracement of 1.1079 to 0.6826 at 0.8451. Break of 0.7328 support is needed to confirm completion of the rebound. Otherwise, further rise is now in favor.