Sample Category Title
Candlesticks and Ichimoku Trade Ideas Performance Update
6 positions were entered among all 4 currency pairs with total profit of 30 points and the positions are listed below:
11 Aug : EUR/USD - Long at 1.1790, exited at 1.1770 (- 20 points)
15 Aug : USD/JPY - Short at 110.10, exited at 110.30 (- 20 points)
16 Aug : EUR/USD - Short at 1.1755, exited at 1.1755 ( 0 point )
17 Aug : USD/JPY - Long at 110.00, exited at 110.05 (+ 5 points)
17 Aug : USD/CHF - Long at 0.9680, exited at 0.9645 (- 35 points)
18 Aug : EUR/USD - Long at 1.1715, exited at 1.1815 (+ 100 points)
| JPY EUR CHF GBP
Jan + 167 - 85 - 10 + 50
Feb + 200 +150 +93 - 59
Mar -23 -70 -23 - 35
Apr + 65 + 93 + 50 - 40
May - 65 - 35 + 100 -175
Jun -100 -10 - 10 +175
Jul + 85 - 35 - 8
Aug + 60 +145 + 60 -35
Sep
Oct
Nov
Dec
Y-T-D + 388 +148 +252 -109
Dollar Gathers Tailwinds as White House Departures Continue
Steve Bannon, known as the brain power behind Trump's nationalistic ideology, has mutually agreed to exit the position of the Chief Strategist at the White House on Friday, extending the list of people departing from the Trump's inner circle. With the board of directors being replaced frequently, as never happened before, uncertainty around Trump's administration has been escalating, dragging the dollar into further losses.
Following numerous resignations last weekend, with the CEO of two business councils leaving their positions in protests against the president's reaction to the Charlottesville violence, the chaos inside the White House continued with Steve Bannon leaving his role as the President's Chief Strategist on Friday. That was three weeks after Antony Scaramucci was fired as a communications director and Reince Priebus resigned from his position of Chief of Staff.
Bannon was said to hold a strong influence on Trump's nationalistic and populist views, supporting some of the recent controversial policies including the travel ban on people from several Muslim-majority countries, the US withdrawal from the Paris climate accord and the pullout of the Trans-Pacific Partnership trade agreement. Besides that, Bannon was recently working on hardline restrictions on a Chinese bilateral trade deal, incentivizing investigations into Chinese intellectual property practices. Although Bannon seemed to be on Trump's side, his departure was mainly attributed to his far-right ideas which contradicted the democratic views of the other White House members, including the head of the National Economic Council, Gary Cohn, as well as to the hostile language he used against the Democrats following the violent incident in Virginia.
As the political turmoil in the US heightens, Trump appears to lose supporters from key states which helped him win the elections last November. According to an NBC/ Marist poll published on Sunday, Trump's approval rating dropped below 40% in Michigan, Pennsylvania, and Wisconsin. However, his administration is currently trying to restore confidence by bringing tax reforms back to the table. If this turns successful, the President would put his first check mark on his economic agenda.
Turning to the reaction in the forex markets, the recent unexpected reshufflings in the White House and the Fed's potential pause on rising interest rates weighed on the dollar on Monday, relative to the previous week's closing. The dollar index, which gauges the dollar's strength against a basket of currencies, fell by 0.27% to 93.05 in the late European trading hours. Dollar/yen sank by 0.40% to 108.70, while dollar/euro jumped by 0.43% to an intra-day high of 1.1809. Pound/dollar gained 0.22%, rising to 1.2908.
USD/CAD Targeting New Lows
USD/CAD opened with a gap down in the morning and looks determined to take out another support level. Is trading in the green right now even if the USDX is going down aggressively after another failure to take out the 93.81 static resistance.
USDX is approaching the 93.00 psychological level and the 92.94 previous low, will drop towards the 92.55 swing low if will close below these levels. We may still have a sideways movement above the 92.49 static resistance before will start another significant move.
USD/CAD is pressuring a dynamic support, a breakdown will open the door for more declines on the short term.
The Loonie lost some ground versus the USD in the last two hours as the Canadian Wholesale Sales dropped by 0.5%, even if the economists have forecasted a 0.6% growth. It is pressuring the fourth warning line (wl4) of the former minor ascending pitchfork. We'll see what will happen because has retested the median line (ml), but a breakdown below the wl4 will send the rate towards the 1.2460 major static support.
Only a rejection from here will signal a bullish movement which could ignore the upper median line (uml) of the minor descending pitchfork and the median line (ML) of the major descending pitchfork.
You can see that I've drawn a major black ascending pitchfork, the rate could come even to retest the lower median line before will climb much above the1.2777 previous high.
EUR/USD Turned To The Upside
The EUR/USD is trading in the green and resumes the Friday's bullish candle. The upside momentum is natural as the USDX is trading in the red and looks too heavy to be stopped at this moment. It is trading near the 1.1820 level and could hit fresh new high till the end of the day. The next upside target is at the 1.1846 previous high, could be attracted by the upper median line (uml) as well. Will resume the upward swing if will have enough energy to close above the 1.1909 previous high.
EUR/GBP Strongly Bullish
Price goes higher and is targeting new high as the EUR is very strong on the short term. The European currency increased versus all its rivals in the last hours despite the lack of high impact data. Price is attracted by the upper median line (UML) of the major ascending pitchfork and by the 0.9226 static support. A valid breakdown will signal a further increase on the medium term.
Euro Extended Advance from Daily Low at 1.1731
The Euro extended advance from daily low at 1.1731 (early European session low) broke above important barriers at 1.1765 (converged 10/20SMA) and 1.1785 (bear-trendline off 02 Aug peak at 1.1910) to dent psychological 1.1800 barrier (also 4-hr clod top).
Close above bear-trendline will be bullish signal with lift above 1.1815 (Fibo 61.8% of 1.1910/1.1662 pullback) seen as confirmation.
Broken 10/20SMA now initial support (1.1765), with 30SMA (1.1687) underpinning and guarding Friday's low at 1.1662.
EU PMI data on Wednesday and Jackson Hole Thu/Sat meeting are the key events this week.
Res: 1.1815; 1.1846; 1.1889; 1.1910
Sup: 1.1765; 1.1731; 1.1708; 1.1687
Demand for Yen Remains Strong
The focus of the market remains on the political situation in the US where Donald Trump recently fired his political strategist Steve Bannon hoping to improve the political situation. The American president is losing support amongst both business circles and Congress due to the lack of reforms which have been promised during elections. Another issue that traders are keeping a close eye on is the geopolitical tension between the USA and North Korea. Recent military drills by South Korea and the US may provoke the North Korean leader to new actions that traditionally sends investors into risk-off mode.
The euro today is growing after a confident statement from the German central bank, according to which economic growth remains strong at 2.5% on an annual basis on the background of rising exports. Investors are waiting for the statement by the Fed's chairwoman, Janet Yellen, at the economic symposium in Jackson Hole on Friday. This event is one the most important economic forums in the world – at previous sympsosiums central banks have made key announcements regarding monetary policies.
The GBP/USD keeps consolidating on the background of a weaker US dollar and negotiations on the Brexit terms with European Union. The increase of the pair was also restrained by the fall of the Rightmove house price index in the UK that declined by 0.9% in August after an increase of 0.1% in July.
The Japanese yen is still in demand as a safe haven asset due to uncertainty stemming from the political crisis surrounding Trump and the potential conflict between North Korea and the US. However, we do not exclude a price correction soon. All industries activity index in Japan increased by 0.4% in July after declining by 0.8% in the previous month.
EUR/USD
The EUR/USD is soaring and may reach the upper limit of the descending channel and resistance at 1.1800. Overcoming of these levels may become a strong stimulus for bulls to accelerate purchases. In this case the target levels will be 1.1900 and 1.1200. Optimism about growth prospects will be restrained by the RSI being in the overbought zone on the 15-minute chart. The closest targets if the pair changes direction are 1.1700 and 1.1620.
GBP/USD
The GBP/USD has left the limits of the local descending channel and keeps moving around 1.2890. If we see a switch to a positive trend, potential targets could go up to 1.3050 and 1.3250, but first the quotes will need to overcome the closest resistance at 1.2950. On the other side, the descending movement will be restrained by the support line at 1.2800.
USD/JPY
The USD/JPY is moving along the sloping resistance line. Fixing below the support at 108.85 may become the trigger for continued bearish dynamics with potential drops to 108.00 and 106.60. The RSI on the 15-minute chart is close to the oversold zone and this points to a possible rebound. Growth is likely if the price manages to gain a foothold above 109.60. The first goals in this case will be at 110.30 and 111.00.
EUR/USD Starts Week With Gains
EUR/USD has edged higher in the Monday session. Currently the pair is trading at 1.1815, up 0.45% on the day. On the release front, it's a very quiet start to week, so we're unlikely to see any significant movement from the pair on Monday. There are no US releases, and the sole euro zone event is the Deutsche Bundesbank monthly bulletin. On Tuesday, Germany releases ZEW Economic Sentiment, which is expected to slow to 15.3 points.
The euro took a dip on Thursday, following a terrorist attack in Barcelona, which killed 13 and wounded dozens. EUR/USD dropped below the 1.17 line and touched 3-week lows. However, the euro has quickly recovered, and is trading at 1.18. Barring any geopolitical crises, such as another terrorist attack, we can expect a few slow days until the Jackson Hole summit on Wednesday. Both the ECB and Federal Reserve find themselves pursuing a less accommodative monetary policy, and the markets will be listening closely to Janet Yellen and Mario Draghi. Will Yellen hint at a December rate hike? Will Draghi provide clues regarding the windup of the ECB's asset-purchases program? Any comments in this vein could be seized upon by the markets and trigger strong movement by the euro. This was the case in June, when Draghi spoke at a central bankers meeting in Portugal, and his upbeat comments about the euro zone economy sent the euro soaring.
The US economy remains strong, but political risk in the US has been rising, as the Trump administration continues to spend most of its focus and energy on damage control. The deadly alt-right protest in Charlottesville was a disaster for the White House, as Trump's belated condemnation of white supremacists and his insistence on blaming the violence on both the white supremacists and the counter-protesters drew wall-to-wall criticism from both Democrat and Republican lawmakers. Trump remains defiant and continues to attack his critics, but the events around Charlottesville have only served to tarnish his image and raised growing concerns about his presidency.
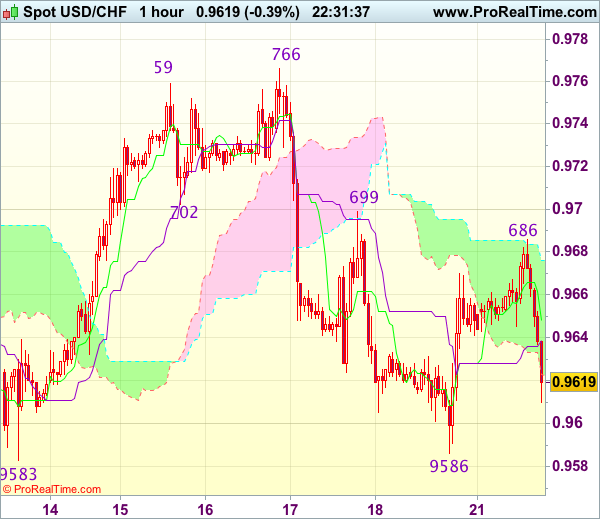
Trade Idea Wrap-up: USD/CHF – Stand aside
USD/CHF - 0.9616
Most recent candlesticks pattern : N/A
Trend : Sideways
Tenkan-Sen level : 0.9643
Kijun-Sen level : 0.9643
Ichimoku cloud top : 0.9676
Ichimoku cloud bottom : 0.9622
New strategy :
Stand aside
Position : -
Target : -
Stop : -
Although the greenback has dropped quite sharply today after meeting resistance at 0.9686 and test of previous support at 0.9583 cannot be ruled out, break there is needed to retain bearishness and signal another leg of decline from 0.9773 is underway for further weakness to 0.9550, then 0.9515-20 which is likely to hold on first testing.
In view of this, would not chase this fall here and would be prudent to stand aside for now. Above the Kijun-Sen (now at 0.9643) would bring another bounce towards 0.9686 but break of resistance at 0.9699 is needed to signal the fall from 0.9766 has ended and bring a stronger rebound to 0.9725-30 first.
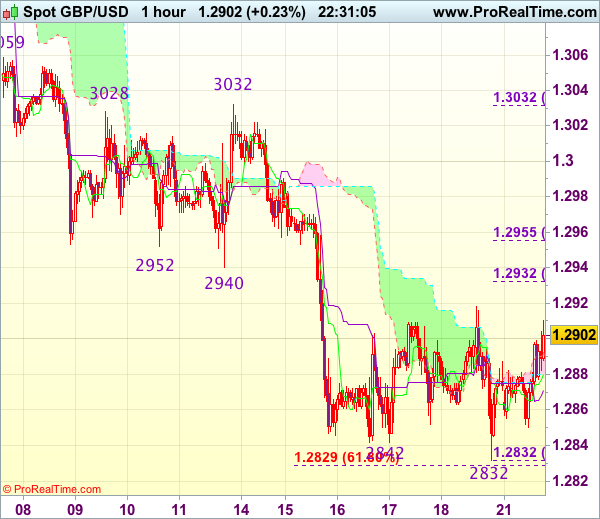
Trade Idea Wrap-up: GBP/USD – Stand aside
GBP/USD - 1.2906
Most recent candlesticks pattern : N/A
Trend : Near term down
Tenkan-Sen level : 1.2884
Kijun-Sen level : 1.2875
Ichimoku cloud top : 1.2887
Ichimoku cloud bottom : 1.2880
Original strategy :
Sell at 1.2935, Target: 1.2835, Stop: 1.2970
Position : -
Target : -
Stop : -
New strategy :
Stand aside
Position : -
Target : -
Stop : -
As cable has staged a strong rebound after marginal fall to 1.2832, suggesting consolidation above this level would be seen and another corrective bounce to 1.2932-33 (50% Fibonacci retracement of 1.3032-1.2832 and previous support) is likely, above there would suggest a temporary low has possibly been formed, bring a stronger rebound to 1.2955-60 (61.8% Fibonacci retracement) but reckon 1.2990-00 would hold from here.
On the downside, below 1.2870 would bring weakness to 1.2850 but break of said support at 1.2832 is needed to signal recent decline has resumed and extend weakness to 1.2800 and possibly towards 1.2770. As near term outlook is mixed, would be prudent to stand aside in the meantime.