
Sample Category Title
ECB Minutes From The July Meeting Are Set To Be Released Today
Market movers today
In the euro area, the ECB minutes from the July meeting are set to be released today. Focus will remain on discussions related to extension of the QE programme. At the meeting, the Governing Council was unanimous in setting no precise date for when to discuss changes to the QE programme and additionally, Draghi said the ECB had not tasked its staff to look into QE options after December. In light of this, it will be interesting to see how the discussion within the Governing Council has evolved around extending QE (see ECB review: QE path not defined yet but slower purchases are coming, 20 July 2017 ).
The UK retail sales figures for July are out today, which markets tend to pay at tention to, although they can be misleading with regard to the overall condition of private consumption. However, due to declining consumer confidence and negative real wage growth, we believe that the figures will reflect only modest growth in private consumption.
In the US, today's data releases include the initial jobless claims and industrial production numbers for July as well as the Philly Fed business conditions index. Additionally, Dallas Fed President Kaplan (voter, dovish) speaks this evening.
Selected market news
Risk appetite took a small hit yesterday as news broke that Trump's CEO Business Council was breaking up. The decision came after a conference callon Wednesday among the members on which 10 more members voted to leave the council. Trump's reversal at his press briefing on Tuesday about the events in Charlot tesville last week seemed to be the trigger for most members. At the press briefing on Tuesday Trump stated once again that ‘both sides' were responsible for the events. The latest development has also spurred further speculation that some top officials may leave the administ ration. US bond yields fell back in response to the news and stocks gave up early gains to finish broadly unchanged.
FOMC minutes yesterday revealed a discussion heavily focused on inflation with differing views with some expressing concern over the low inflation while others highlighted a risk of an overshoot later if the labour market continued to tighten. Most members still believe in the Phillips curve framework, although recent developments have raised uncertainty. On the reduction of t he balance sheet " participants generally agreed that , in light of their current assessment of economic conditions and the out look, it was appropriate to signal that implement ation of the program likely would begin relatively soon".
According to a Reuters report yesterday, ECB president Mario Draghi will not deliver a new policy message at the Jackson Hole symposium next week. According to the report , two sources said that Draghi was keen to hold off on the policy discussion until the autumn, as agreed at the last ECB rate-setting meeting in July.
On the North Korean crisis South Korean President Moon Jae-in said Donald Trump had agreed to ask for consent before taking any action such as a military strike. This reduces further the risk of a war on the Korean Peninsula.
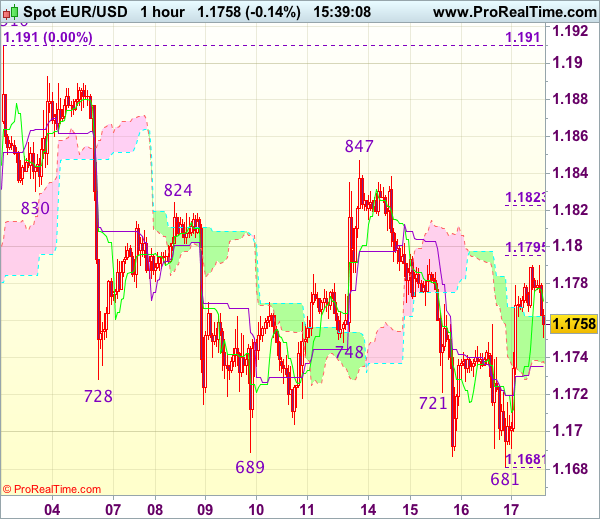
Trade Idea : EUR/USD – Stand aside
EUR/USD - 1.1763
Most recent candlesticks pattern : N/A
Trend : Sideways
Tenkan-Sen level : 1.1771
Kijun-Sen level : 1.1736
Ichimoku cloud top : 1.1763
Ichimoku cloud bottom : 1.1738
Original strategy :
Sold at 1.1755, stopped at break-even
Position : - Short at 1.1755
Target : -
Stop : - 1.1755
New strategy :
Stand aside
Position : -
Target : -
Stop : -
Although the single currency extend marginal weakness to 1.1681 yesterday, the subsequent rebound on dollar’s broad-based retreat after FOMC suggests a temporary low has been formed there and upside risk is seen for gain to 1.1795-00 (50% Fibonacci retracement of 1.1910-1.1681) and possibly 1.1820-25 (61.8% Fibonacci retracement), however, resistance at 1.1847 should hold.
On the downside, whilst pullback to 1.1730-35 cannot be ruled out, reckon downside would be limited and said support at 1.1681 should remain intact. Only a break below this support would revive bearishness and extend the fall from 1.1910 to 1.1640-50 (50% Fibonacci retracement of 1.1370-1.1910 and previous support). As near term outlook is mixed, would be prudent to stand aside for now.
Trade Idea : USD/JPY – Exit long entered at 110.00
USD/JPY - 110.05
Most recent candlesticks pattern : N/A
Trend : Near term up
Tenkan-Sen level : 109.90
Kijun-Sen level : 110.31
Ichimoku cloud top : 110.59
Ichimoku cloud bottom : 110.10
Original strategy :
Bought at 110.00, Target: 111.00, Stop: 109.65
Position : - Long at 110.00
Target : - 111.00
Stop : - 109.65
New strategy :
Exit long entered at 110.00
Position : - Long at 110.00
Target : -
Stop : -
Despite yesterday’s marginal rise to 110.95, the subsequent selloff on dollar’s broad-based weakness, dampening our bullishness and suggesting the rebound from 108.73 has ended at 110.95, hence downside risk is seen for weakness to 109.60, then test of support at 109.42, however, as broad outlook remains consolidative, reckon downside would be limited to 109.00-05 and said support at 108.73 should remain intact.
In view of this, would be prudent to exit long entered at 110.00 and stand aside for now. Above the Kijun-Sen (now at 110.31) would bring recovery to the upper Kumo (now at 110.60), however, price should falter below said resistance at 110.95, bring another retreat later.

Fed Minutes Leave Market Indecisive
Dollar Dropped On The Weak Data. Dollar slid after downbeat U.S. economic data, the lack of resolve from the FOMC and Trump's fallout. The building permits and housing starts figures tumbled as survey revealed that homebuilders are finding it more difficult to find skilled workers to complete the jobs and that the rising cost of materials is also weighing on profitability. After the release of the FOMC minutes dollar bulls were disappointed to find out that Fed officials were still unable to set a date for the runoff. Adding salt to the dollar's wounds was the fallout from Trump's response to the events in Charlottesville.
CAD Rallies As Fed Minutes And Trump Pressure USD. The Canadian dollar rebounded against greenback from a one-month low hit the day before, driven by a broad-based retreat in the U.S. dollar on the back of Federal Reserve concerns over inflation.
Oil Falls On Glut Concerns. Crude oil tumbled nearly 2% as the Energy Information Administration's latest report showed that US domestic production hit its highest level in two years. Market participants have been concerned that rising production in North America will continue to counterbalance OPEC and Russia's efforts to freeze output to support oil prices.
Market Update – Asian Session: USD Under Pressure After Fed Minutes
Asia Summary
Asian equity markets opened mixed before falling to the downside, again the stand out is the Kospi rising 0.5%. Fed meeting minutes weighed on the dollar in the session, as the outlook on inflation remains subdued. South Korea President Moon affirmed that nothing would happen with North Korea without South Korea’s approval. Onshore yuan gained over 0.3%, the largest advance in 1-week after China govt data showed that outflows have eased. The USD/CNY had its first strengthening in 3 days by 0.1% to 6.6709. Market had little reaction the Japan trade figures, most of Japan, including the Nikkei, has been under pressure from the stronger yen. Australia employment figures gave some strength to the A$ before giving most of it back later in the session. In Australia Telstra reported results and suspended its dividend reinvestment plan, sending the stock down over 8%, this weighed on the ASX200 of which it is a major component. Earnings continue to ramp up in China and Hong Kong with property and retail names showing positive results, tech players will look ahead to Lenovo, reporting on Friday.
Key economic data
(AU) AUSTRALIA JULY EMPLOYMENT CHANGE: +27.9K V +20.0KE (5TH CONSECUTIVE INCREASE); UNEMPLOYMENT RATE: 5.6% V 5.6%E
(NZ) NEW ZEALAND Q2 PPI INPUT Q/Q: 1.4% V 0.8% PRIOR; PPI OUTPUT Q/Q: 1.3% V 1.4% PRIOR
(JP) JAPAN JULY TRADE BALANCE: ¥418.8B V ¥327.1BE; ADJ TRADE BALANCE: ¥337.4B V ¥195.3BE
(SG) SINGAPORE JULY NON-OIL DOMESTIC EXPORTS M/M: -2.5% V -0.4%E; Y/Y: 8.5% V 9.1%E; ELECTRONIC EXPORTS Y/Y: 16.3% V 15.0%E
(PH) PHILIPPINES Q2 GDP Q/Q: 1.7% V 1.9%E; Y/Y: 6.5% V 6.4%E
(AU) Australia Jul RBA Govt FX Transactions (A$): -1.03B v -1.12B prior
Speakers and Press
China/Hong Kong
(CN) China Hebei province to meet capacity cutting targets by end of September - Chinese press
(CN) China National Development and Reform Commission (NDRC): expect prices to be stable in H2
Korea
(KR) South Korea President Moon: Critical to address minimum wage and stability in housing; Only S Korea can decide any military option on peninsula - 100 day press conference
Taiwan
(TW) Taiwan planning to reshuffle cabinet in Sept - Taiwan press
Asian Equity Indices/Futures (00:00ET)
Nikkei -0.1%, Hang Seng -0.1%, Shanghai Composite +0.4%, ASX200 0.0%, Kospi +0.5%
Equity Futures: S&P500 -0.1%; Nasdaq100 -0.2%, Dax -0.1%, FTSE100 +0.1%
FX ranges/Commodities/Fixed Income (00:00ET)
EUR 1.1790-1.1765; JPY 110.16-109.66; AUD 0.7949-0.7922; NZD 0.7330-0.7303
Dec Gold +0.8% at $1,292/oz; Sept Crude Oil +0.3% at $46.91/brl; Sept Copper +0.3% at $2.97/lb
USD/CNY *(CN) PBOC SETS YUAN REFERENCE RATE AT: 6.6709 V 6.6779 PRIOR
(CN) China PBoC OMO injects CNY100B v CNY280B in 7 and 14-day reverse repos; injects net CNY50B v CNY180B prior
USD/PHP (PH) Philippines Economic Planning Sec Pernia: See no reason for concern on peso, its unlikely to gyrate wildly, will curb volatility
JGB (JP) Japan MoF sells ¥4.38T v ¥4.4T offered in 3-month bills; avg yield -0.1275%; bid-to-cover 5.21x
JGB (JP) Japan MoF sells ¥1.81T v ¥2.2T offered in 0.1% JGBs; avg yield -0.0830%; bid-to-cover 4.46x
Equities notable movers
Hong Kong/China
Tencent, 700.HK Reports Q2 (CNY) Net 18.2B v 13.5Be, Rev 56.6B v 52.9Be; +5.3%
Cathay Pacific, 293.HK Reports Q1 (HK$) Net -2.1B (1st loss in ~20-yrs) v -1.2Be; Rev 45.9B v 45.7B y/y; +1.5%
Australia
Telstra, TLS.AU Reports FY17 Net A$3.89B v A$3.82Be; EBITDA A$10.7B v A$10.5B y/y; Rev A$26.0B v A$26.7B y/y; suspends dividend reinvestment plan; -8.5
Godfreys,GFY.AU Reports FY17 Underlying Net A$5.9M v A$9.2M y/y; EBITDA A$14.1M v A$17.5M y/y; Rev A$174.1M v A$179.3M y/y; +16.7%
RungePincockMinarco,RUL.AU Guides FY17 Rev A$74.7M v A$57.1M y/y; +15.6%
Australia’s Jobless Rate Fell In July
For the 24 hours to 23:00 GMT, the AUD rose 1.33% against the USD and closed at 0.7925.
LME Copper prices rose 0.8% or $51.0/MT to $6433.0/MT. Aluminium prices rose 0.9% or $19.0/MT to $2075.0/MT.
In the Asian session, at GMT0300, the pair is trading at 0.7932, with the AUD trading 0.09% higher against the USD from yesterday's close, on the back of robust Australian jobs data.
Early morning data showed that Australia's seasonally adjusted unemployment rate fell to 5.6% in July, in line with market expectations, as the economy added jobs at a faster pace. Unemployment rate had registered a revised level of 5.7% in the preceding month.
The pair is expected to find support at 0.7856, and a fall through could take it to the next support level of 0.7779. The pair is expected to find its first resistance at 0.7979, and a rise through could take it to the next resistance level of 0.8025.
The currency pair is trading above its 20 Hr and 50 Hr moving averages.

Euro-Zone’s Economy Expanded As Expected In The Three Months To June
For the 24 hours to 23:00 GMT, the EUR rose 0.32% against the USD and closed at 1.1778, after the second estimate of the Euro-zone's seasonally adjusted flash gross domestic product (GDP) advanced 0.6% on a quarterly basis in the second quarter of 2017, confirming the preliminary print, thus suggesting that the economy retained its momentum in the second quarter. In the previous quarter, the region's GDP had registered a revised rise of 0.5%.
The US Dollar lost ground against its major counterparts, after minutes of the Federal Reserve's (Fed) latest monetary policy meeting showed that policymakers were divided on raising interest rate again this year.
According to minutes, some officials remained increasingly wary over recent softness in inflation and called for halting interest rate hikes until it was clear that the recent softness in inflation is transitory, while some argued that such a delay could cause an eventual overshooting in inflation, provided a tightening labour market. Further, it also indicated that the central bank was poised to begin paring back its $4.5 trillion balance sheet as soon as September.
The US Dollar extended losses, aided by fresh political uncertainty in the US after the dissolution of a pair of business advisory groups by the US President, Donald Trump, after several CEOs stepped down from his advisory panels to protest his comments about violence in Charlottesville, Virginia.
On the data front, housing starts in the US unexpectedly dropped 4.8% on monthly basis, to an annual rate of 1155.0K in July, defying market expectations for an advance to a level of 1220.0K. Housing starts had recorded a revised level of 1213.0K in the prior month. Moreover, the nation's building permits eased more-than-anticipated by 4.1% on a monthly basis, to an annual rate of 1223.0K in July, compared to market consensus for it to drop to a level of 1250.0K. Building permits had registered a revised level of 1275.0K in the prior month.
On the other hand, the nation's mortgage applications climbed 0.1% in the week ended 11 August 2017, after recording a rise of 3.0% in the prior week.
In the Asian session, at GMT0300, the pair is trading at 1.1783, with the EUR trading marginally higher against the USD from yesterday's close.
The pair is expected to find support at 1.1713, and a fall through could take it to the next support level of 1.1644. The pair is expected to find its first resistance at 1.1821, and a rise through could take it to the next resistance level of 1.1860.
Investors will now pay attention to the European Central Bank's latest meeting minutes, along with the region's final consumer price index for July and trade balance for June, all slated to release in a few hours.
The currency pair is trading above its 20 Hr and 50 Hr moving averages.

Britain’s ILO Unemployment Rate Surprisingly Declined In The Three Months To June
For the 24 hours to 23:00 GMT, the GBP rose 0.21% against the USD and closed at 1.2894, following upbeat jobs report from the UK.
Data showed that Britain's ILO unemployment rate unexpectedly dropped to 4.4% in the three months to June, highlighting that the nation's jobs growth remains on a solid footing despite an overall slowdown in economic growth. Meanwhile, market participants were expecting the ILO unemployment rate to remain steady at 4.5% registered in the March-May period. Also, the nation's average earnings including bonus climbed 2.1% on an annual basis in the April-June period, topping market consensus for a gain of 1.8% and following a revised rise of 1.9% in the three months to May.
In the Asian session, at GMT0300, the pair is trading at 1.2902, with the GBP trading 0.06% higher against the USD from yesterday's close.
The pair is expected to find support at 1.2860, and a fall through could take it to the next support level of 1.2817. The pair is expected to find its first resistance at 1.2927, and a rise through could take it to the next resistance level of 1.2951.
Moving ahead, market participants will focus on Britain's retail sales data for July, set to release in a few hours.
The currency pair is trading above its 20 Hr and 50 Hr moving averages.

Japan’s Adjusted Merchandise Trade Surplus Sharply Widened In July
For the 24 hours to 23:00 GMT, the USD declined 0.46% against the JPY and closed at 110.09.
In the Asian session, at GMT0300, the pair is trading at 109.84, with the USD trading 0.23% lower against the JPY from yesterday's close, after overnight data showed that Japan's adjusted merchandise trade surplus widened more-than-anticipated to a level of ¥337.4 billion in July, as exports continued to increase, while market participants had anticipated for a surplus of ¥195.3 billion. In the preceding month, the nation had posted a revised surplus of ¥87.3 billion.
The pair is expected to find support at 109.36, and a fall through could take it to the next support level of 108.87. The pair is expected to find its first resistance at 110.64, and a rise through could take it to the next resistance level of 111.43.
The currency pair is trading below its 20 Hr and 50 Hr moving averages.

Swiss Franc Trading Higher In The Morning Session
For the 24 hours to 23:00 GMT, the USD declined 0.74% against the CHF and closed at 0.9652.
In the Asian session, at GMT0300, the pair is trading at 0.9646, with the USD trading 0.06% lower against the CHF from yesterday’s close.
The pair is expected to find support at 0.9603, and a fall through could take it to the next support level of 0.9561. The pair is expected to find its first resistance at 0.9727, and a rise through could take it to the next resistance level of 0.9809.
The currency pair is trading below its 20 Hr and 50 Hr moving averages.
