Sample Category Title
Loonie Trading On A Stronger Footing This Morning
For the 24 hours to 23:00 GMT, the USD declined 0.99% against the CAD and closed at 1.2627.
In the Asian session, at GMT0300, the pair is trading at 1.2612, with the USD trading 0.12% lower against the CAD from yesterday’s close.
The pair is expected to find support at 1.2556, and a fall through could take it to the next support level of 1.2499. The pair is expected to find its first resistance at 1.2717, and a rise through could take it to the next resistance level of 1.2821.
Ahead in the day, traders will look forward to Canada’s manufacturing shipments data for June.
The currency pair is trading below its 20 Hr and 50 Hr moving averages.

European Open Briefing: Most Of The Asian Equity Markets Continued To Rise On Thursday
Global Markets:
- Asian stock markets: Nikkei lost 0.10 %, Shanghai Composite rose 0.44 %, Hang Seng rose 0.2 %, ASX up 0.1 %
- Commodities: Gold at $1293.46 (+ 0.82%), Silver at $17.12 (+ 1.09 %), WTI Oil at $46.89 (+0.24 %), Brent Oil at $50.52 (+0.51 %)
- Rates: US 10-year yield at 2.3, UK 10-year yield at 1.10, German 10-year yield at 0.43
News & Data:
- AUD Employment Change 27.9 K vs 19.8 K expected
- AUD Unemployment Rate 5.6 % vs 5.6 % expected
- GBP Average Earnings Index 3 m/y 2.1 % vs 1.8 % expected
- GBP Claimant Count Change -4.2 K vs 3.2 K expected
- GBP Unemployment Rate 4.4 % vs 4.5 % expected
- USD Building Permits 1.22 M vs 1.25 M expected
- USD Crude Oil Inventories -8.9 M vs -3.0 M expected
- NZD PPI Input q/q 1.4 % vs 0.9 % expected
- Dollar on defensive after Fed minutes dampen rate hike prospects- RTRS
- U.S. talks tough on trade deficit as NAFTA discussions begin- RTRS
Markets Update:
Most of the Asian equity markets continued to rise on Thursday as tensions between the U.S. and North Korea continue to simmer down. It was a weaker dollar story in Asia today following on from the slides overnight.
AUD/USD added close to 0.2 percent to highs of 79.49 U.S. cents after the country added 27,900 jobs in July, beating expectations for an increase of 20,000. The currency had surged 1.3 percent after the Fed minutes sent the U.S. dollar lower.
USD/JPY lost over a 100 pips from the highs of 110.94. The Yen seemed to show some early signs of stability around the round number 110.00, but continued to drop again in Tokyo until 109.60, losing over 0.7 % in value since Wednesday.
EUR/USD rose 0.1 percent against the US Dollar to $1.17835, extending its 0.3 percent gain overnight, after the euro zone's second-quarter growth was revised to 2.2 percent from a year earlier, from 2.1 percent previously.
Upcoming Events:
- 08:20 GMT – (AUD) RBA Assist Gov Ellis Speaks
- 08:30 GMT – (GBP) Retail Sales m/m
- 09:00 GMT – (EUR) Final CPI y/y
- 11:30 GMT – (EUR) ECB Monetary Policy Meeting Accounts
- 12:30 GMT – (CAD) Manufacturing Sales m/m
- 12:30 GMT – (USD) Unemployment Claims
- 12:30 GMT – (USD) Philly Fed Manufacturing Index
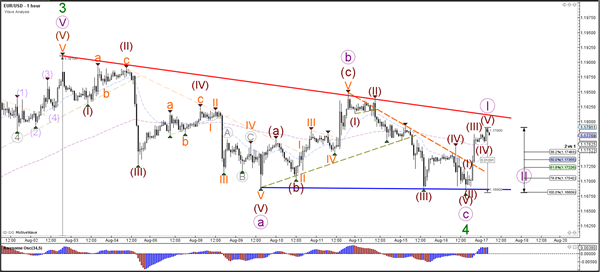
Daily Technical Analysis: EUR/USD Completes Zigzag And Uptrend Challenges Resistance At 1.18
Currency pair EUR/USD
The EUR/USD showed a strong bullish 4 hour candle at the support trend lines (green/blue), which indicates the potential completion of the wave 4 (green) correction. A break above the resistance trend line (red) increases the chance for a wave 5 (green) breakout.
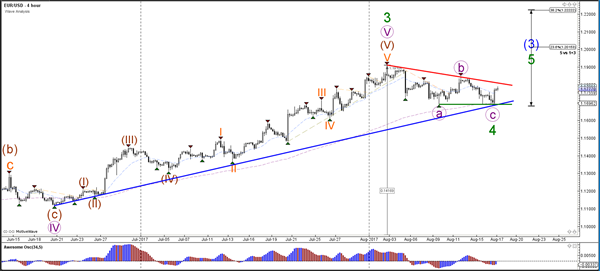
The EUR/USD seems to have completed a wave 4 and 5 (brown) within wave C (purple). The bullish bounce also offers 5 waves which could complete wave 1 (purple).
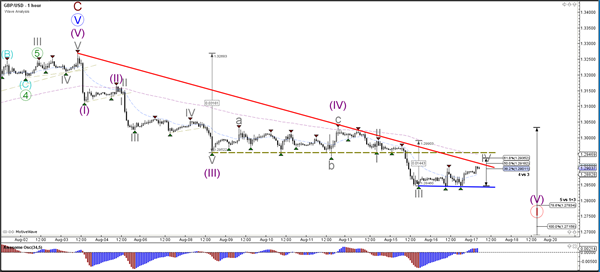
Currency pair GBP/USD
The GBP/USD is testing the resistance trend line (red). A bullish break should start a wave 2 (red) correction whereas a bearish bounce could still indicate the continuation of wave 5 of wave 1 (red).
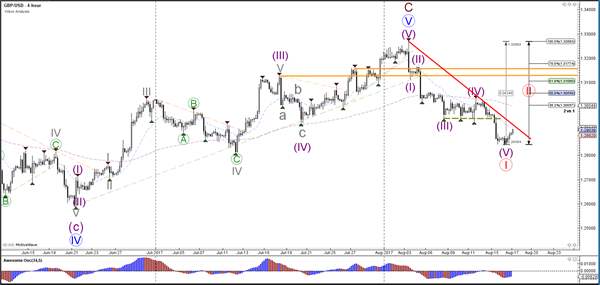
The alternative structure is that the GBP/USD is building a wave 4 (grey) within the downtrend. This scenario is invalidated if price manages to break above the resistance trend line (red) and 61.8% Fib of wave 4 vs 3.
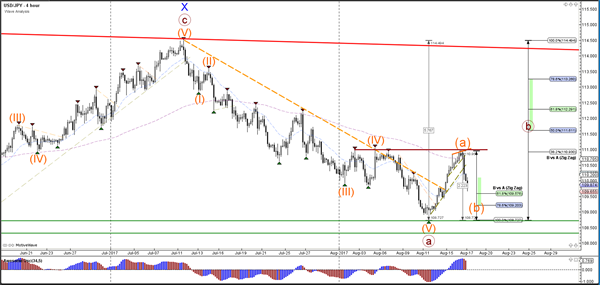
Currency pair USD/JPY
The USD/JPY turned at the 38.2% Fibonacci resistance level which completed a potential wave A (orange). The bearish price action could be part of an ABC within wave B (brown). The invalidation level of the wave B is the 100% Fib level of wave B vs A at 108.73
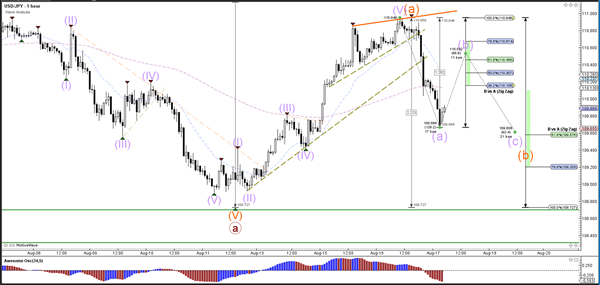
The USD/JPY showed bearish momentum which could be a wave A (purple) within a larger ABC of wave B (orange). The invalidation level of the wave A is the 100% Fib level of wave B vs A at 110.95.
Daily Technical Outlook And Review: EUR/USD, GBP/USD, AUD/USD, USD/JPY, USD/CAD, USD/CHF, DOW 30, GOLD
A note on lower timeframe confirming price action...
Waiting for lower timeframe confirmation is our main tool to confirm strength within higher timeframe zones, and has really been the key to our trading success. It takes a little time to understand the subtle nuances, however, as each trade is never the same, but once you master the rhythm so to speak, you will be saved from countless unnecessary losing trades. The following is a list of what we look for:
- A break/retest of supply or demand dependent on which way you're trading.
- A trendline break/retest.
- Buying/selling tails ... essentially we look for a cluster of very obvious spikes off of lower timeframe support and resistance levels within the higher timeframe zone.
- Candlestick patterns. We tend to only stick with pin bars and engulfing bars as these have proven to be the most effective.
We typically search for lower-timeframe confirmation between the M15 and H1 timeframes, since most of our higher-timeframe areas begin with the H4. Stops are usually placed 1-3 pips beyond confirming structures.
EUR/USD
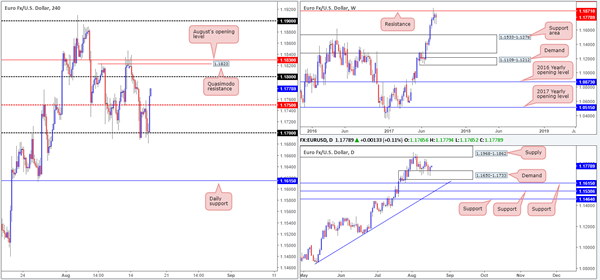
Following a minor breach of the 1.17 threshold during yesterday's NY segment, the single currency aggressively advanced higher. Influenced by the latest FOMC meeting minutes, the major ended the day closing above the H4 mid-level resistance at 1.1750. This – coupled with back-to-back buying tails seen printed from within a daily demand at 1.1650-1.1733, suggests further upside may be possible.
On the H4 timeframe, the 1.18 handle, followed closely by a Quasimodo resistance at 1.1823 and August's opening level at 1.1830, are the next notable areas of resistance to keep an eyeball on. Over on the daily timeframe, the next upside target can be seen at a supply drawn from 1.1968-1.1862. The weekly timeframe on the other hand, exhibits seller weakness at the moment. Since connecting with resistance at 1.1871 two weeks ago, there has been little bearish intent registered from here..
Suggestions: Near-term, entering long in this market is challenging due to the nearby H4 resistances mentioned above. In regard to selling, we see very little of interest at this time. With that, our team's position will remain flat going into today's sessions.
Data points to consider: EUR final CPI y/y at 10am, ECB Monetary policy meeting accounts at 12.30pm. US weekly unemployment claims at 1.30pm, followed later by FOMC member Kaplan speaking at 5.30pm GMT+1.
Levels to watch/live orders:
- Buys: Flat (stop loss: N/A).
- Sells: Flat (stop loss: N/A).
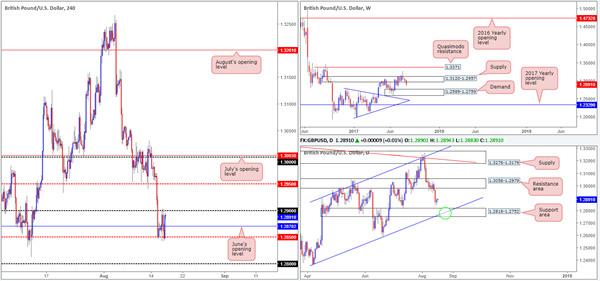
GBP/USD
After Tuesday's impulsive downside move, the H4 candles spent yesterday's segment ranging between the 1.29 handle and the mid-level support at 1.2850. To our way of seeing things, this is not a buyers' market at the moment. On the bigger picture, the daily support area at 1.3058-1.2979 recently gave way; leaving downside free to potentially challenge the daily support area pegged at 1.2818-1.2752 (converges with a daily channel support extended from the low 1.2365). Further supporting the bears, the weekly timeframe shows space for the market to trade as far down as the demand area coming in at 1.2589-1.2759.
As stated in Wednesday's report, shorting this market sub 1.2850 is challenging. Positioned only 30 pips beneath this number is the top edge of the aforementioned daily support area, followed closely by the 1.28 handle drawn on the H4 chart.
Suggestions: On account of the above, we are looking for the market to challenge the current daily support area and its fusing channel support (green circle). It will be from this point that we'll begin hunting for long opportunities on the H4 timeframe and lower.
Data points to consider: UK retail sales at 9.30am. US weekly unemployment claims at 1.30pm, followed later by FOMC member Kaplan speaking at 5.30pm GMT+1.
Levels to watch/live orders:
- Buys: 1.2818-1.2752 is interesting for long opportunities.
- Sells: Flat (stop loss: N/A).
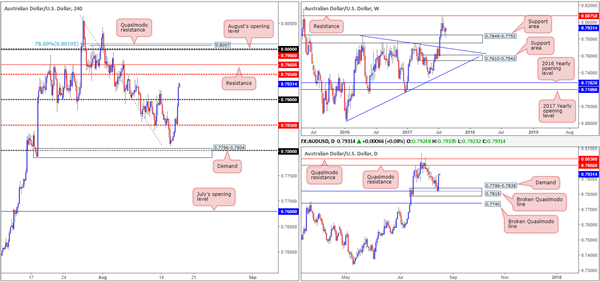
AUD/USD:
Don't you just love it when that happens! For those of you who are regular readers you may recall that we set a pending buy order at 0.7805, with a stop-loss order tucked beneath H4 demand (0.7786-0.7804) at 0.7784. Price came within two pips of our order and has since rallied over 100 pips! Our reasoning for this trade call was due to the following structures:
The weekly candles recently came into contact with a support area marked at 0.7849-0.7752.
The daily timeframe also showed price interacting with a demand at 0.7786-0.7838, which encased a broken Quasimodo level at 0.7819.
The 0.78 handle is seen housed within the current H4 demand.
Moving forward, we can see that a decline in US housing data coupled with a technically strong Aussie, forced the commodity currency beyond 0.79 into the closing bell. On the H4 timeframe, the next upside targets can be seen around the mid-level resistance at 0.7950, shadowed closely by resistance at 0.7968. Over on the higher timeframes, however, upside looks relatively free until we reach the daily Quasimodo resistance planted at 0.7988.
Suggestions: Although both the weekly and daily charts suggest that this is a buyers' market right now, we're not willing to buy into the noted H4 resistances. Instead, we have our eye on the large psychological band 0.80 for potential shorts. Supporting this level is August's opening level at 0.7998, a H4 78.6% Fib resistance level at 0.8010 (taken from the high 0.8065), a H4 Quasimodo resistance at 0.8007 and the aforementioned daily Quasimodo resistance.
As weekly price shows room for the unit to trade beyond this zone up to resistance pegged at 0.8075, we would strongly advise waiting for a H4 bearish rotation candle (preferably in the shape of a full-bodied candle) to form from here, before pulling the trigger.
Data points to consider: Australian employment figures at 2.30am, followed by RBA assist Gov. Ellis speaking at 9.20am. US weekly unemployment claims at 1.30pm, followed later by FOMC member Kaplan speaking at 5.30pm GMT+1.
Levels to watch/live orders:
- Buys: Flat (stop loss: N/A).
- Sells: 0.80 region ([waiting for a reasonably sized bearish candle to form– in the shape of either a full, or near-full-bodied candle – is advised] stop loss: ideally beyond the candle's wick).
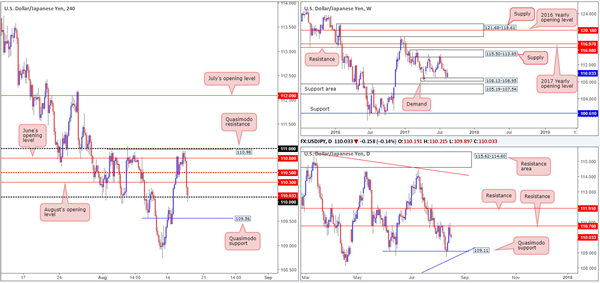
USD/JPY
In recent trading, the USD/JPY fell sharply after the FOMC meeting minutes triggered a broad-based dollar selloff. This left the unit free to challenge the 110 handle, which, as you can see, is taking place as we write. Although buyers are beginning to show interest from here, it's difficult to judge whether this will transpire in to anything tradable. Granted, the move from this number has the backing of a weekly demand base seen at 108.13-108.95, but down on the daily timeframe, price shows room to move down as far as 109.11: a Quasimodo support.
Suggestions: To be quite honest, we're not too impressed by this market at the moment.
A long from 110 not only places you against potential daily sellers, but also August's opening level at 110.30.
With 110 holding firm at the moment and a H4 Quasimodo support seen below that at 109.56, alongside possible weekly buyers from demand, a sell is just as challenging.
Data points to consider: US weekly unemployment claims at 1.30pm, followed later by FOMC member Kaplan speaking at 5.30pm GMT+1.
Levels to watch/live orders:
- Buys: Flat (stop loss: N/A).
- Sells: Flat (stop loss: N/A).
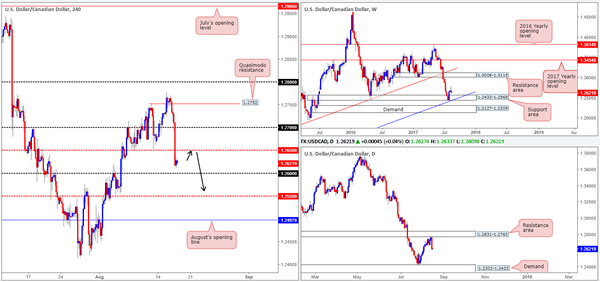
USD/CAD
The USD/CAD spent yesterday's sessions easing from the 1.2750 region, taking out both the 1.27 handle and the H4 mid-level support at 1.2650. Influenced by the latest FOMC meeting minutes and bolstered by a daily resistance area coming in at 1.2831-1.2763, the next level of interest on the H4 chart can be seen at 1.26. With that being said, however, we do not feel 1.26 will offer much in the way of support. Our reasoning behind this comes down to the two following points:
Daily action shows room to trade as far down as the demand area coming in at 1.2303-1.2423.
The top edge of weekly demand does not come into view until we reach 1.2569.
Suggestions: Put simply, we're looking for the H4 candles to retest 1.2650 as resistance. This – coupled with a H4 bearish rotation candle in the shape of either a full, or near-full-bodied candle, would, in our opinion, be enough to suggest a short, targeting 1.2569, followed closely by H4 mid-level support at 1.2550.
Data points to consider: US weekly unemployment claims at 1.30pm, followed later by FOMC member Kaplan speaking at 5.30pm. Canadian manufacturing sales at 1.30pm GMT+1.
Levels to watch/live orders:
- Buys: Flat (stop loss: N/A).
- Sells: 1.2650 region ([waiting for a reasonably sized bearish candle to form– in the shape of either a full, or near-full-bodied candle – is advised] stop loss: ideally beyond the candle's wick).
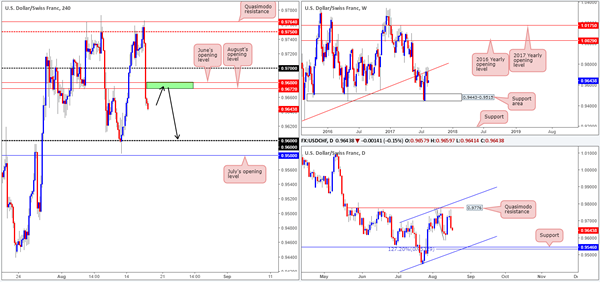
USD/CHF:
Going into the early hours of US trading yesterday, the H4 candles penetrated the mid-level resistance at 0.9750 and challenged a Quasimodo resistance seen at 0.9764. It was from this point that the US dollar began spiraling south. With the help of the latest FOMC meeting minutes, the pair ended the day slipping below both the 0.97 handle as well as June and August's opening levels at 0.9680/0.9672.
Having seen the weekly trendline resistance (extended from the low 0.9257) continue to hold firm, H4 price may look to drive lower and connect with the 0.96 handle today. Also of particular interest is the daily timeframe. The chart shows room for the pair to trade as far down as support coming in at 0.9546, which happens to unite with a channel support etched from the low 0.9438 and a AB=CD 127.2 Fib ext. at 0.9532.
Suggestions: Consequent to the above findings, our team has their eye on the 0.9680/0.9672 green H4 area for possible shorts (June and August's opening levels). A retest of this region, alongside a H4 bearish rotation candle in the shape of either a full, or near-full-bodied candle, would, in our opinion, be enough to suggest a short, targeting 0.96 as the initial take-profit line.
Data points to consider: US weekly unemployment claims at 1.30pm, followed later by FOMC member Kaplan speaking at 5.30pm GMT+1.
Levels to watch/live orders:
- Buys: Flat (stop loss: N/A).
- Sells: 0.9680/0.9672 region ([waiting for a reasonably sized bearish candle to form – in the shape of either a full, or near-full-bodied candle – is advised] stop loss: ideally beyond the candle's wick).
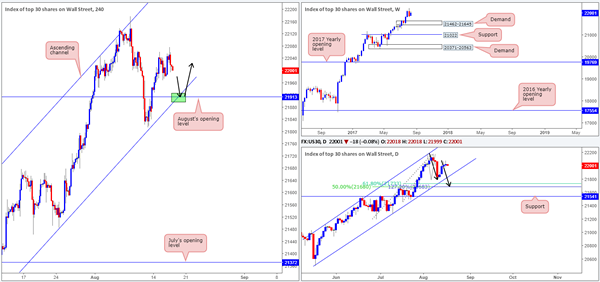
DOW 30:
During the course of yesterday's segment, we saw the daily chart print its second consecutive selling wick. This could, should the bears move into a higher gear, bring the index down to a channel support line extended from the low 20494, followed closely by an AB=CD (black arrows) 127.2% Fib ext. at 21683. Also worth noting here is the converging 61.8% Fib support at 21733 taken from the low 21462, and 50% support line at 21680 drawn from the low 21192.
Near term, however, we can see H4 price trading nearby a channel support line extended from the low 21273, which fuses with August's opening level at 21913 (green zone). As noted in yesterday's report, we do not see any higher-timeframe resistances on the horizon at the moment. Therefore, a retest of August's opening level, alongside the aforementioned H4 channel support would, in our humble view, be a nice area to consider entering long from.
Our suggestions: As you are probably already aware trendlines are unfortunately prone to being faked, so we would highly recommend being patient and waiting for a H4 bullish candle to take shape in the form of a full, or near-full-bodied candle. This will, of course, not guarantee that the level will hold, but what it will do is show bullish intent from a potential buy zone!
Data points to consider: US weekly unemployment claims at 1.30pm, followed later by FOMC member Kaplan speaking at 5.30pm GMT+1.
Levels to watch/live orders:
- Buys: 21913 region ([waiting for a reasonably sized H4 bullish candle to form – in the shape of either a full, or near-full-bodied candle – is advised] stop loss: ideally beyond the candle's tail).
- Sells: Flat (stop loss: N/A).
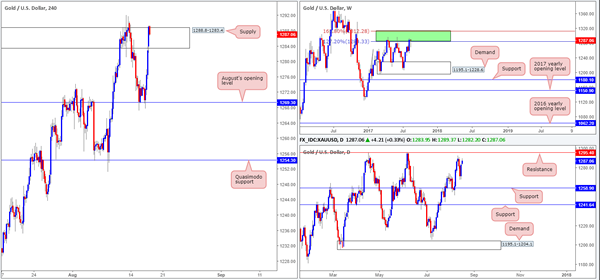
GOLD
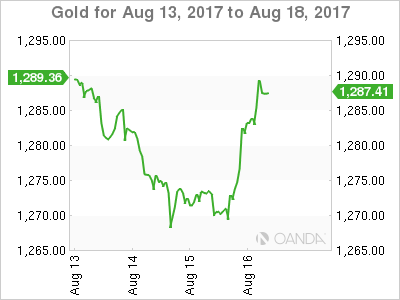
Kicking this morning's analysis off with a look at the weekly timeframe, we can see that the bears are struggling to hold ground. Of course, it's far too early to judge just yet since the green weekly resistance area (comprised of two weekly Fibonacci extensions 161.8/127.2% at 1312.2/1284.3 taken from the low 1188.1) has managed to hold the metal lower successfully on two separate occasions in the past.
The story on the daily chart, nevertheless, shows price trading nearby a resistance level at 1295.4. Apart from the two occasions on 17/04/2017 and 06/06/2017, there's little history registered with this number! For that reason, we may see price break above this line and head to the resistance carved from 1308.4, which boasts very attractive history dating back to early 2011.
August's opening level at 1269.3, as can be seen on the H4 timeframe, held beautifully as support on Wednesday. Bolstered by a decline in the US dollar, the unit attacked supply coming in at 1288.8-1283.4. The way we see things right now is this H4 supply is the last barrier stopping daily price from connecting with resistance mentioned above at 1295.4.
Our suggestions: Based on the above notes, our desk will not be looking for (long-term) shorts until the daily resistance line plotted at 1308.4 is in play. This is due to the history surrounding this number and its position within the current weekly resistance area (allowing us to place stops tightly above this zone). Regarding intraday opportunities, we see very little to hang our hat on at the moment.
Levels to watch/live orders:
- Buys: Flat (stop loss: N/A).
- Sells: 1308.4 region. This is, given the location of this daily resistance on the weekly timeframe, a fantastic level to be looking for a short from.
Elliott Wave View: Dow Future
Short term Dow Futures (YM_F) Elliott Wave view suggests that rally from 6/29 low is unfolding as a a double three Elliott wave structure. Up from 6/29 low (21138), Minor wave W ended at 22132 and pullback to 21790 ended Minor wave X. Rally from there is unfolding as an impulse Elliott wave structure. Up from 21790, Subminutte wave i ended at 21884, Subminutte wave ii ended at 21815, Subminutte wave iii ended at 22034, Subminutte wave iv ended at 21942, and Subminutte wave v of (a) ended at 22067. Minutte wave (b) is in progress to correct cycle from 8/11 low in 3, 7, or 11 swing before the Index resumes the rally. We don’t like selling the proposed pullback and expect buyers to appear once Minutte wave (b) pullback is complete in 3, 7, or 11 swing provided pivot at 21787 low stays intact.
Dow Futures 1 Hour Elliott Wave Chart
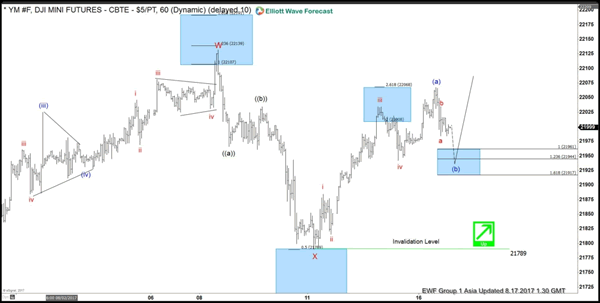
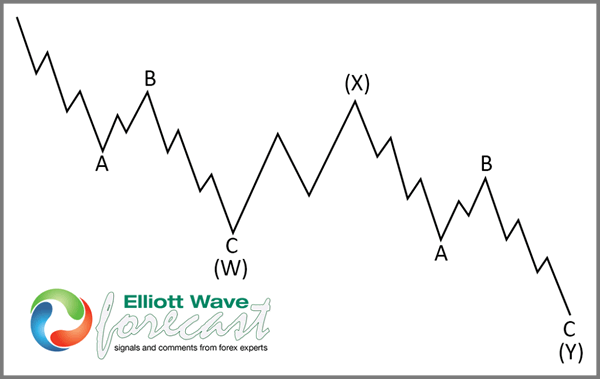
Double Three is the most important pattern in the new Elliott wave theory and probably the most common pattern in the market these days. Double three is also known as a 7 swing structure. It is a very reliable pattern that gives traders good opportunity to trade with a well defined invalidation level and target areas. The image below shows what Elliott Wave Double Three looks like. It has (W), (X), (Y) labels and an internal structure of 3-3-3, which means that all 3 legs has corrective sequences. Each (W) and (Y) is made of 3 waves oscillations & has structure of A, B, C or another W, X, Y of a lesser extent.
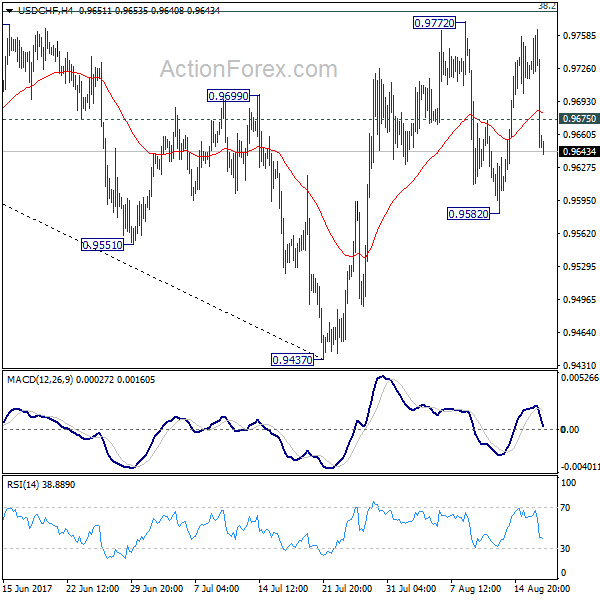
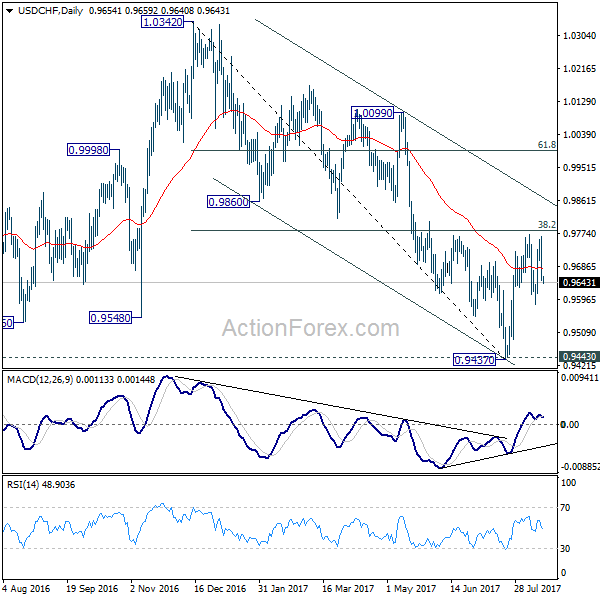
USD/CHF Daily Outlook
Daily Pivots: (S1) 0.9614; (P) 0.9690; (R1) 0.9731; More...
The break of 0.9675 minor support suggests rebound from 0.9582 has completed. Intraday bias is turned neutral first. On the upside, decisive break of 0.9772 resistance will revive the bullish case of reversal. That is, whole decline from 1.0342 has completed at 0.9437 after defending 0.9443 support. USD/CHF should then target channel resistance (now at 0.9862) next. Meanwhile, the pair is bounded inside medium term falling channel and limited below 38.2% retracement of 1.0342 to 0.9437 at 0.9783 for the moment. Break of 0.9582 will turn bias back to the downside for 0.9437. This could also extend the fall from 1.0342 through 0.9437/43 key support level.
In the bigger picture, current development argues that USD/CHF has successfully defended 0.9443 key support level. And long term range trading in 0.9443/1.0342 is extending with another rise. At this point, there is no sign of an up trend yet. Hence, while further rise is expected in USD/CHF, we'll start to be cautious on loss of momentum above 61.8% retracement of 1.0342 to 0.9437 at 0.9996. However, firm break of 0.9443 will carry larger bearish implication and would target next key support at 0.9072.
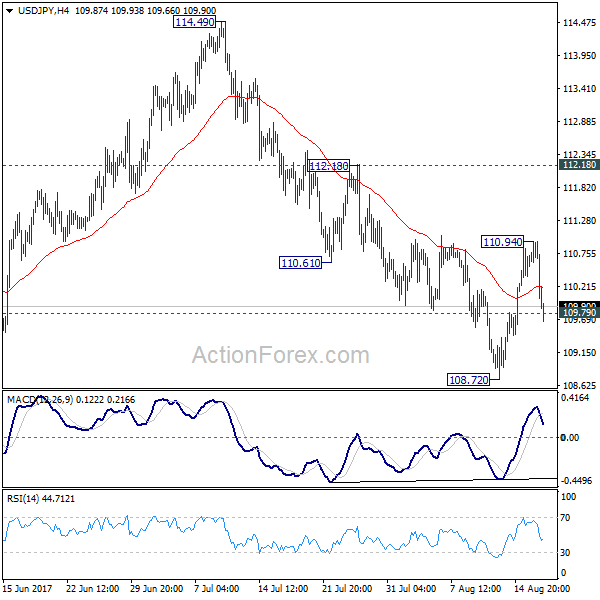
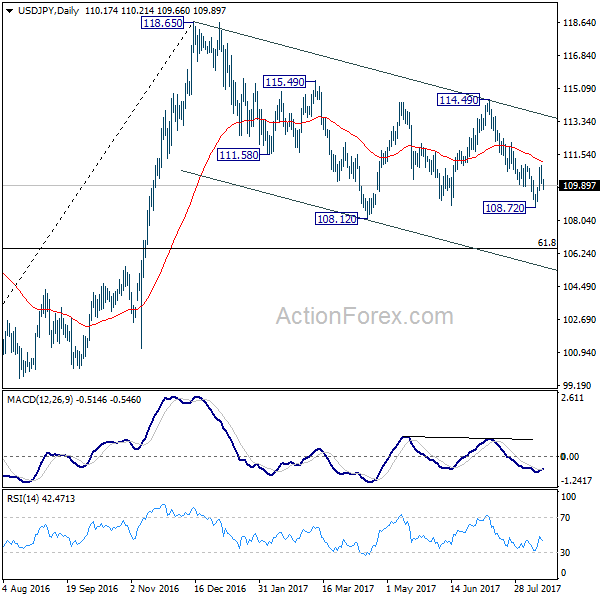
USD/JPY Daily Outlook
Daily Pivots: (S1) 109.82; (P) 110.38; (R1) 110.74; More...
USD/JPY's sharp fall and break of 109.79 minor support argues that rebound from 108.72 has completed at 110.94. Intraday bias is turned back to the downside for retesting 108.72 first. Break of 108.72 will likely resume the whole decline from 118.65 through 108.12 to next medium term fibonacci level at 106.48. On the upside, above 110.94 will extend the rebound to 112.18 resistance next.
In the bigger picture, the corrective structure of the fall from 118.65 suggests that rise from 98.97 is not completed yet. Break of 118.65 will target a test on 125.85 high. At this point, it's uncertain whether rise from 98.97 is resuming the long term up trend from 75.56, or it's a leg in the consolidation from 125.85. Hence, we'll be cautious on topping as it approaches 125.85. If fall from 118.65 extends lower, downside should be contained by 61.8% retracement of 98.97 to 118.65 at 106.48 and bring rebound.
Where To Next For The Federal Reserve?
Key Points:
- Fed signals the likely start of a balance sheet taper next month.
- Fed credibility gap suggests that many could be caught by surprise.
- Watch for equities and bond markets to be under pressure.
The past 24 hours have been relatively interesting for those of us who keep a close eye on the U.S. Federal Reserve with the release of the latest FOMC minutes. The minutes contained some interesting comments on the future of the central bank's enormous balance sheet with most of the voting members supporting the commencement of a balance sheet taper at the next FOMC meeting. Subsequently, bond markets and U.S. equities could be in for a relatively rough ride ahead if the Fed sticks to its current game plan.
The biggest risk of an unwinding of the Fed's balance sheet is the risk of a 'taper tantrum' occurring within markets. In fact, the Fed's Rosengren has already commented that he believes that the vast majority of investors are ready and anticipating the Fed's unwinding of their $4.5 trillion balance sheet. However, I beg to differ, given that the central bank's credibility has continued to worsen over the past six months as they have systematically overestimated inflationary pressures within the economy.
Subsequently, it's relatively hard to see how Bond and Equity market participants can be expected to take them seriously in the face of ongoing jawboning. It wasn't too long ago that Fed, and Yellen specifically, was perpetuating the 3 or 4 hikes for 2017 mantra. That specific rhetoric took its toll on the USD cross pairs and saw plenty of capital flooding into the greenback. So it is unsurprising that the air has now come out of the Dollar in the aftermath of what can only be described as a sentiment of dovishness pervasively emanating from the Fed.
Therefore, the commencement of a balance sheet tapering phase is likely going to be met with some surprise on the market as people have become used to a central bank that is largely full of hot air. In an attempt to stave off significant market volatility, the Fed is likely to start the tapering process gently but the inevitable signal it will send to the markets is undeniable and this will in all probability kick off a relatively sharp round of selling.
Ultimately, bond and equity markets are likely to see plenty of volatility if the Fed's balance sheet commencement process does indeed start in late September. Subsequently, watch for some sharp selling because there are still many within the market that believe the Fed is bluffing and when the process starts it will be relatively rough indeed.
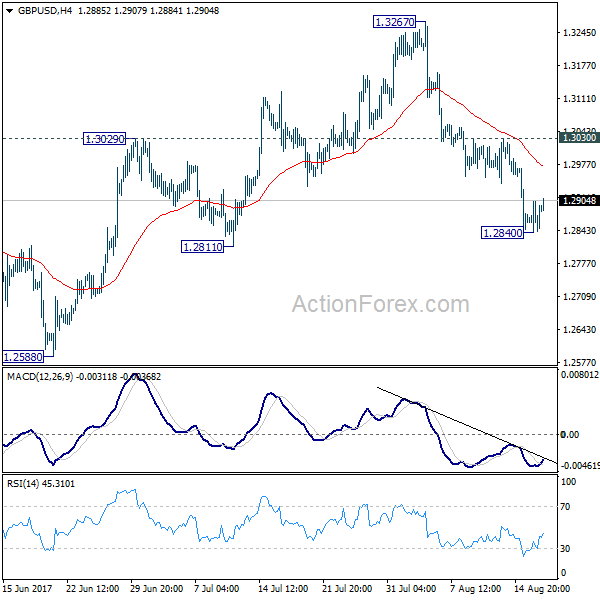
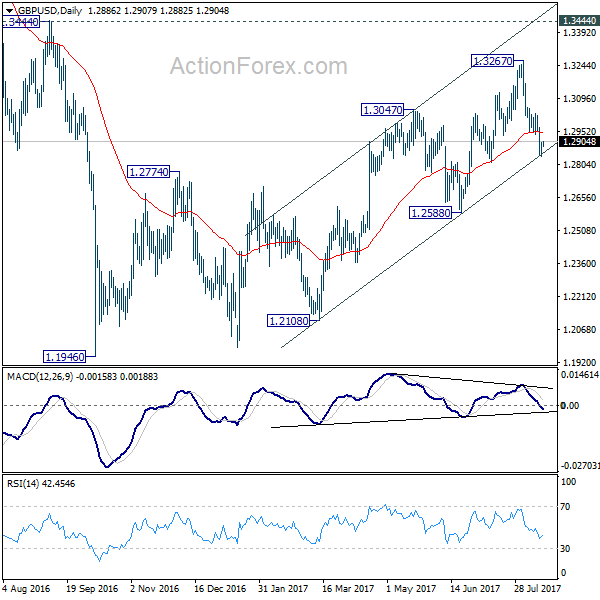
GBP/USD Daily Outlook
Daily Pivots: (S1) 1.2853; (P) 1.2877; (R1) 1.2915; More...
GBP/USD formed a temporary low at 1.2840 and intraday bias is turned neutral first. Some consolidation could be seen but outlook will stay bearish as long as 1.3030 resistance holds. We're preferring the case that correction from 1.1946 is completed at 1.3267. Below 1.2840 will target 1.2588 key support to confirm our bearish view. Nonetheless, break of 1.3030 will dampen our view and turn bias back to the upside for retesting 1.3267.
In the bigger picture, overall, price actions from 1.1946 medium term low are seen as a corrective pattern. While further rise cannot be ruled out, larger outlook remains bearish as long as 1.3444 key resistance holds. Down trend from 1.7190 (2014 high) is expected to resume later after the correction completes. And break of 1.2588 will indicate that such down trend is resuming.
Gold Soars As Oil Is Sent To The Naughty Corner
Concerning price action with oil falling on very bullish inventories as Trump and the FOMC indirectly boost gold.
The official U.S. Crude Inventories delivered last night, announcing a monster drawdown, but crude prices themselves did not. After a brief rally following the numbers, both Brent and WTI collapsed to finish 2% lower for the session at 50.20 and 46.75 in what can only be viewed as a worrying technical development.
Amongst the scramble by analysts to fit facts to the somewhat confusing price action, I can only conclude that there was still a lot of speculative long positioning in the market, that threw in the towel once Brent crude broke its 100-day moving average. The rapidly closing long term contango structure in the oil futures market is at odds with the movements lower in spot crude and most certainly cannot be explained by talk of OPEC noncompliance and peak oil demand, both of which are longer term indicators.
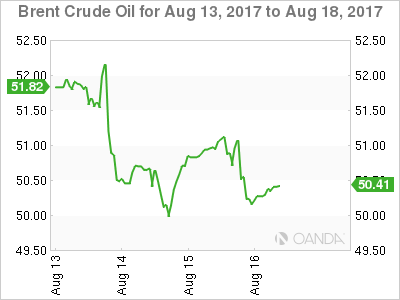
Brent
Brent spot is trading at 50.25 and has now broken and closed below its 100-day moving average at 50.50, joining WTI spot in the naughty corner after managing to maintain its good behaviour bond over Tuesday's API Inventories. The next resistance sits at 51.10 with initial support at 49.70. A move through the latter is possibly signalling a deeper move lower to the 47.50 area.
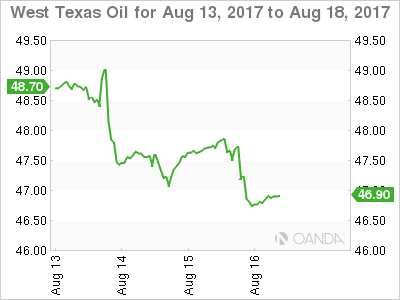
WTI
WTI spot trades near its New York sitting at 46.80 with nearby support at 46.20 with a break suggesting more pain to the 45.20 area. After three consecutive daily closes below its 100-day moving average, this morning at 47.80, and its overnight high at 48.00, this level must break if WTI is to be deemed worthy of a good behaviour star.
GOLD
A combination of pseudo dovish FOMC minutes and President Trump dismantling his councils of wise CEO's brought an abrupt end to the U.S. dollar rally of the past few days which in turn saw gold a beneficiary. As the chaos of daily life on the Hill in Washington D.C. and a nervous Fed sunk the dollar, gold rose from a low of 1267.70 to charge 15 dollars higher and close at 1282.70.
With gold making back all its losses from the previous day, it has opened bullishly in Asia, trading four dollars higher at 1286.50 in early trade. To act as the voice of reason, however, I must note that gold's price action of the past three days has been entirely driven by the overall direction of the U.S. dollar in isolation. Therefore it is important to understand that golds ebbs and flows are not due to any factors in particular with gold's appeal or not; rather traders are taking a view on the big dollar.
That said, from a technical perspective, the price action was impressive, and gold is now in shouting distance of both last week's high at 1292.50 and the monster 1296.00 regions, a break of which could be suggestive of a structural, medium term move higher to a 1300 handle.
On the downside, initial support lies now at 1282.00 followed by the more import 1275.00 and 1267.00 levels. In the shorter term, and in the absence of any geopolitical headlines, traders should watch the performance of the dollar against its G-10 peers for clues to gold's short term direction.