
Sample Category Title
EUR/GBP Candlesticks and Ichimoku Analysis
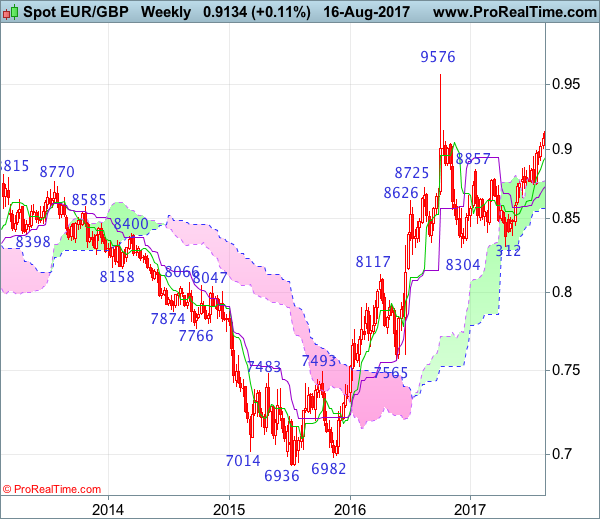
Weekly
• Last Candlesticks pattern: N/A
• Time of formation: N/A
• Trend bias: Near term up
Daily
• Last Candlesticks pattern: Doji
• Time of formation: 21 Jul 2017
• Trend bias: Up
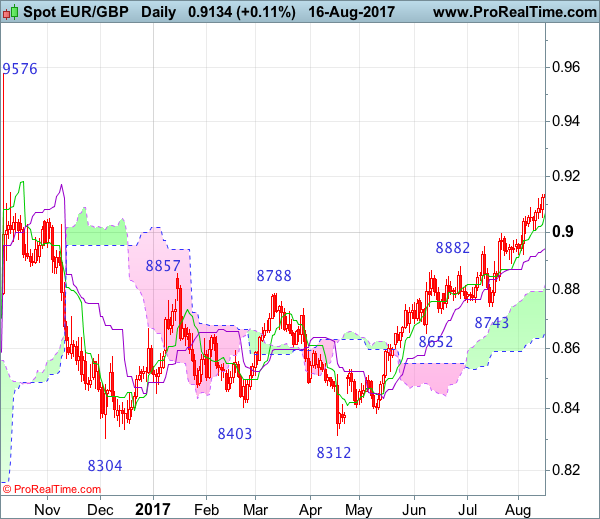
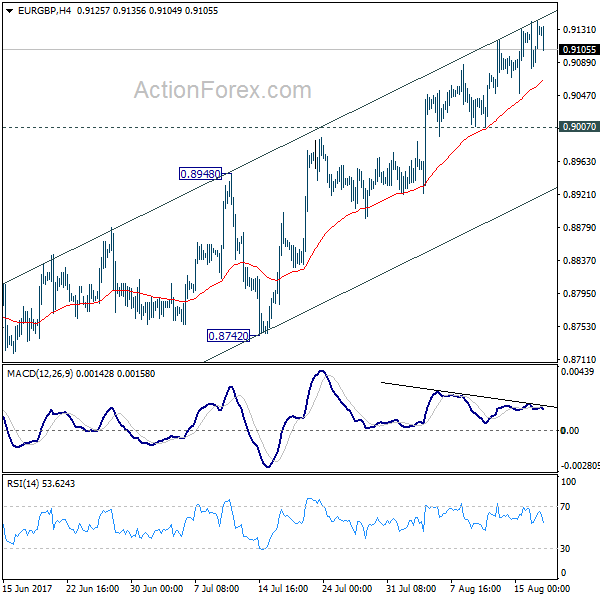
EURGBP – 0.9111
As the single currency has continued trading with a firm undertone, suggesting medium term upmove is still in progress and bullishness remains for medium term uptrend to extend headway to 0.9150-55, then towards 0.9190-00, however, near term overbought condition should prevent sharp move beyond 0.9250-55 and price should falter well below 0.9380-85 (100% projection of 0.8312-0.8950 measuring from 0.8743), risk from there is seen for a strong retreat to take place later this month.
On the downside, whilst initial pullback to 0.9050 and possibly support at 0.9008 cannot be ruled out, however, previous resistance at 0.8995 should limit downside and bring another rise later. Only a daily close below the Kijun-Sen (now at 0.8943) would signal a temporary top is formed, bring retracement of recent upmove to 0.8920-25, then towards previous support at 0.8891, once this level is penetrated, this would provide confirmation that recent upmove has ended, bring subsequent decline to 0.8850 but 0.8830-35 should hold.
Recommendation: Buy again at 0.8925 for 0.9125 with stop below 0.8825.
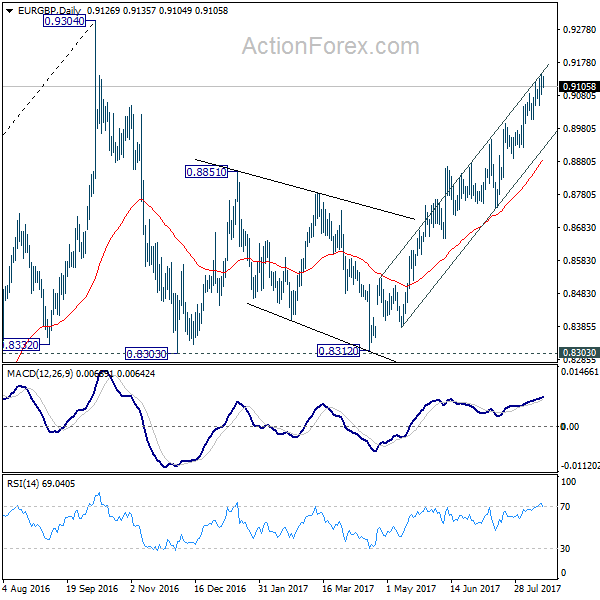
On the weekly chart, as the single currency has risen again after brief pullback, adding credence to our bullish view that recent erratic rise from 0.8304 is still in progress and upside bias remains for this move to extend gain to 0.9200-10, then towards 0.9250-60, however, near term overbought condition should limit upside to 0.9300-10 and upside should be limited to 0.9380-85 (100% projection of 0.8312-0.8950 measuring from 0.8743). Looking ahead, break there is needed to retain bullishness and signal the entire correction from 0.9576 top has ended at 0.8304 and encourage for further subsequent gain to 0.9450.
On the downside, although pullback to 0.9000-10 cannot be ruled out, reckon the Tenkan-Sen (now at 0.8939) would limit downside and bring another rise. A drop below support at 0.8891 would defer and suggest top is possibly formed, bring retracement of recent upmove to 0.8795-00 and then towards support at 0.8743, having said that, a weekly close below the Kijun-Sen (now at 0.8728) is needed to retain bearishness for subsequent decline to 0.8650-55 but the lower Kumo (now at 0.8571) should remain intact, bring another rally later.
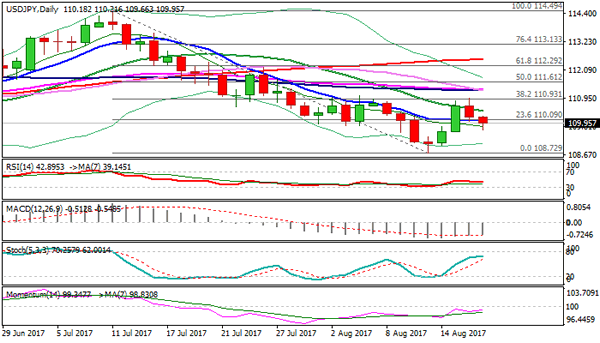
Technical Outlook: USDJPY Remains Under Pressure, Dented Important Support At 109.83
The pair stays in red for the second day and extends weakness after Wednesday's strong rejection at key 111.00 resistance zone. Fresh bearish acceleration was boosted by disappointing Fed minutes that put the greenback under pressure, with today's probe below daily Tenkan-sen (109.83)signaling that corrective phase from 108.72 (11 Aug low) might be over. Bearish scenario remains favored as the price returned below 10 and 20 SMA after short-lived probe above, with daily studies now being back to full bearish setup. Firm break below daily Tenkan-sen and Fibo 61.8% of 108.72/110.94 at 109.57 is needed to confirm reversal. Thick hourly cloud (spanned between 110.09 and 110.57) weighs on near-term action and expected to limit recovery attempts. Only sustained break above the cloud would shift near-term bias higher and re-focus key 111.00 resistance.
Res: 110.09, 110.21, 110.44, 110.84
Sup: 109.83, 109.57, 109.25, 109.03
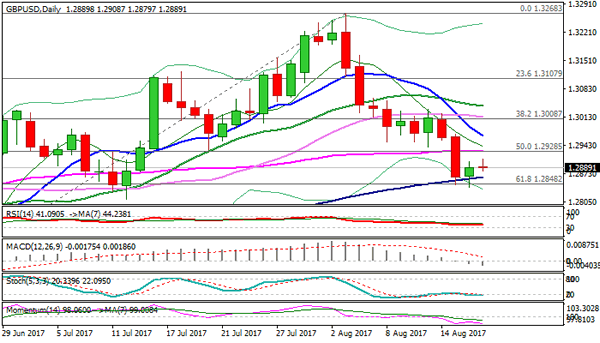
Technical Outlook: Cable Is Holding Around 1.2900 Handle Ahead Of UK Retail Sales
Cable is holding high levels and probes again through 1.2900 barrier on Thursday after being lifted by strong UK jobs data and dovish Fed minutes on Wednesday.
Overall structure remains negative and sees risk of further downside after completion of current consolidative phase above daily cloud top / 100SMA (currently at 1.2865) and Fibo 61.8% support at 1.2848.
Plethora of strong barriers lies above, starting with sideways-moving 55SMA (1.2930), followed by daily Tenkan-sen in steep descend (1.2950), which should ideally cap recovery attempts and guard pivots at 1.3000/31 (psychological barrier / 11 Aug lower top).
UK Retail Sales are in focus today (0.2% f/c for July vs 0.6% in June) with weaker than expected release to put pound under fresh pressure for retest of key supports at 1.2840/48 zone and with increased downside risk on firm break lower.
Res: 1.2908, 1.2930, 1.2950, 1.2965
Sup: 1.2879, 1.2865, 1.2840, 1.2811
EUR/GBP Daily Outlook
Daily Pivots: (S1) 0.9092; (P) 0.9117; (R1) 0.9152; More
With 0.9007 support intact, further rise is expected in EUR/GBP. Current rise from 0.8312 should target a test on 0.9304 high. At this point, there is no clear sign of up trend resumption yet. Hence, we'll be cautious on strong resistance from 0.9304 to limit upside and bring another fall. On the downside, considering bearish divergence condition in 4 hour MACD, break of 0.9007 support will indicate short term topping. Intraday bias will then be turned back to the downside for 0.8742/8948 support zone.
In the bigger picture, price actions from 0.9304 are viewed as a medium term corrective pattern. It's uncertain whether it is finished yet. But in case of another fall, we'd expect strong support from 0.8116 cluster support (50% retracement of 0.6935 to 0.9304 at 0.8120) to contain downside and bring rebound. Whole up trend from 0.6935 is expected to resume after consolidation from 0.9304 completes.
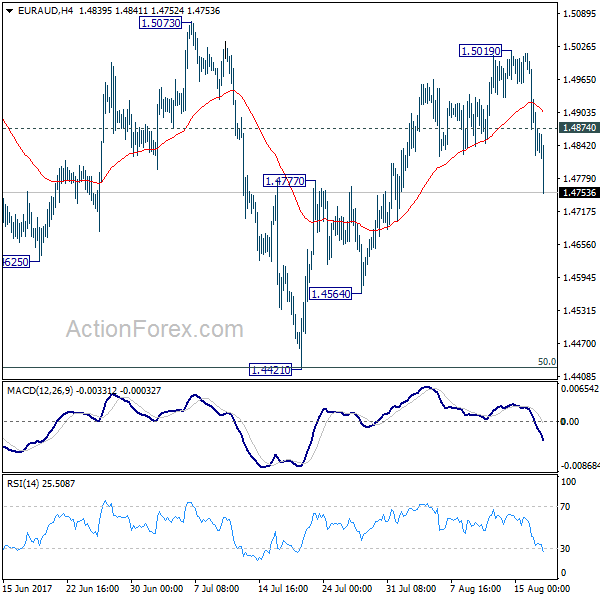
EUR/AUD Daily Outlook
Daily Pivots: (S1) 1.4774; (P) 1.4894; (R1) 1.4963; More...
EUR/AUD's sharp fall and break of 1.4824 support dampens our bullish view and argues that rebound from 1.4421 has completed at 1.5019 already. Intraday bias is turned back to the downside for 1.4564 support first. The corrective pattern from 1.5226 could have another take on 50% retracement of 1.3624 to 1.5226 at 1.4427 before completion. On the upside, above 1.4874 minor resistance will turn intraday bias neutral first.
In the bigger picture, we're holding on to the view that corrective decline from 1.6587 medium term has completed at 1.3624. Rise from 1.3624 is expected to extend to retest 1.6587. The corrective structure of the fall from 1.5226 is affirming this view. Above 1.5226 will target a test on 1.6587 key resistance. However, another decline will dampen our view and would drag EUR/AUD lower to retest key support zone around 1.3624.

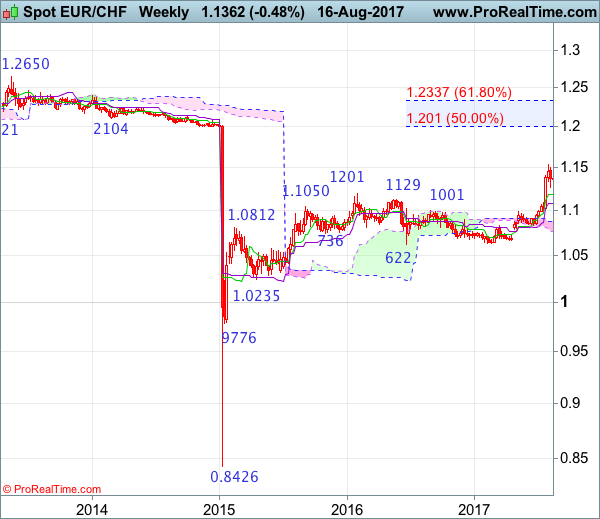
EUR/CHF Candlesticks and Ichimoku Analysis
Weekly
• Last Candlesticks pattern: Long white candlestick
• Time of formation: 24 Jul 2017
• Trend bias: Up
Daily
• Last Candlesticks pattern: Morning doji
• Time of formation: 25 Jul 2017
• Trend bias: Up
EUR/CHF – 1.1343
Although the single currency staged another bounce to 1.1479 earlier this week, renewed selling interest emerged there and has retreated again, retaining our view that further consolidation below recent high of 1.1538 (this month’s high) would be seen and test of support at 1.1261 (also same level as the Kijun-Sen) cannot be ruled out, however, a daily close there is needed to signal a temporary top has been formed at 1.1538 and bring retracement of recent upmove to 1.1185 (50% Fibonacci retracement of 1.0833-1.1538), having said that, near term oversold condition should limit downside and reckon 1.1100-05 (61.8% Fibonacci retracement) would hold, bring rebound later.
On the upside, whilst initial recovery back towards the Tenkan-Sen (now at 1.1382) cannot be ruled out, reckon upside would be limited to 1.1440-45 and price should falter below said resistance at 1.1479, bring another retreat later. Only a break of said recent high at 1.1538 would confirm recent upmove has resumed and extend headway to 1.1600-10, however, further sharp move beyond 1.1700 should not be repeated and price should falter below 1.1770-80, bring retreat later this month.
Recommendation: Stand aside for this week.
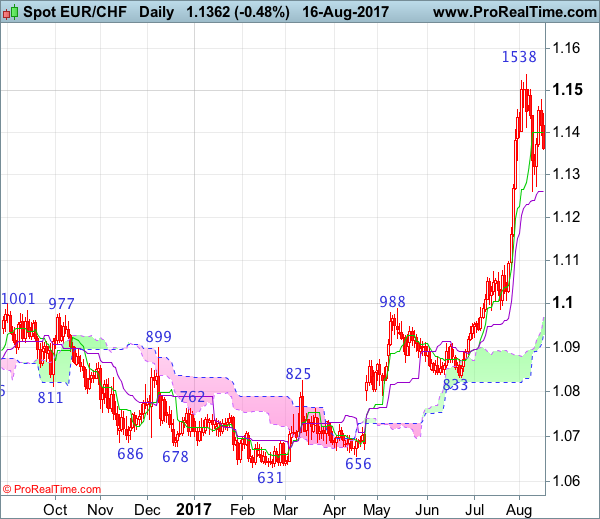
On the weekly chart, the single currency has retreated again after faltering below recent high at 1.1538, retaining our view that consolidation below this level would be seen and pullback to 1.1250-60, then towards the Tenkan-Sen (now at 1.1186) cannot be ruled out, however, a weekly close below the Tenkan-Sen is needed to signal a temporary top is formed at 1.1538, bring retracement of recent upmove to 1.1100-05 (61.8% Fibonacci retracement of 1.0833-1.1538) then test of the Kijun-Sen (now at 1.1085) but reckon support at 1.0987 would remain intact.
On the upside, although initial recovery to 1.1400-10 cannot be ruled out, reckon upside would be limited to 1.1440-50 and price should falter below 1.1500, bring another retreat later. Only a break of said resistance at 1.1538 would revive bullishness and extend the major rise from 0.8426 low for headway to 1.1590-00, then towards 1.1700-10, however, near term overbought condition should prevent sharp move beyond 1.1800 and reckon 1.1900-10 would hold from here, risk from there has increased for a retreat to take place later this month.
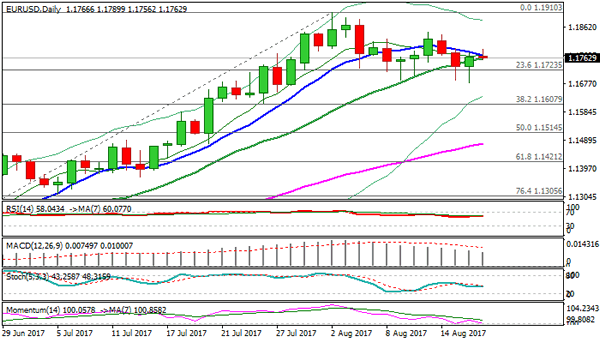
Technical Outlook: EURUSD – Post-Fed Minutes Rally Face Strong Headwinds At 1.1800 Zone
The Euro is holding firm tone in early Thursday and trading near 1.1800 handle, following bounce on Wednesday after Fed minutes disappointed traders.
Policymakers showed strong concerns about low inflation that could delay widely expected Fed rate hike towards the end of the year.
The Euro benefited from fresh weakness of the dollar and bounced from strong supports at 1.1680/90 zone, where the base is forming after multiple downside rejection.
Fresh bulls dented important barrier at 1.1770 (10SMA and weekly 200SMA) clear break of which is needed to generate stronger bullish signal for retest of 1.1910 (02 Aug high) and final attempt towards psychological 1.2000 barrier.
On the other side, repeated rejection on approach to 1.1800, where upside attempts failed on Tue/Wed, would keep the downside vulnerable for fresh attacks at 1.1680/90 base.
Break here would trigger deeper correction of 1.1188/1.1910 rally and expose supports at 1.1640 (daily Kijun-sen) and 1.1607 (Fibo 38.2% of 1.1188/1.1910 upleg).
Eurozone inflation data are due today and expected to give fresh signals.
Res: 1.1789, 1.1838, 1.1846, 1.1910
Sup: 1.1756, 1.1723, 1.1685, 1.1640
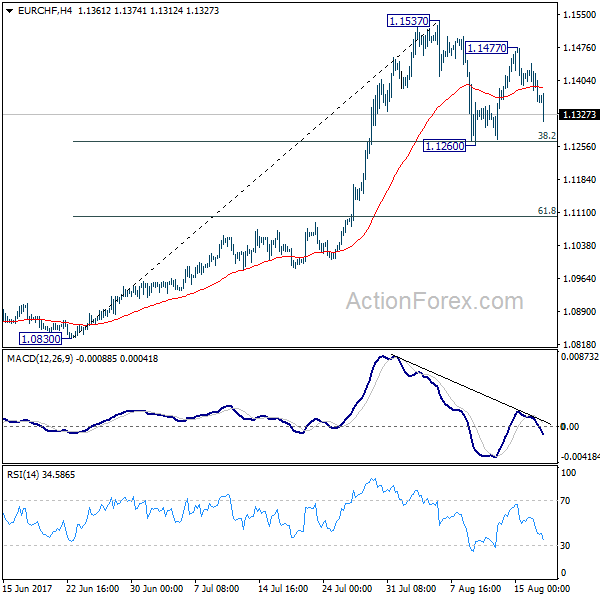
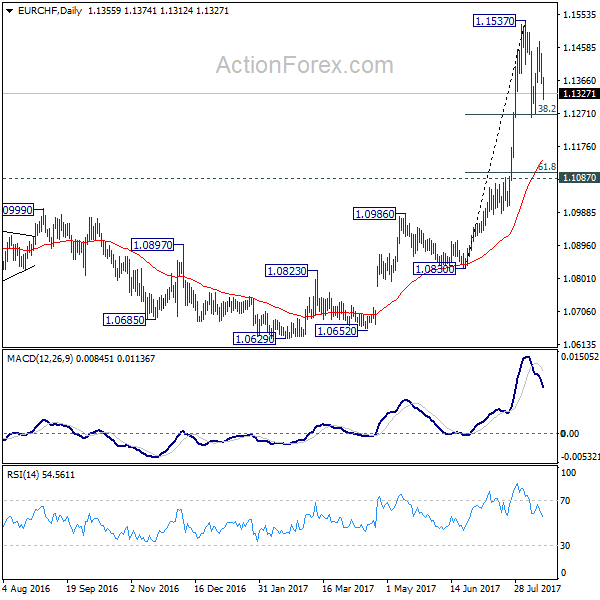
EUR/CHF Daily Outlook
Daily Pivots: (S1) 1.1333; (P) 1.1387; (R1) 1.1418; More...
EUR/CHF weakens notably today but it's staying in range of 1.1260/1537. Intraday bias remains neutral first. Consolidation from 1.1537 is still in progress and there could be deeper fall. But downside should be contained by 38.2% retracement of 1.0830 to 1.1537 at 1.1267 to bring rebound. Break of 1.1537 resistance will resume up trend from 1.0629. However, firm break of 1.1267 will extend the correction from 1.1537 and target 61.8% retracement at 1.1100, before completion.
In the bigger picture, firm break of 1.1198 key resistance confirms resumption of the long term rise from SNB spike low back in 2015. In this case, EUR/CHF would eventually head back to prior SNB imposed floor at 1.2000. For now, this will be the favored case as long as 1.1087 resistance turned support holds.
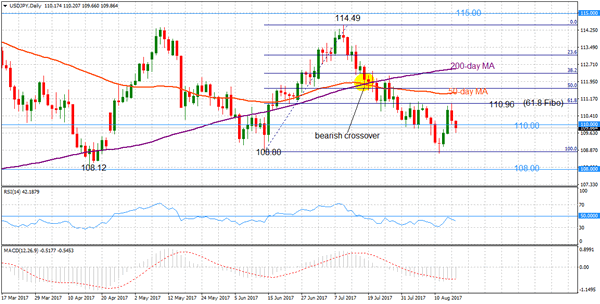
USDJPY Maintains Downtrend In Near-Term, Neutral In Medium-Term
USDJPY is under pressure in the short-term and maintains the downtrend from the 5-month peak of 114.49, while the pair trades in a broader range between 108.00 to 114.00 in the medium term. USDJPY is now trading at the bottom of this consolidation range.
The near-term risk is to the downside after the market failed to break above the strong 110.96 resistance at the 61.8% Fibonacci retracement level of the rise from 108.80 to 114.49 (June 14 to July 11 upleg).
As long as this resistance at 110.96 holds, the bias will likely remain bearish in the short-term with scope to re-test the August 11 low of 108.80. A deeper decline could see a further slide to the April 17 low of 108.12 ahead of the next major low of 101.18.
Alternatively, a break of the resistance at 110.96 would ease downside pressure and USDJPY could resume upside towards the 50-day moving average (MA) at 111.43 and the 50% Fibonacci at 111.62. A move higher from this point would dampen the bearish view and turn the focus to the top of the range (114.49 resistance) and the key 115.00 level.
Looking at the technical indicators, the signals are bearish. There was a bearish crossover of the 50-day MA with the 200-day MA on July 18. Momentum indicators are in bearish territory, as RSI is below 50 and MACD is below zero.
Overall the near-term bias is bearish while the medium-term picture remains neutral.
Yen Gains On Fed Minutes, Commodity-Linked Aussie Extends Gains, Oil Inches Up
As Asian traders were heading home for the day, the yen rose and the dollar extended declines following the release of the Federal Reserve meeting minutes last night. The aussie firmed up following a rally in base-metal prices. The rest of the day looks busy with several economic data publications across Europe and the US along with the release of the European Central Bank meeting minutes.
The dollar fell against the yen and other majors after the release of the minutes of the Fed's July meeting, which showed a growing worry among the policymakers about the lack of strong inflationary pressures in recent data releases. This suggests that the central bank may hold off on raising interest rates this year. The Fed fund futures are now showing a smaller probability (below 50%) for a December rate hike. Looking at the latest trading in forex markets, dollar/yen was down at 109.83, euro/dollar inched down to 1.1761 and sterling was broadly flat at $1.2890.
While the recent geopolitical tensions between the US and North Korea have calmed down, the US is not having a break from a turbulent political scene, this time internal. Several high-profile CEO's have resigned from President Trump's council board following the fallout from his response to the weekend violence in Virginia.
The aussie and kiwi gained against the greenback, rising from their one-month lows. Aussie/dollar was trading at 0.7945 and kiwi/dollar was at 0.7321 ahead of the European session. The currencies down under advanced higher on the back of the dollar weakness and a recent rally in base-metal prices. Copper and aluminum prices spiked to their highest since 2014 while zinc hit a high not seen since 2007. The Australian jobs report out today showed a mixed picture. The country's unemployment rate fell to 5.6% in July from the upwardly revised figure of 5.7% for the prior month. While there were more people employed in July, it was driven by part-time jobs as the amount of permanent jobs fell by more than 20,000. These figures augur poorly for wage growth and a pickup in inflation.
The euro inched lower against the greenback to last trade at $1.1761 ahead of the release of the minutes from the latest ECB meeting. At the same time, some reports have been suggesting that ECB President Mario Draghi will not use the meeting in Jackson Hole to announce any new monetary policy directions. Investors' hopes had been lifted earlier as Mario Draghi had announced changes in the policy at the same place in 2014.
Sterling was broadly flat against the dollar, but the pair could move significantly following the release of UK monthly retail sales at 8:30 GMT.
Gold prices rose linked to the weakness in the greenback. The precious metal was last trading at $1,289.11 an ounce.
Oil prices inched higher during today's first session of the day, following yesterday's plunge. WTI was last trading at $46.84 a barrel and Brent was at $50.38. Oil prices tumbled late last night despite the Energy Information Administration report showing that US crude oil stocks fell by almost 13% from their peaks in March to 466.5 million barrels. Markets might be focusing on rising US production, which reached its highest level since mid-2015.