Sample Category Title
Data Dump Continues Thursday With Eurozone, US Releases
Investors got their fair share of economic data releases on Wednesday, but the deluge will continue in the latter half of the week with headlines from both sides of the Atlantic.
The economic calendar heats up at 08:30 GMT when the Office for National Statistics reports on UK retail sales. Receipts at retail stores rose 0.2% in July and 1.4% annually, according to a median estimate of economists. Excluding fuel, sales are also expected to rise 0.2% on month.
A half hour later, the European Commission’s statistical agency will release its final estimate of July consumer inflation. The consumer price index (CPI) is forecast to decline 0.5% in July, translating into a year-over-year reading of 1.3%.
Eurostat will also release July trade data at 10:00 GMT. The trade surplus is forecast to widen to €22.9 billion in July from €21.4 billion the previous month.
Shifting course to the United States, initial jobless claims and the Philadelphia Fed Manufacturing Survey will make headlines at 12:30 GMT. Just over an hour later, the Federal Reserve will release its monthly report on industrial production. The Fed’s broadest measure of factory output is forecast to climb 0.3% in July following a 0.4% increase the prior month. The capacity utilization rate is expected to edge up slightly to 76.7% from 76.6%.
From a geopolitical perspective, investors are also monitoring the renegotiation of the North American Free Trade Agreement (NAFTA) between the United States, Canada and Mexico. The Trump administration came out swinging on day one, a sign that the renegotiation process will be a highly contentious one.
EUR/USD
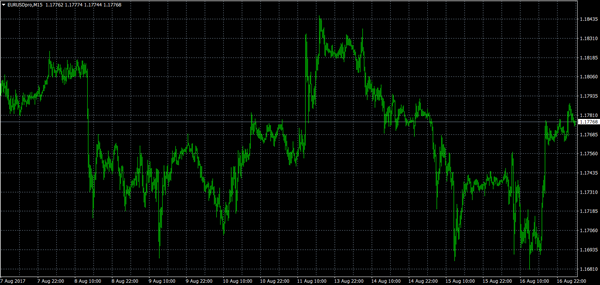
The euro generated some support on Wednesday, but remained well below yearly highs. The EUR/USD exchange rate is hovering near 1.1780. From a technical perspective, the pair is looking to test the 1.1785 resistance. A break above this level would expose the 1.1815 region. On the opposite side of the spectrum, immediate support is located at 1.1720.
GBP/USD
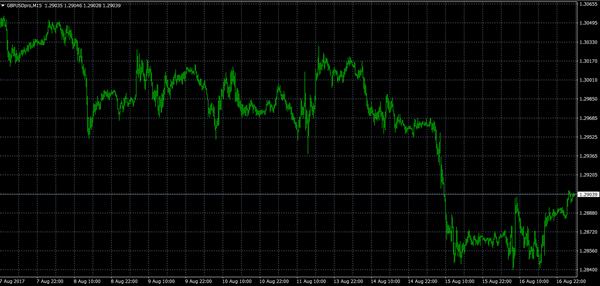
The British pound overtook 1.2900 US on Thursday, but continued to trade well below its previous highs. Cable will look to economic data for momentum on Thursday, with retail sales providing the catalyst. Analysts say the GBP/USD faces limited upside momentum, as the market continues to show a sharp bearish slope. Immediate upside is capped around 1.2930. Support is located at 1.2830.
Gold
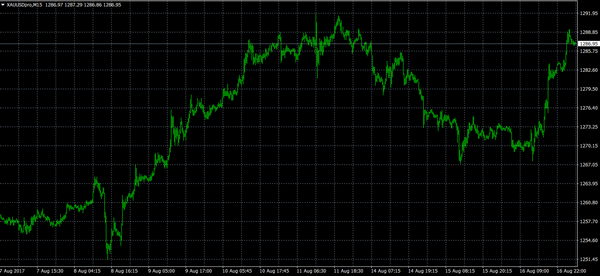
Gold prices bounced back on Wednesday, as the US dollar weakened against a basket of global rivals. The dollar’s decline was partially attributed to a mixed reading of the July FOMC minutes, which signaled growing divergence about the future of monetary policy. Gold prices approached $1,290.00 a troy ounce in Asian trading. The yellow metal faces a critical resistance level at $1,300.00
Elliott Wave Analysis: GBPUSD Looking Lower
GBPUSD made a sharp and strong decline in the last two weeks, with another leg down yesterday which can be wave 3) headed to 1.2750 near-term projection level. In fact current declien can become even more extended and sharper if we consider that wave 3) is normally the strongest leg in a five wave sequence. As such, we remain bearish on pound as long as 1.3030 holds.
GBPUSD, 4H
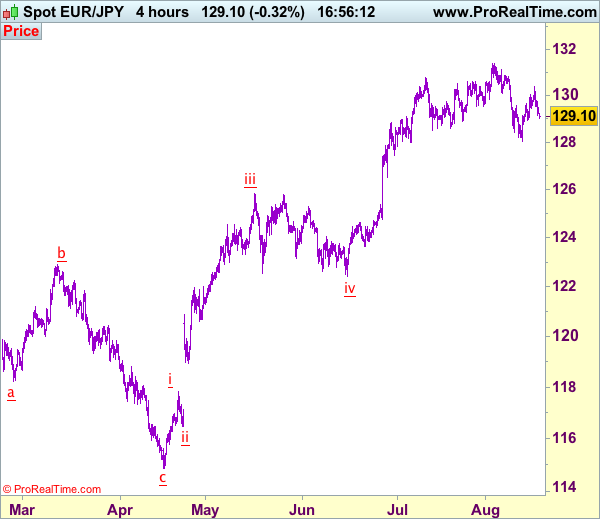
Trade Idea: EUR/JPY – Hold long entered at 129.45
EUR/JPY - 129.10
Recent wave: A 5-waver is unfolding from 114.85 with wave iii and iv ended at 125.82 and 122.40 respectively, wave v has possibly ended at 131.40.
Trend: Near term up
Original strategy:
Bought at 129.45, Target: 131.00, Stop: 128.85
Position: - Long at 129.45
Target: - 131.00
Stop: - 128.85
New strategy :
Hold long entered at 129.45, Target: 131.00, Stop: 128.85
Position: - Long at 129.45
Target: - 131.00
Stop:- 128.85
Although the single currency surged to 130.40 yesterday, the subsequent strong retreat dampened our bullishness and 128.90-00 needs to hold to retain prospect of another rebound, above 129.80-85 would bring another test of said resistance, break there would add credence to our view that at least the first leg of decline from 131.40 top has ended at 128.05 and extend gain to 130.85-90, however, as broad outlook remains consolidative, upside would be limited and said resistance at 131.40 should remain intact, bring another retreat later this week.
In view of this, we are holding on to our long position entered at 129.45. Below 128.90 would risk weakness to 128.50, then retest of Friday’s low at 128.05 but break there is needed to revive bearishness and signal the decline from 131.40 top is under way for retracement of early upmove to 127.50-60, then towards 127.00-10.
Our latest preferred count is that wave (ii) is ABC-X-ABC which ended at 123.33 and wave (iii) is unfolding with wave iii ended at 100.77, followed by wave iv at 111.57 and wave v as well as the wave (iii) has ended at 97.04, followed by wave (iv) at 111.43 and wave (v) has ended at 94.12 which is also the end of the larger degree v, this also implied the major wave (C) has also ended there, hence major correction has commenced from there with (A) leg unfolding in its lower degree wave c which has possibly ended at 145.69. Under this count, A-B-C wave (B) has commenced with A leg ended at 136.23, wave B at 143.79 and wave C has possibly ended at 149.79.
Our larger degree count is that the decline from 139.26 is wave (C) and is sub-divided into a diagonal triangle i-ii-iii-iv-v with wave i - 105.44, wave ii- 123.33, wave iii - 97.03, wave iv - 111.43, followed by the final wave v as well as the end of wave (C) at 94.12, this also mark the bottom of larger degree wave B. Under this count, major rise in wave C has commenced as an impulsive wave with minor wave III ended at 145.69, wave V is still in progress for further gain to 150.00. Having said that, this so-called wave V could well be the first leg of larger degree 5-waver wave C and this wave C should bring at least a retest of wave A top at 169.97 (July 2008).
EUR/USD Analysis: Reaches 1.1790 Level
The EUR/USD currency exchange rate continues to trade in accordance with the medium term descending channel pattern, which is heading towards a large scale pattern's support line.
Most recently the pair reached the resistance of a junior channel up pattern, which was supported by the weekly PP near the 1.1790 mark. As a result of the encounter, the rate began to decline, and during the morning hours of Thursday's trading it had already passed the support of the 100 and 200-hour SMAs at the 1.1770 level.
It can be expected that by the end of the day the pair will continue to fall, as it faces the support of the 55-hour SMA at 1.1745, which might slow down the decline.
Trade Idea: AUD/USD – Buy at 0.7895
AUD/USD – 0.7940
Recent wave: Wave 5 ended at 1.1081 and major correction has commenced for fall to 0.7000 and then towards 0.6500-10
Trend: Near term up
New strategy :
Buy at 0.7895, Target: 0.8050, Stop: 0.7835
Position: -
Target: -
Stop:-
As aussie found decent demand at 0.7808 and has staged a strong rebound above indicated resistance at 0.7919, adding credence to our view that low has possibly been formed there and consolidation with upside bias is seen for gain to 0.8000, however, break there is needed to signal the pullback from 0.8066 top (wave iii peak) has ended at 0.7808 (wave iv) and bring eventual retest of this level.
In view of this, we are looking to buy aussie on dips as 0.7890-00 should limit downside and bring another rise later. Below 0.7845 would dampen this bullish scenario and suggest the rebound from 0.9808 has ended, bring another test of this level, below there would signal the wave iv correction from 0.8066 is still in progress for weakness to 0.7786 support, however, oversold condition should prevent sharp fall below 0.7750 and price should stay above i top at 0.7712, bring rebound later. We are keeping our latest bullish count that recent impulsive waves is unfolding as (1 2, (i)(ii), i ii) and may extend headway towards 0.8150.
On the 4-hour chart, the move from 0.8066 is the wave 5 with i: 0.8860, ii: 0.8315, wave iii is an extended move ended at 1.0183, iv: 0.9706 and wave v has ended at 1.1081 (also the top of entire wave 5). The subsequent selloff is the major correction which is unfolding as ABC-X-ABC and 2nd A leg has ended at 0.8848, followed by a-b-c wave B which ended at 0.9758, hence, 2nd C wave is now in progress and indicated downside target at 0.7000 and 0.6950 had been met, so further fall to 0.6710-20 cannot be ruled out.

GBP/USD Analysis: Surpasses 1.2880
Despite edging higher in the wake of solid earnings data, the Pound failed to sustain its upward momentum on Wednesday and returned near the 1.2850 mark—a level already proven to be a strong support.
The rate managed to accelerate in the second half of the session and push through the weekly S2 and the 55-hour SMA at 1.2885.
By and large, the Pound is expected to appreciate against the Greenback today, setting the weekly and monthly S1s as a near-term target. Reinforced by the 100-hour SMA, this area could be a possible stopping point. Meanwhile, weak fundamentals may guide the pair back to 1.2850.
USD/JPY Analysis: Falls Through SMAs
After reaching the 111.00 mark early on Wednesday, the US Dollar plunged for the remaining session. As a result, the rate breached the weekly R1 and all three SMAs and reached the 109.60 area this morning.
The above fall set trend indicators in the strongly bearish territory, demonstrating that further momentum downwards may still occur. The failure to move above the 200-hour SMA should work as a confirmation that the rate is set to fall.
Nevertheless, this movement south has allayed slightly near the weekly PP. It is therefore expected that the rate remains above the given line and might even try to return near the weekly R1.
XAU/USD Analysis: Rebounds Against 1,270 Level
The yellow metal bounced off the support cluster just below the 1,270 mark, as it was expected on Thursday morning. As a result of the rebound, the pair broke the medium term channel down pattern.
On Thursday morning the possible borders of a narrow ranged channel up pattern were spotted. However, it is most likely that the channel is just a representation of the first move in the borders of another medium term pattern.
Although, a forecast for Thursday can be made easily. The metal is most likely going to surge up to the 1,292.91 level, where the next notable resistance level is located at. If it is broken, the commodity price might reach the 1,300 mark.
GBP/USD: Average Earnings Index 3M/Y
The combination of the stronger-than-expected average earnings growth and lower unemployment in the UK contributed to a sharp increase in the GBP/USD . The Sterling appreciated against the US Dollar by 40 base points or 0.31% to reach the 1.2896 mark, and, despite some weakness during the session, managed to finish it near the 1.2890 level.
The ONS reported that average earnings increased 2.1% year-over-year during three months to June, boosted by strong rise of 27% in bonus payments over the course of June alone. Meanwhile, the UK unemployment fell to the lowest level since 1975, edging down to 4.4% in the reported period. However, analysts expect the tepid economic growth to affect jobs further, as wages continued subdued increase.
EUR/USD: Flash GDP Q/Q
The Euro zone's Flash GDP release had a little impact on the EUR/USD currency pair. The European single currency gained only 3 base points against the Greenback to find a temporary support above the 1.1729 level, which was overcome again in the Wednesday's evening. The pair is expected to gain further support in case of the strong performance of the EZ economy and higher political risks in the US.
The Eurostat reported that the GDP growth in the Euro zone was confirmed at 0.6% in the June quarter, in line with analysts' expectations. Despite the relatively strong Euro, the export sector kept on expanding amid solid global demand for German-made products, especially motor vehicles, while the largest economy remained the leading performer.