
Sample Category Title
EURUSD – Backs Off Lower Prices, Targets More Upside
EURUSD - The pair took back its losses to close higher on Wednesday and opening the door for more strength. Resistance comes in at 1.1800 level with a cut through here opening the door for more upside towards the 1.1900 level. Further up, resistance lies at the 1.1950 level where a break will expose the 1.2000 level. Conversely, support lies at the 1.1700 level where a violation will aim at the 1.1650 level. A break of here will aim at the 1.1600 level. All in all, EURUSD faces further upside pressure.
(FED) Minutes of the Federal Open Market Committee July 25-26, 2017
A joint meeting of the Federal Open Market Committee and the Board of Governors was held in the offices of the Board of Governors of the Federal Reserve System in Washington, D.C., on Tuesday, July 25, 2017, at 1:00 p.m. and continued on Wednesday, July 26, 2017, at 9:00 a.m.
PRESENT:
Janet L. Yellen, Chair
William C. Dudley, Vice Chairman
Lael Brainard
Charles L. Evans
Stanley Fischer
Patrick Harker
Robert S. Kaplan
Neel Kashkari
Jerome H. Powell
Raphael W. Bostic, Loretta J. Mester, Mark L. Mullinix, Michael Strine, and John C. Williams, Alternate Members of the Federal Open Market Committee
James Bullard, Esther L. George, and Eric Rosengren, Presidents of the Federal Reserve Banks of St. Louis, Kansas City, and Boston, respectively
Brian F. Madigan, Secretary
Matthew M. Luecke, Deputy Secretary
David W. Skidmore, Assistant Secretary
Scott G. Alvarez, General Counsel
Michael Held, Deputy General Counsel
Steven B. Kamin, Economist
Thomas Laubach, Economist
David W. Wilcox, Economist
James A. Clouse, Thomas A. Connors, Michael Dotsey, Eric M. Engen, Evan F. Koenig, Beth Anne Wilson, and Mark L.J. Wright, Associate Economists
Simon Potter, Manager, System Open Market Account
Lorie K. Logan, Deputy Manager, System Open Market Account
Ann E. Misback, Secretary, Office of the Secretary, Board of Governors
Michael S. Gibson, Director, Division of Supervision and Regulation, Board of Governors; Andreas Lehnert, Director, Division of Financial Stability, Board of Governors
Margie Shanks, Deputy Secretary, Office of the Secretary, Board of Governors
Stephen A. Meyer, Deputy Director, Division of Monetary Affairs, Board of Governors; Mark E. Van Der Weide, Deputy Director, Division of Supervision and Regulation, Board of Governors
Trevor A. Reeve, Senior Special Adviser to the Chair, Office of Board Members, Board of Governors
Joseph W. Gruber, David Reifschneider, and John M. Roberts, Special Advisers to the Board, Office of Board Members, Board of Governors
Linda Robertson,2 Assistant to the Board, Office of Board Members, Board of Governors
Joshua Gallin and David E. Lebow, Senior Associate Directors, Division of Research and Statistics, Board of Governors; Fabio M. Natalucci, Senior Associate Director, Division of Monetary Affairs, Board of Governors
Antulio N. Bomfim, Ellen E. Meade, Edward Nelson, Robert J. Tetlow, and Joyce K. Zickler, Senior Advisers, Division of Monetary Affairs, Board of Governors; Jeremy B. Rudd, Senior Adviser, Division of Research and Statistics, Board of Governors
Stephanie R. Aaronson and Glenn Follette, Assistant Directors, Division of Research and Statistics, Board of Governors; Elizabeth Klee, Assistant Director, Division of Monetary Affairs, Board of Governors
Penelope A. Beattie,2 Assistant to the Secretary, Office of the Secretary, Board of Governors
Dana L. Burnett, Section Chief, Division of Monetary Affairs, Board of Governors
John Kandrac, Senior Economist, Division of Monetary Affairs, Board of Governors
Mark Libell,3 Assistant Congressional Liaison, Office of Board Members, Board of Governors
Gregory L. Stefani, First Vice President, Federal Reserve Bank of Cleveland
David Altig, Kartik B. Athreya, Beverly Hirtle, Glenn D. Rudebusch, Ellis W. Tallman, and Christopher J. Waller, Executive Vice Presidents, Federal Reserve Banks of Atlanta, Richmond, New York, San Francisco, Cleveland, and St. Louis, respectively
Daniel Aaronson, Joe Peek, and Jonathan L. Willis, Vice Presidents, Federal Reserve Banks of Chicago, Boston, and Kansas City, respectively
Selection of Committee Officer
By unanimous vote, the Committee selected Mark E. Van Der Weide to serve as general counsel, effective at the time he becomes the Board of Governors' general counsel, until the selection of his successor at the first regularly scheduled meeting of the Committee in 2018.
Developments in Financial Markets and Open Market Operations
The manager of the System Open Market Account (SOMA) reported on developments in domestic and foreign financial markets over the period since the June FOMC meeting. The intermeeting period was relatively uneventful. Bond yields in advanced economies increased moderately, in part reflecting evolving market perceptions of prospects for foreign monetary policies. U.S. bond yields rose to a smaller degree, and the value of the dollar on foreign exchange markets decreased. Implied volatility in fixed-income markets remained low. Equity prices rose further, with notable advances in indexes for emerging markets.
The increase in the FOMC's target range for the federal funds rate at the June meeting was reflected in other money market interest rates, and the effective federal funds rate was near the middle of the new target range over the intermeeting period except on quarter-end. Take-up at the System's overnight reverse repurchase agreement facility averaged about $200 billion. Conditions in foreign exchange swap markets were fairly stable, and demand at central bank dollar auctions was relatively low. The manager also reported on small-value tests of open market operations, which are conducted routinely to promote operational readiness.
Market expectations for the path of the federal funds rate were little changed. Survey evidence suggested that most market participants now anticipated that the FOMC would announce at its September meeting a date for implementation of a change in reinvestment policy, although a couple of survey respondents expressed the view that the timing could be affected by developments regarding the federal debt ceiling. The survey results also suggested that, while views were somewhat dispersed, respondents typically expected effects on bond yields and spreads on mortgage-backed securities from the change in reinvestment policy to be modest.
By unanimous vote, the Committee ratified the Open Market Desk's domestic transactions over the intermeeting period. There were no intervention operations in foreign currencies for the System's account during the intermeeting period.
Staff Review of the Economic Situation
The information reviewed for the July 25-26 meeting showed that labor market conditions continued to strengthen in June and that real gross domestic product (GDP) likely expanded at a faster pace in the second quarter than in the first quarter. The 12-month change in overall consumer prices, as measured by the price index for personal consumption expenditures (PCE), slowed again in May; both total consumer price inflation and core inflation, which excludes consumer food and energy prices, were running below 2 percent. Data from the consumer and producer price indexes for June suggested that both total and core PCE price inflation (on a 12-month change basis) remained at a pace similar to that seen in the previous month. Survey-based measures of longer-run inflation expectations were little changed on balance.
Total nonfarm payroll employment expanded solidly in June, and the average monthly pace of private-sector job gains over the first half of the year was essentially the same as last year. The unemployment rate edged up to 4.4 percent in June; the unemployment rates for African Americans and for Hispanics declined slightly but remained above the unemployment rates for Asians and for whites. In addition, the median length of time that unemployed African Americans had been out of work exceeded the comparable figures for whites and for Hispanics, a pattern that has prevailed for at least the past two decades. The overall labor force participation rate edged up in June, and the share of workers employed part time for economic reasons rose a bit. The rate of private-sector job openings decreased in May after having risen for a couple of months, while the quits rate and the hiring rate both increased. The four-week moving average of initial claims for unemployment insurance benefits remained at a very low level through mid-July. Average hourly earnings for all employees increased 2-1/2 percent over the 12 months ending in June, about the same as over the comparable period a year earlier but a little slower than the rate of increase in late 2016.
Total industrial production rose moderately, on balance, in May and June, as an increase in the output of mines and utilities more than offset a net decline in manufacturing production. Automakers' assembly schedules indicated that motor vehicle production would edge down again in the third quarter, likely reflecting a somewhat elevated level of dealers' inventories and a slowing in the pace of vehicle sales last quarter. However, broader indicators of manufacturing production, such as the new orders indexes from national and regional manufacturing surveys, pointed to moderate gains in factory output over the near term.
Real PCE appeared to have rebounded in the second quarter after increasing only modestly in the first quarter. Much of the rebound looked to have been concentrated in spending on energy services and energy goods, which was held down by unseasonably warm weather earlier in the year. The components of the nominal retail sales data used by the Bureau of Economic Analysis to construct its estimate of PCE declined in June but rose, on net, in the second quarter. Light motor vehicle sales edged down further in June. However, recent readings on key factors that influence consumer spending--including continued gains in employment, real disposable personal income, and households' net worth--pointed to solid growth in total real PCE in the near term. Consumer sentiment, as measured by the University of Michigan Surveys of Consumers, remained upbeat despite having moved down in early July.
Residential investment seemed to have declined in the second quarter. Starts of both new single-family homes and multifamily units rose in June but still decreased for the second quarter as a whole. The issuance of building permits for both types of housing was lower in the second quarter than in the first quarter. Sales of existing homes decreased, on net, in May and June, and new home sales in May partly reversed the previous month's decline.
Real private expenditures for business equipment and intellectual property appeared to have increased moderately in the second quarter after a solid gain in the first quarter. Nominal shipments of nondefense capital goods excluding aircraft rose again in May, and new orders of these goods continued to exceed shipments, pointing to further gains in shipments in the near term. In addition, indicators of business sentiment remained upbeat. Investment in nonresidential structures appeared to have risen at a markedly slower pace in the second quarter than in the first. Firms' nominal spending for nonresidential structures excluding drilling and mining declined further in May, and the number of oil and gas rigs in operation, an indicator of spending for structures in the drilling and mining sector, leveled out in recent weeks after increasing steadily for the past year.
Nominal outlays for defense through June pointed to an increase in real federal government purchases in the second quarter. However, real purchases by state and local governments appeared to have declined. Payrolls for state and local governments expanded during the second quarter, but nominal construction spending by these governments decreased, on net, in April and May.
The nominal U.S. international trade deficit narrowed in May, with an increase in exports and a small decline in imports. Export growth was led by consumer goods, automotive products, and services. The import decline was driven by consumer goods and automotive products. The available data suggested that net exports were a slight drag on real GDP growth in the second quarter.
Total U.S. consumer prices, as measured by the PCE price index, increased 1-1/2 percent over the 12 months ending in May. Core PCE price inflation was also 1-1/2 percent over that same period. Over the 12 months ending in June, the consumer price index (CPI) rose 1-1/2 percent, while core CPI inflation was 1-3/4 percent. The median of inflation expectations over the next 5 to 10 years from the Michigan survey edged up both in June and in the preliminary reading for July. Other measures of longer-run inflation expectations were generally little changed, on balance, in recent months, although those from the Desk's Survey of Primary Dealers and Survey of Market Participants had ticked down recently.
Incoming data suggested that economic growth continued to firm abroad, especially among advanced foreign economies (AFEs). The pickup in advanced-economy demand also contributed to relatively strong growth in China and emerging Asia, but growth in Latin America remained relatively weak, partly reflecting tight monetary and fiscal policies. Despite the stronger momentum of economic activity in the AFEs, headline inflation declined sharply in the second quarter, largely reflecting lower retail energy prices, and core inflation stayed subdued in many AFEs. Although inflation was also low in most emerging market economies (EMEs), it remained elevated in Mexico because of rising food inflation and earlier peso depreciation.
Staff Review of the Financial Situation
Domestic financial market conditions remained generally accommodative over the intermeeting period. U.S. equity prices rose, longer-term Treasury yields increased slightly, and the dollar depreciated. The Committee's decision to raise the target range for the federal funds rate to 1 to 1-1/4 percent at the June meeting was widely anticipated in financial markets, and market participants reportedly viewed FOMC communications as largely in line with expectations. Financing conditions for nonfinancial businesses and households generally remained supportive of growth in spending.
FOMC communications over the intermeeting period were viewed as broadly in line with investors' expectations that the Committee would continue to remove policy accommodation at a gradual pace. Market participants generally interpreted the information on reinvestment policy provided in June in the Committee's postmeeting statement and its Addendum to the Policy Normalization Principles and Plans as consistent with their expectation that a change to reinvestment policy was likely to occur this year. Market participants also took note of the summary in the June minutes of the Committee's discussion of the progress toward the Committee's 2 percent longer-run inflation objective and the extent to which recent softness in price data reflected idiosyncratic factors. Overnight index swap rates pointed to little change in the expected path of the federal funds rate on net.
Yields on intermediate- and longer-term nominal Treasury securities increased slightly over the intermeeting period. Although yields fell following the publication of lower-than-expected CPI data, yields were boosted by comments from foreign central bank officials that investors read as pointing to less accommodative monetary policies abroad than previously expected. Measures of inflation compensation based on Treasury Inflation-Protected Securities ticked up since the June FOMC meeting. Despite their intermeeting period gains, longer-term real and nominal Treasury yields remained very low by historical standards, apparently weighed down by accommodative monetary policies abroad and possibly by declines in the long-term neutral real interest rate over recent years.
Broad U.S. equity price indexes rose. One-month-ahead option-implied volatility of the S&P 500 index--the VIX--remained at historically low levels. Spreads of yields on investment- and speculative-grade nonfinancial corporate bonds over comparable-maturity Treasury securities narrowed a bit on net.
Conditions in short-term funding markets were stable over the intermeeting period. Reflecting the FOMC's policy action in June, yields on a broad set of money market instruments moved about 25 basis points higher. However, over much of the period, the net increase in rates on shorter-dated Treasury bills was smaller, reportedly reflecting a reduction in Treasury bill supply.
Financing for large nonfinancial firms remained readily available, al-though debt issuance moderated. Gross issuance of corporate bonds stepped down in June from a strong pace in May, while issuance of institutional leveraged loans continued to be robust. Commercial and industrial lending by banks remained quite weak in the second quarter. Responses from the July Senior Loan Officer Opinion Survey on Bank Lending Practices (SLOOS) indicated that depressed demand was largely responsible, and that banks' lending standards were little changed in recent months. The most cited reason for the lackluster loan demand was subdued investment spending by nonfinancial businesses, but banks also reported that some borrowers had shifted to other sources of external financing or to internally generated funds.
Financing conditions for commercial real estate (CRE) remained accommodative, although the growth of CRE loans on banks' books slowed somewhat. Respondents to the July SLOOS reported tightening credit standards for these loans. SLOOS respondents also reported that standards on CRE loans were tight relative to their historical range, and that, on net, demand for CRE loans weakened in recent months. The pace of issuance of commercial mortgage-backed securities (CMBS) through the first half of the year was similar to that seen last year. Delinquency rates on loans in CMBS pools originated before the financial crisis continued to increase.
Financing conditions in the residential mortgage market were little changed, and flows of new credit continued at a moderate pace. However, growth of mortgage loans on banks' books slowed somewhat in the first half of this year. SLOOS respondents, on net, reported that standards on most residential mortgage loan categories eased slightly.
Consumer credit continued to grow on a year-over-year basis, but the expansion of credit card and auto loan balances appeared to slow from the rapid pace that was evident through the end of last year. In the July SLOOS, banks reported having tightened standards and widened spreads for credit card and auto loans on net. Standards for the subprime segments of these loan types were particularly tight compared with their historical ranges. Reflecting in part continued tightening of lending standards, consumer loan growth at banks moderated further in the second quarter; however, that weakness was partially offset by more robust lending by credit unions.
Since the June FOMC meeting, the broad dollar depreciated 2 percent, weakening more against AFE currencies than against EME currencies. The dollar's depreciation was driven in part by policy communications from the central banks of several AFEs that market participants viewed as less accommodative than expected as well as by weaker-than-expected CPI data in the United States. The Bank of Canada raised its policy rate in July. Sovereign yields increased notably in Canada, Germany, and the United Kingdom. Changes in foreign equity indexes were mixed over the intermeeting period: European equities edged lower, Japanese equities were little changed, and EME equities increased. European peripheral sovereign bond spreads narrowed over the period, reflecting in part positive sentiment related to the outcomes of the French parliamentary election, Greek debt negotiations, and bank resolutions in Italy. EME sovereign spreads were little changed on net.
The staff provided its latest report on potential risks to financial stability, indicating that it continued to judge the vulnerabilities of the U.S financial system as moderate on balance. This overall assessment incorporated the staff's judgment that, since the April assessment, vulnerabilities associated with asset valuation pressures had edged up from notable to elevated, as asset prices remained high or climbed further, risk spreads narrowed, and expected and actual volatility remained muted in a range of financial markets. However, the staff continued to view vulnerabilities stemming from financial leverage as well as maturity and liquidity transformation as low, and vulnerabilities from leverage in the nonfinancial sector appeared to remain moderate.
Staff Economic Outlook
The U.S. economic projection prepared by the staff for the July FOMC meeting was broadly similar to the previous forecast. In particular, real GDP growth, which was modest in the first quarter, was still expected to have stepped up to a solid pace in the second quarter and to maintain roughly the same rate of increase in the second half of the year. In this projection, the staff scaled back its assumptions regarding the magnitude and duration of fiscal policy expansion in the coming years. However, the effect of this change on the projection for real GDP over the next couple of years was largely offset by lower assumed paths for the exchange value of the dollar and for longer-term interest rates. Thus, as in the June projection, the staff projected that real GDP would expand at a modestly faster pace than potential output in 2017 through 2019. The unemployment rate was projected to decline gradually over the next couple of years and to continue running below the staff's estimate of its longer-run natural rate over this period.
The staff's forecast for consumer price inflation, as measured by the change in the PCE price index, was revised down slightly for 2017 in response to weaker-than-expected incoming data for inflation. As a result, inflation this year was expected to be similar in magnitude to last year, with an upturn in the prices for food and non-energy imports offset by a slower increase in core PCE prices and weaker energy prices. Beyond 2017, the forecast was little revised from the previous projection, as the recent weakness in inflation was viewed as transitory. The staff continued to project that inflation would increase in the next couple of years and that it would be close to the Committee's longer-run objective in 2018 and at 2 percent in 2019.
The staff viewed the uncertainty around its projections for real GDP growth, the unemployment rate, and inflation as similar to the average of the past 20 years. On the one hand, many financial market indicators of uncertainty remained subdued, and the uncertainty associated with the foreign outlook still appeared to be less than late last year; on the other hand, uncertainty about the direction of some economic policies was judged to have remained elevated. The staff saw the risks to the forecasts for real GDP growth and the unemployment rate as balanced. The risks to the projection for inflation also were seen as balanced. Downside risks included the possibilities that longer-term inflation expectations may have edged down, that the dollar could appreciate substantially, or that the recent run of soft inflation readings could prove to be more persistent than the staff expected. These downside risks were seen as essentially counterbalanced by the upside risk that inflation could increase more than expected in an economy that was projected to continue operating above its longer-run potential.
Participants' Views on Current Conditions and the Economic Outlook
In their discussion of the economic situation and the outlook, meeting participants agreed that information received over the intermeeting period indicated that the labor market had continued to strengthen and that economic activity had been rising moderately so far this year. Job gains had been solid, on average, since the beginning of the year, and the unemployment rate had declined, on net, over the same period. Household spending and business fixed investment had continued to expand. On a 12-month basis, both overall inflation and the measure excluding food and energy prices had declined and were running below 2 percent. Market-based measures of inflation compensation remained low; survey-based measures of longer-term inflation expectations were little changed on balance.
Participants generally saw the incoming information on spending and labor market indicators as consistent, overall, with their expectations and indicated that their views of the outlook for economic growth and the labor market were little changed, on balance, since the June FOMC meeting. Participants continued to expect that, with gradual adjustments in the stance of monetary policy, economic activity would expand at a moderate pace and labor market conditions would strengthen somewhat further. In light of continued low recent readings on inflation, participants expected that inflation on a 12-month basis would remain somewhat below 2 percent in the near term. However, most participants judged that inflation would stabilize around the Committee's 2 percent objective over the medium term.
Data received over the intermeeting period reinforced earlier indications that real GDP growth had turned up after having been slow in the first quarter of this year. As anticipated, growth in household spending appeared to have been stronger in the second quarter after its first-quarter weakness. Reports from District contacts on consumer spending were generally positive. However, sales of motor vehicles had softened, and automakers were reportedly adjusting production and assessing whether the underlying demand for automobiles had declined. Participants noted that the fundamentals underpinning consumption growth, including increases in payrolls, remained solid. However, the weakness in retail sales in June offered a note of caution.
Reports from District contacts on both manufacturing and services were also generally consistent with moderate growth in economic activity overall. Construction-sector contacts were generally upbeat. Reports on the energy sector indicated that activity was continuing to expand, albeit more slowly than previously; survey evidence suggested that oil drilling remained profitable in some locations at current oil prices. The agricultural sector remained weak, and some regions were experiencing drought conditions. A couple of participants had received indications from contacts that business investment spending in their Districts might strengthen.
Nevertheless, several participants noted that uncertainty about the course of federal government policy, including in the areas of fiscal policy, trade, and health care, was tending to weigh down firms' spending and hiring plans. In addition, a few participants suggested that the likelihood of near-term enactment of a fiscal stimulus program had declined further or that the fiscal stimulus likely would be smaller than they previously expected. It was also observed that the budgets of some state and local governments were under strain, limiting growth in their expenditures. In contrast, the prospects for U.S. exports had been boosted by a brighter international economic outlook.
Participants noted that labor market conditions had strengthened further over the intermeeting period. The unemployment rate rose slightly to 4.4 percent in June but remained low by historical standards. Payroll gains picked up substantially in June. In addition, the employment-to-population ratio increased. Participants observed that the unemployment rate was likely close to or below its longer-run normal rate and could decline further if, as expected, growth in output remained somewhat in excess of the potential growth rate. A few participants expressed concerns about the possibility of substantially overshooting full employment, with one citing past difficulties in achieving a soft landing. District contacts confirmed tightness in the labor market but relayed little evidence of wage pressures, although some firms were reportedly attempting to attract workers with a variety of nonwage benefits. The absence of sizable wage pressures also seemed to be confirmed by most aggregate wage measures. However, a few participants suggested that, in a tight labor market, measured aggregate wage growth was being held down by compositional changes in employment associated with the hiring of less experienced workers at lower wages than those of established workers. In addition, a number of participants suggested that the rate of increase in nominal wages was not low in relation to the rate of productivity growth and the modest rate of inflation.
Participants discussed the softness in inflation in recent months. Many participants noted that much of the recent decline in inflation had probably reflected idiosyncratic factors. Nonetheless, PCE price inflation on a 12-month basis would likely continue to be held down over the second half of the year by the effects of those factors, and the monthly readings might be depressed by possible residual seasonality in measured PCE inflation. Still, most participants indicated that they expected inflation to pick up over the next couple of years from its current low level and to stabilize around the Committee's 2 percent objective over the medium term. Many participants, however, saw some likelihood that inflation might remain below 2 percent for longer than they currently expected, and several indicated that the risks to the inflation outlook could be tilted to the downside. Participants agreed that a fall in longer-term inflation expectations would be undesirable, but they differed in their assessments of whether inflation expectations were well anchored. One participant pointed to the stability of a number of measures of inflation expectations in recent months, but a few others suggested that continuing low inflation expectations may have been a factor putting downward pressure on inflation or that inflation expectations might need to be bolstered in order to ensure their consistency with the Committee's longer-term inflation objective.
A number of participants noted that much of the analysis of inflation used in policymaking rested on a framework in which, for a given rate of expected inflation, the degree of upward pressures on prices and wages rose as aggregate demand for goods and services and employment of resources increased above long-run sustainable levels. A few participants cited evidence suggesting that this framework was not particularly useful in forecasting inflation. However, most participants thought that the framework remained valid, notwithstanding the recent absence of a pickup in inflation in the face of a tightening labor market and real GDP growth in excess of their estimates of its potential rate. Participants discussed possible reasons for the coexistence of low inflation and low unemployment. These included a diminished responsiveness of prices to resource pressures, a lower natural rate of unemployment, the possibility that slack may be better measured by labor market indicators other than unemployment, lags in the reaction of nominal wage growth and inflation to labor market tightening, and restraints on pricing power from global developments and from innovations to business models spurred by advances in technology. A couple of participants argued that the response of inflation to resource utilization could become stronger if output and employment appreciably overshot their full employment levels, although other participants pointed out that this hypothesized nonlinear response had little empirical support.
In assessing recent developments in financial market conditions, participants referred to the continued low level of longer-term interest rates, in particular those on U.S Treasury securities. The level of such yields appeared to reflect both low expected future short-term interest rates and depressed term premiums. Asset purchases by foreign central banks and the Federal Reserve's securities holdings were also likely contributing to currently low term premiums, although the exact size of these contributions was uncertain. A number of participants pointed to potential concerns about low longer-term interest rates, including the possibility that inflation expectations were too low, that yields could rise abruptly, or that low yields were inducing investors to take on excessive risk in a search for higher returns.
Several participants noted that the further increases in equity prices, together with continued low longer-term interest rates, had led to an easing of financial conditions. However, different assessments were expressed about the implications of this development for the outlook for aggregate demand and, consequently, appropriate monetary policy. According to one view, the easing of financial conditions meant that the economic effects of the Committee's actions in gradually removing policy accommodation had been largely offset by other factors influencing financial markets, and that a tighter monetary policy than otherwise was warranted. According to another view, recent rises in equity prices might be part of a broad-based adjustment of asset prices to changes in longer-term financial conditions, importantly including a lower neutral real interest rate, and, therefore, the recent equity price increases might not provide much additional impetus to aggregate spending on goods and services.
Participants also considered equity valuations in their discussion of financial stability. A couple of participants noted that favorable macroeconomic factors provided backing for current equity valuations; in addition, as recent equity price increases did not seem to stem importantly from greater use of leverage by investors, these increases might not pose appreciable risks to financial stability. Several participants observed that the banking system was well capitalized and had ample liquidity, reducing the risk of financial instability. It was noted that financial stability assessments were based on current capital levels within the banking sector, and that such assessments would likely be adjusted should these measures of loss-absorbing capacity change. Participants underscored the need to monitor financial institutions for shifts in behavior--such as an erosion of lending standards or increased reliance on unstable sources of funding--that could lead to subsequent problems. In addition, participants judged that it was important to look for signs that either declining market volatility or heavy concentration by investors in particular assets might create financial imbalances. A couple of participants expressed concern that smaller banks could be assuming significant risks in efforts to expand their CRE lending. Furthermore, a couple of participants saw, as possible sources of financial instability, the pace of increase in real estate prices in the multifamily segment and the pattern of the lending and borrowing activities of certain government-sponsored enterprises.
Participants agreed that the regulatory and supervisory tools developed since the financial crisis had played an important role in fostering financial stability. Changes in regulation had likely helped in making the banking system more resilient to major shocks, in promoting more prudent balance sheet management strategies on the part of nonbank financial institutions, and in reducing the degree to which variations in lending to the private sector intensify cycles in output and in asset prices. Participants agreed that it would not be desirable for the current regulatory framework to be changed in ways that allowed a reemergence of the types of risky practices that contributed to the crisis.
In their discussion of monetary policy, participants reaffirmed their view that a gradual approach to removing policy accommodation was likely to remain appropriate to promote the Committee's objectives of maximum employment and 2 percent inflation. Participants commented on a number of factors that would influence their ongoing assessments of the appropriate path for the federal funds rate. Most saw the outlook for economic activity and the labor market as little changed from their earlier projections and continued to anticipate that inflation would stabilize around the Committee's 2 percent objective over the medium term. However, some participants expressed concern about the recent decline in inflation, which had occurred even as resource utilization had tightened, and noted their increased uncertainty about the outlook for inflation. They observed that the Committee could afford to be patient under current circumstances in deciding when to increase the federal funds rate further and argued against additional adjustments until incoming information confirmed that the recent low readings on inflation were not likely to persist and that inflation was more clearly on a path toward the Committee's symmetric 2 percent objective over the medium term. In contrast, some other participants were more worried about risks arising from a labor market that had already reached full employment and was projected to tighten further or from the easing in financial conditions that had developed since the Committee's policy normalization process was initiated in December 2015. They cautioned that a delay in gradually removing policy accommodation could result in an overshooting of the Committee's inflation objective that would likely be costly to reverse, or that a delay could lead to an intensification of financial stability risks or to other imbalances that might prove difficult to unwind. One participant stressed that the risks both to the Committee's inflation objective and to financial stability would require careful monitoring. This participant expressed the view that a gradual approach to removing policy accommodation would likely strike the appropriate balance between promoting the Committee's inflation and full employment objectives and mitigating financial stability concerns.
A number of participants also commented that the appropriate pace of normalization of the federal funds rate would depend on how financial conditions evolved and on the implications of those developments for the pace of economic activity. Among the considerations mentioned were the extent of current downward pressure on longer-term yields arising from the Federal Reserve's asset holdings and how this pressure would diminish over time as balance sheet normalization proceeded, the strength and degree of persistence of other domestic and global factors that had contributed to the easing of financial conditions and elevated asset prices, and whether and how much the neutral rate of interest would rise as the economy continued to expand.
Participants also discussed the appropriate time to implement the plan for reducing the Federal Reserve's securities holdings that was announced in June in the Committee's postmeeting statement and its Addendum to the Policy Normalization Principles and Plans. Participants generally agreed that, in light of their current assessment of economic conditions and the outlook, it was appropriate to signal that implementation of the program likely would begin relatively soon, absent significant adverse developments in the economy or in financial markets. Many noted that the program was expected to contribute only modestly to the reduction in policy accommodation. Several reiterated that, once the program was under way, further adjustments to the stance of monetary policy in response to economic developments would be centered on changes in the target range for the federal funds rate. Al-though several participants were prepared to announce a starting date for the program at the current meeting, most preferred to defer that decision until an upcoming meeting while accumulating additional information on the economic outlook and developments potentially affecting financial markets.
Committee Policy Action
In their discussion of monetary policy for the period ahead, members judged that information received since the Committee met in June indicated that the labor market had continued to strengthen and that economic activity had been rising moderately so far this year. Job gains had been solid, on average, since the beginning of the year, and the unemployment rate had declined. Household spending and business fixed investment had continued to expand.
On a 12-month basis, overall inflation and the measure excluding food and energy prices had declined and were running below 2 percent. Market-based measures of inflation compensation remained low; survey-based measures of longer-term inflation expectations were little changed on balance.
With respect to the economic outlook and its implications for monetary policy, members continued to expect that, with gradual adjustments in the stance of monetary policy, economic activity would expand at a moderate pace, and labor market conditions would strengthen somewhat further. Inflation on a 12-month basis was expected to remain somewhat below 2 percent in the near term but to stabilize around the Committee's 2 percent objective over the medium term. Members saw the near-term risks to the economic outlook as roughly balanced, but, in light of their concern about the recent slowing in inflation, they agreed to continue to monitor inflation developments closely.
After assessing current conditions and the outlook for economic activity, the labor market, and inflation, members decided to maintain the target range for the federal funds rate at 1 to 1-1/4 percent. They noted that the stance of monetary policy remained accommodative, thereby supporting some further strengthening in labor market conditions and a sustained return to 2 percent inflation.
Members agreed that the timing and size of future adjustments to the target range for the federal funds rate would depend on their assessment of realized and expected economic conditions relative to the Committee's objectives of maximum employment and 2 percent inflation. They expected that economic conditions would evolve in a manner that would warrant gradual increases in the federal funds rate, and that the federal funds rate was likely to remain, for some time, below levels that are expected to prevail in the longer run. They also again stated that the actual path of the federal funds rate would depend on the economic outlook as informed by incoming data. In particular, they reaffirmed that they would carefully monitor actual and expected inflation developments relative to the Committee's symmetric inflation goal. Some members stressed the importance of underscoring the Committee's commitment to its inflation objective. These members emphasized that, in considering the timing of further adjustments in the federal funds rate, they would be evaluating incoming information to assess the likelihood that recent low readings on inflation were transitory and that inflation was again on a trajectory consistent with achieving the Committee's 2 percent objective over the medium term.
Members agreed that, at this meeting, the Committee should further clarify the time at which it expected to begin its program for reducing its securities holdings in a gradual and predictable manner. They updated the postmeeting statement to indicate that while the Committee was, for the time being, maintaining its existing reinvestment policy, it intended to begin implementing the balance sheet normalization program relatively soon, provided that the economy evolved broadly as anticipated. Several members observed that, in part because of the Committee's various communications regarding the change, any reaction in financial markets to such a change would likely be limited.
At the conclusion of the discussion, the Committee voted to authorize and direct the Federal Reserve Bank of New York, until it was instructed otherwise, to execute transactions in the SOMA in accordance with the following domestic policy directive, to be released at 2:00 p.m.:
"Effective July 27, 2017, the Federal Open Market Committee directs the Desk to undertake open market operations as necessary to maintain the federal funds rate in a target range of 1 to 1-1/4 percent, including overnight reverse repurchase operations (and reverse repurchase operations with maturities of more than one day when necessary to accommodate weekend, holiday, or similar trading conventions) at an offering rate of 1.00 percent, in amounts limited only by the value of Treasury securities held outright in the System Open Market Account that are available for such operations and by a per-counterparty limit of $30 billion per day.
The Committee directs the Desk to continue rolling over maturing Treasury securities at auction and to continue reinvesting principal payments on all agency debt and agency mortgage-backed securities in agency mortgage-backed securities. The Committee also directs the Desk to engage in dollar roll and coupon swap transactions as necessary to facilitate settlement of the Federal Reserve's agency mortgage-backed securities transactions."
The vote also encompassed approval of the statement below to be released at 2:00 p.m.:
"Information received since the Federal Open Market Committee met in June indicates that the labor market has continued to strengthen and that economic activity has been rising moderately so far this year. Job gains have been solid, on average, since the beginning of the year, and the unemployment rate has declined. Household spending and business fixed investment have continued to expand. On a 12-month basis, overall inflation and the measure excluding food and energy prices have declined and are running below 2 percent. Market-based measures of inflation compensation remain low; survey-based measures of longer-term inflation expectations are little changed, on balance.
Consistent with its statutory mandate, the Committee seeks to foster maximum employment and price stability. The Committee continues to expect that, with gradual adjustments in the stance of monetary policy, economic activity will expand at a moderate pace, and labor market conditions will strengthen somewhat further. Inflation on a 12-month basis is expected to remain somewhat below 2 percent in the near term but to stabilize around the Committee's 2 percent objective over the medium term. Near-term risks to the economic outlook appear roughly balanced, but the Committee is monitoring inflation developments closely.
In view of realized and expected labor market conditions and inflation, the Committee decided to maintain the target range for the federal funds rate at 1 to 1-1/4 percent. The stance of monetary policy remains accommodative, thereby supporting some further strengthening in labor market conditions and a sustained return to 2 percent inflation.
In determining the timing and size of future adjustments to the target range for the federal funds rate, the Committee will assess realized and expected economic conditions relative to its objectives of maximum employment and 2 percent inflation. This assessment will take into account a wide range of information, including measures of labor market conditions, indicators of inflation pressures and inflation expectations, and readings on financial and international developments. The Committee will carefully monitor actual and expected inflation developments relative to its symmetric inflation goal. The Committee expects that economic conditions will evolve in a manner that will warrant gradual increases in the federal funds rate; the federal funds rate is likely to remain, for some time, below levels that are expected to prevail in the longer run. However, the actual path of the federal funds rate will depend on the economic outlook as informed by incoming data.
For the time being, the Committee is maintaining its existing policy of reinvesting principal payments from its holdings of agency debt and agency mortgage-backed securities in agency mortgage-backed securities and of rolling over maturing Treasury securities at auction. The Committee expects to begin implementing its balance sheet normalization program relatively soon, provided that the economy evolves broadly as anticipated; this program is described in the June 2017 Addendum to the Committee's Policy Normalization Principles and Plans."
Voting for this action: Janet L. Yellen, William C. Dudley, Lael Brainard, Charles L. Evans, Stanley Fischer, Patrick Harker, Robert S. Kaplan, Neel Kashkari, and Jerome H. Powell.
Voting against this action: None.
Consistent with the Committee's decision to leave the target range for the federal funds rate unchanged, the Board of Governors voted unanimously to leave the interest rates on required and excess reserve balances unchanged at 1-1/4 percent and voted unanimously to approve establishment of the primary credit rate (discount rate) at the existing level of 1-3/4 percent.
It was agreed that the next meeting of the Committee would be held on Tuesday-Wednesday, September 19-20, 2017. The meeting adjourned at 10:00 a.m. on July 26, 2017.
Notation Vote
By notation vote completed on July 3, 2017, the Committee unanimously approved the minutes of the Committee meeting held on June 13-14, 2017.
Oops He Did It Again
Oops he did it again
So much for typically quiet summer markets, then again traders have never had to deal with a wild card commander and chief like Donald Trump. Throw out the old correlations and welcome to Trumpsville where to expect the unexpected is the norm.
Wednesday's incredibly whippy price actions were due to another in an endless sequence of President Trump blunders that continues to undermine the Whitehouse administration credibility and punish the US dollar
The latest miscue is Trump's remarks on the Charlottesville events which are having far reaching counteractions
Things got ugly Wednesday after Trump's Strategic and Policy Forum and Manufacturing Council of CEOs – both business advisory groups for the President – were dissolved. If you thought the president lacked the necessary key back room operators to implement the Whitehouse economic agenda, well things just got worse.
These headlines will have some far reaching implications that are likely to remain in the limelight for some time.
Predictably the dollar sagged, and safe havens were back in vogue, but the dollar fall-out intensified after the FOMC did little to stem the bloodletting. Cracks appear to be developing at the Federal Reserve Board over when to raise interest rates as the market reads the boards comments on inflation to be extremely dovish. Given the minutes were produced before last Friday's CPI miss it would suggest the bar is even higher now for the Feds to hike rates in December.
Euro
Those mystery ECB sources were at it again overnight suggesting the that Draghi's Jackson Hole appearance would not deliver a new policy message, implying he's giving in to the more dovish ECB elements. While the EURO initially sagged, – the Trump advisory board egression saw the EURO rebound
Australian Dollar
AUD outperformance caught traders off guard, thanks to the unexpected rally in base metals. Zinc made fresh highs, splintering the critical 3,000 level for the first time since the 2008 financial crisis. Copper is also on a tear. The move was triggered by new restrictions on Chinese refiners as the fear of tightened supplies boosts demand. The weakening dollar added prices also.
Broader USD weakness has the Aussie sitting more comfortably this morning perched above the .79 level
Japanese Yen
External factors remain the primary driver. Over night have demand for JPY was in vogue on the back of the latest Tump Dump.
Sterling Heads Up as UK Unemployment Hits 42-Year Low; Dollar Reaches Fresh Three-Week High
With North Korea and the US pulling back from their confrontation stance, the focus turned back to economic releases. The dollar followed an upward path despite weaker housing data, while better than expected labor figures in the UK pushed sterling higher. The lowered US crude inventories published during late European session lifted oil prices.
The dollar index peaked at a fresh three-week high of 94.14 during the European session, ignoring today's disappointing US data on building permits and housing starts. In July 1,223 million new buildings were authorized to be constructed, a number that was below the forecast of 1,250m and the previous reading of 1,275m. Relative to the previous month, this translates to a negative change of 4.1%, while expectations were for a 2% reduction. This followed a boost of 9.2% in June which was the highest monthly rate experienced since November 2015.
New residential buildings rose by 1,155m (annualized), falling short of 1,220m expected and 1,213m observed in the previous month. On a monthly basis, housing starts shrank by 4.8% compared to a growth of 7.4% in June and a 0.5% rise projected.
Now, the US economic calendar is pending the Fed meeting minutes. Those will be released today at 1800 GMT. The minutes are expected to shed some light on the reasons Fed policymakers held their policy steady and give more details on whether the central bank will proceed with another rate hike, justifying the New York Fed President William Dudley who claimed that a third hike might be needed before the year ends. In addition, investors will look for clues on the timing the Fed will start unwinding its balance sheet. Besides that, investors will keep a close eye on any developments in the NAFTA negotiations which kicked off today and expected to end on August 20.
The safe havens yen and gold continued their downtrend for the third day after risks of a nuclear war was played down, motivating investors to buy back riskier assets. Dollar/yen was last trading at 110.76, while the yellow metal was last seen at $1271.83 per ounce.
Meanwhile, in the UK, the Office for National Statistics published better than expected labor data, giving some support to sterling. According to the numbers, the unemployment rate edged down by 0.1 percentage points to 4.4% in June, better than the 4.5% that was expected by the forecasters. This was the lowest level reported since 1975 and was below the BOE's threshold of 4.5%. The office also released the change in the number of unemployed people for the month of July. Unemployed people surprisingly reduced by 4,200 for the first time after four months of rises, while analysts anticipated an increase by 3,700. In June, the figure had climbed by 3,500 (a downward revision from 6,000).
Moreover, weekly average earnings (three months) including bonuses in the three months to June grew unexpectedly by 2.1% y/y, compared to 1.9% in May (upwardly revised from 1.8%), while forecasts were for a rise of 1.8%. Excluding bonuses, earnings were up by 2.1% and above the forecast of 2%, which was also May's reading. Although wages started strengthening, British consumers could still feel inflationary pressures in their spending as prices grew faster than earnings. This also weighed on economic expansion which dropped this year and motivated BOE policymakers to lower GDP growth forecasts for the next two years.
As a response to the above, sterling jumped immediately by 0.36% to an intra-day high of $1.2901. However, its gains were short-lived as cable fell back to $1.2857 in late European session. Versus the euro, sterling climbed by 0.42% with euro/sterling sinking to 0.9099.
The euro reversed yesterday's gains against the greenback as media sources announced that the ECB chief Mario Draghi would not use the US Fed's Jackson Hole conference next Friday to deliver a message about the ECB's strategy to tighten monetary policy. Given the positive economic climate in the block, investors expected Draghi to take the opportunity and signal the start of unwinding the banks' ultra-loose monetary policy despite him saying in the last policy meeting he would hold off on the discussion until autumn. Before the news spread out, the euro was struggling to find support on preliminary GDP data out of the Eurozone. The GDP growth prints showed that eurozone's output expanded slightly by 0.1 percentage points in the second quarter to 2.2% y/y, surpassing the forecast of 2.1%. On a quarterly basis, the output growth remained unchanged at 0.6% as expected.
The euro changed hands with the dollar at $1.1694.
In the commodity markets, oil prices rose after the EIA report showed that US crude oil inventories fell by 8,945 million barrels last week, while expectations were for a drop of 3,058 million barrels. This reduction was the largest tracked since September 2016. In the preceding week ending, inventories were down by 6,451 million. On the day, WTI crude was 0.5% down at $47.33 per barrel, while Brent was up on the margin at $50.82 per barrel.
The commodity-linked loonie reacted positively to the EIA report, with dollar/loonie falling by 0. 50% to 1.2691.
Gold Halts Slide, FOMC Minutes Next
Gold has posted slight gains in the Wednesday session, following two consecutive days of losses. In North American trade, spot gold is trading at $1273.64, up 0.18% on the day. On the release front, housing numbers were weaker than expected. Building Permits dipped to 1.22 million shy of the forecast of 1.25 million. Housing Starts slowed to 1.16 million, missing the estimate of 1.22 million. Later in the day, the FOMC will release the minutes of its July policy meeting. On Thursday, there are two major events in the US – unemployment claims and the Philly Fed Manufacturing Index.
There was positive news from the consumer front, as Retail Sales and Core Retail Sales both beat their estimates, with gains of 0.6% and 0.5%, respectively. Consumer spending numbers are closely watched, as they are a key driver of economic growth. The strong gains in retail sales have helped raise investor risk appetite, which took a hit last week over the crisis in the Korean peninsula. This has boosted the stock markets, but hurt gold prices. Last week, tensions soared between the two enemies, sending gold about 2.4%, as investors dumped shares and snapped up the safe-haven metal. With the tension temperature dropping this week, risk appetite has returned, and gold prices have dropped 1.2% so far this week.
The Federal Reserve releases its July minutes later on Wednesday, and the markets will be listening closely. Although the minutes might not shed light on the likelihood of a rate hike before the end of the year, analysts will be looking for further details about the Fed's balance sheet, which has ballooned to $4.2 trillion. At the June policy meeting, the Fed outlined plans to begin reducing the balance sheet, but shied away from providing any details regarding the size of the reductions or a start time for the plan. Analysts expect September will be the start date, and the Fed could start the process by slowing its asset purchases by a modest amount, such as $10 billion/mth. Once the reductions start, the US dollar stands to gain ground for two reasons. First, the move would mark a vote of confidence in the US economy. Second, a reduction of $60 billion is expected to have the same effect as a quarter-point rate hike, which would make the dollar a more attractive asset for investors. In turn, this could weigh on gold prices.
Housing Starts Disappoint in July
Housing starts fell 4.8 percent to a 1.16 million-unit pace in July. Weakness was largely concentrated in multifamily, which fell 15.3 percent, while single-family slipped 0.5 percent. Permits fell 4.1 percent.
Single-Family Starts Better Than Monthly Print Implies
At first glance, today's housing starts report appears to extend a weak string of monthly reports only interrupted by the downwardly-revised gain in June. Moreover, given the ebullient builder sentiment reading yesterday, weakness in housing starts and permits during the month is a bit confounding. Indeed, housing starts have fallen in five of the last six months. However, much of the weakness has been in the multifamily component, which should not be surprising given slowing fundamentals.
To illustrate, starts are down 5.6 percent relative to a year earlier, but all of the weakness is concentrated in multifamily (5+units) which fell 35.2 percent in July, while single-family was up almost 11 percent. We find a similar trend with permits, which are forward-looking. On a year-ago basis, overall permits are up 4.1 percent, but the gain is in single-family and multifamily units with 2-4 units, while five or more units is down.
At the same time, builder sentiment jumped 4 points in August to 68, which is in line with the six-month moving average, with all components registering gains during the month. In our National Association of Home Builders/ Wells Fargo Housing Market Index write up released yesterday, we noted that single-family starts have not advanced as much as the stillelevated level of builder sentiment likely reflecting the shortage of lots and overall construction costs including labor. That said, the producer price index shows that inputs to residential construction rose 2.5 percent yearover- year in July, outpacing inflation. The shortage of labor is also putting upward pressure on construction costs and can be seen in average hourly earnings in the residential component.
Looking Ahead: The Residential Story Is Unchanged
For starters, residential lending standards are still supportive of the sector. On net, senior loan officers reported that standards for all residential real estate lending categories eased or were unchanged in Q2, while demand for most segments remained strong. Consistent with lending standards, loan growth for single-family residential (1-4 units) grew more than 11 percent in Q1 relative to a year earlier, which is more or less consistent with the pace of construction and land development loan growth. Lending for multifamily loans remained largely unchanged during the quarter.
Multifamily housing units (5+ units) completed, which reflect deliveries, were up almost 7 percent year-over-year in July. Much of the supply is still in luxury units. We continue to expect multifamily completions to peak this year, which should level off the recent moderation in asking rent growth.
The residential component of architecture billings, which is mostly apartments, jumped to its highest level in almost a year in June, intimating there is some upside.
Pound Yawns Despite Solid British Job Numbers
The British pound is showing limited movement in the Wednesday session. In North American trade, the pair is trading at 1.2864, down 0.05% on the day. On the release front, British employment numbers looked sharp. Average Earnings Index accelerated to 2.1%, above the estimate of 1.8%. Claimant Change declined 4.2 thousand, compared to an estimate of a gain of 3.2 thousand. Finally, the unemployment rate dropped to 4.4%, edging below the forecast of 4.5%. Over in the US, housing numbers were softer than expected. Building Permits dipped to 1.22 million shy of the forecast of 1.25 million. Housing Starts slowed to 1.16 million, missing the estimate of 1.22 million. Later in the day, the FOMC will release the minutes of its July policy meeting. On Thursday, the UK releases Retail Sales. There are two major events in the US – unemployment claims and the Philly Fed Manufacturing Index.
The pound lost ground on Wednesday, as British CPI remained unchanged at 2.6% in July. Inflation has dropped considerably since May, when CPI came in at 2.9%. With inflation levels weakening, the pressure has eased on the BoE to raise interest rates. BoE policymakers have been divided over monetary policy, with recent policy meetings showing a sizable majority in favor raising rates. However, BoE Governor Mark Carney has come out against raising hikes in the near future, citing continuing uncertainty on how Brexit will affect the UK economy. The BoE still sees high inflation levels ahead, saying that CPI could hit around 3% in October. This means that policymakers will have to make some tough decisions regarding interest rate policy in the next few months.
With the reality of Brexit coming ever closer, there are growing concerns in the British business sector, notably what happens on the "day after". There has been discussion about a transition period, before the actual departure date from the European Union. This would minimize the destabilizing effect of Brexit on the British economy. On Tuesday, the government said that it will seek an "interim customs agreement" with the continent, which would last up to two years. Under the proposal, Britain would enjoy tariff-free trade with the EU, while being able to negotiate free trade agreements at the same time. However, it's questionable whether the EU, which has already taken a hard negotiating stance with Britain, will agree with such an arrangement. The two sides will meet next on August 28 for another round of what promise to be arduous talks.
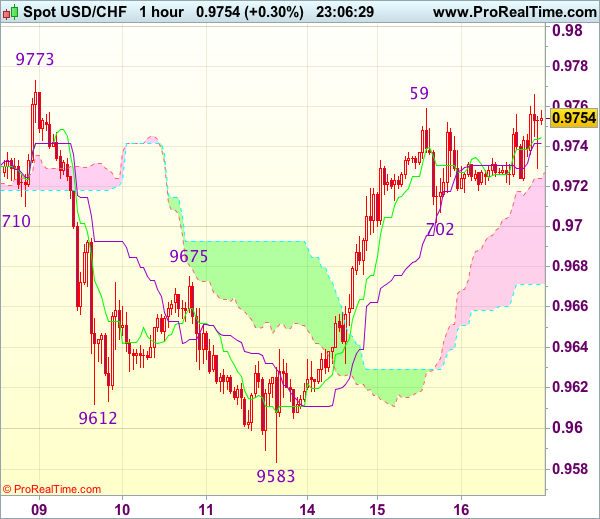
Trade Idea Wrap-up: USD/CHF – Buy at 0.9680
USD/CHF - 0.9749
Most recent candlesticks pattern : N/A
Trend : Near term up
Tenkan-Sen level : 0.9745
Kijun-Sen level : 0.9642
Ichimoku cloud top : 0.9724
Ichimoku cloud bottom : 0.9671
Original strategy :
Buy at 0.9690, Target: 0.9790, Stop: 0.9655
Position : -
Target : -
Stop : -
New strategy :
Buy at 0.9680, Target: 0.9780, Stop: 0.9645
Position : -
Target : -
Stop : -
As the greenback has maintained a firm undertone after staging a strong rebound from 0.9583 (last week’s low), adding credence to our view that the retreat from 0.9773 has ended there, hence consolidation with upside bias remains for another test of said resistance, however, break there is needed to confirm early rise from 0.9438 low has resumed and extend gain to 0.9808 and possibly 0.9825 resistance, having said that, near term overbought condition should limit upside and price should falter below previous support at 0.9859.
In view of this, we are looking to reinstate long on pullback as 0.9690-95 should limit downside and bring another rise later. Below previous resistance at 0.9675 would defer and risk weakness towards 0.9640 but downside should be limited to 0.9615-20 and bring another rise later.
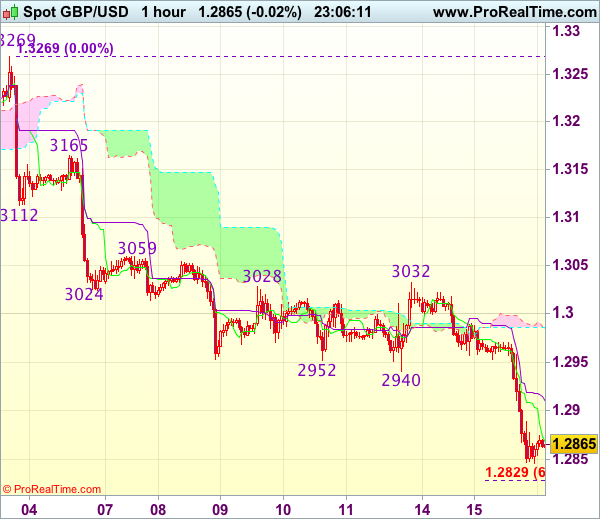
Trade Idea Wrap-up: GBP/USD – Sell at 1.2920
GBP/USD - 1.2863
Most recent candlesticks pattern : N/A
Trend : Near term down
Tenkan-Sen level : 1.2868
Kijun-Sen level : 1.2910
Ichimoku cloud top : 1.2986
Ichimoku cloud bottom : 1.2984
Original strategy :
Sell at 1.2920, Target: 1.2820, Stop: 1.2955
Position : -
Target : -
Stop : -
New strategy :
Sell at 1.2920, Target: 1.2820, Stop: 1.2955
Position : -
Target : -
Stop : -
As cable has remained under pressure after breaking below support at 1.2933-40, adding credence to our bearish view that the decline from 1.3269 top is still in progress for retracement of early upmove, hence downside bias remains for further weakness to 1.2825-30 (61.8% projection of 1.3269-1.2940 measuring from 1.3032), having said that, near term oversold condition should limit downside to 1.2800 and reckon 1.2770 would hold from here, bring rebound later.
In view of this, would not chase this fall here and would be prudent to sell sterling on recovery as said previous support at 1.2933 should turn into resistance and cap cable’s upside, bring another decline. Above 1.2950 would defer and risk a stronger rebound to 1.2990-00 before another decline.
Ahead of Fed & ECB Minutes
Commodity currencies dominate a quiet Wednesday summer session as traders await this evening's release of the minutes from the Jul 26-27 FOMC meeting. Recall the dollar fell sharply on that day, partly due to escalating adversity between the White House and Washington as well as the Fed statement itself.
So what did the Fes say on Jul 27? The Committee made two minor changes: i) saying inflation was 'below' target rather than 'somewhat below'; and; ii) that the balance sheet runoff will start 'relatively soon' which could mean later than September. Also note that 3 weeks after the Fed decision, July CPI was a miss. Today's minutes may further enlighten us whether the inflation tweek was a mark-to-market reflection or a possible sign of the Fed's plan.
Let's also not forget tomorrow's release of the ECB minutes from the Jul 20 meeting/press conference, which triggered broad EUR strength and sharp DAX selling after the ECB was perceived to be largely on course towards curtailing QE. Today's rally in the DAX and retreat in the euro were spurred by Reuters reports that Draghi will not make any policy-related remarks at next week's scheduled speech at the Jackson Hole symposium, thus, allaying (or delaying) worries about any references to a curtailing QE. Yet, this remains a matter of "when" rather than "if".