
Sample Category Title
Trade Idea: EUR/JPY – Buy at 129.45
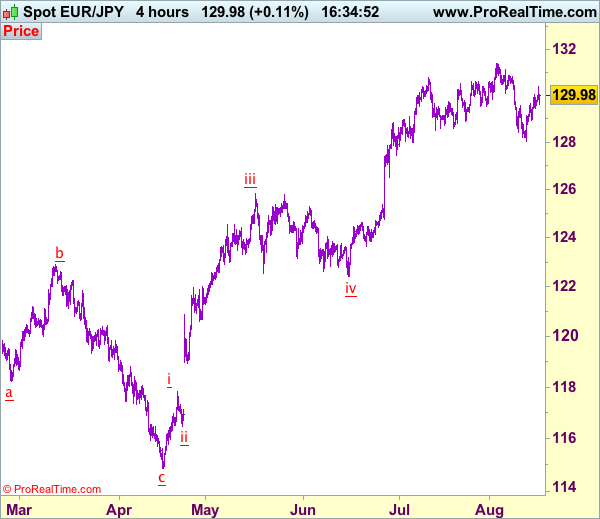
EUR/JPY - 130.18
Recent wave: A 5-waver is unfolding from 114.85 with wave iii and iv ended at 125.82 and 122.40 respectively, wave v has possibly ended at 131.40.
Trend: Near term up
Original strategy:
Buy at 129.00, Target: 130.50, Stop: 128.40
Position: -
Target: -
Stop: -
New strategy :
Buy at 129.45, Target: 131.00, Stop: 128.85
Position: -
Target: -
Stop:-
As the single currency has maintained a firm undertone after staging a strong rebound from 128.05, adding credence to our view that at least the first leg of decline from 131.40 top has ended there and consolidation with mild upside bias is seen for further gain to 130.50, then towards 130.85-90, however, as broad outlook remains consolidative, upside would be limited and said resistance at 131.40 should remain intact, bring another retreat later this week.
In view of this, we are looking to turn long on dips as 129.40-50 should limit downside and bring another rebound. Below 128.90-95 would risk weakness to 128.50, then retest of Friday’s low at 128.05 but break there is needed to revive bearishness and signal the decline from 131.40 top is under way for retracement of early upmove to 127.50-60, then towards 127.00-10.
Our latest preferred count is that wave (ii) is ABC-X-ABC which ended at 123.33 and wave (iii) is unfolding with wave iii ended at 100.77, followed by wave iv at 111.57 and wave v as well as the wave (iii) has ended at 97.04, followed by wave (iv) at 111.43 and wave (v) has ended at 94.12 which is also the end of the larger degree v, this also implied the major wave (C) has also ended there, hence major correction has commenced from there with (A) leg unfolding in its lower degree wave c which has possibly ended at 145.69. Under this count, A-B-C wave (B) has commenced with A leg ended at 136.23, wave B at 143.79 and wave C has possibly ended at 149.79.
Our larger degree count is that the decline from 139.26 is wave (C) and is sub-divided into a diagonal triangle i-ii-iii-iv-v with wave i - 105.44, wave ii- 123.33, wave iii - 97.03, wave iv - 111.43, followed by the final wave v as well as the end of wave (C) at 94.12, this also mark the bottom of larger degree wave B. Under this count, major rise in wave C has commenced as an impulsive wave with minor wave III ended at 145.69, wave V is still in progress for further gain to 150.00. Having said that, this so-called wave V could well be the first leg of larger degree 5-waver wave C and this wave C should bring at least a retest of wave A top at 169.97 (July 2008).
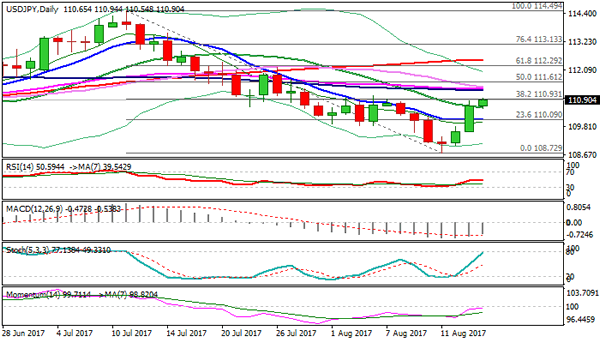
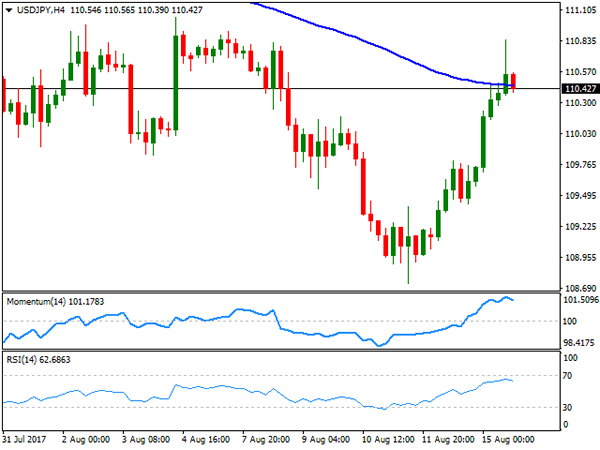
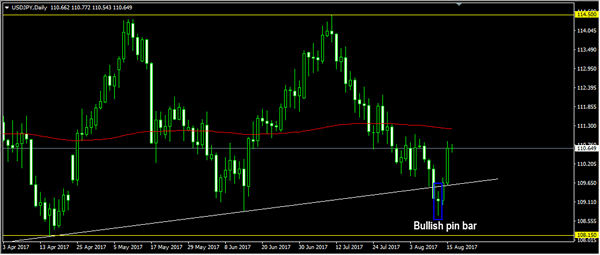
Technical Outlook: USDJPY Attacks Strong 111.00 Resistance Zone, Looks For Further Upside On Strong Bullish Sentiment
The pair remains supported and cracks the first barrier in 111.00 resistance zone (Fibo 38.2% of 114.59/108.72 downleg) and eyes next pivot at 111.04 (04 Aug high).
Upbeat US data and hawkish comments from Fed official boost hopes for Fed rate hike in Sep, supporting dollar's bullish sentiment in the near-term.
Sustained break above 111.00 pivot would open way towards a cluster of barriers above: converged 100/55SMA at 111.30, 30SMA at 111.40 and daily cloud base at 111.64.
Broken 20SMA now acts as initial support at 110.58, with psychological 110.00 support expected to contain extended dips.
Res: 111.04, 111.30, 111.40, 111.64
Sup: 110.58, 110.00, 109.80, 109.60
Markets Look To FOMC Minites For Direction
Monetary policy is back in focus on Wednesday, with the Federal Reserve scheduled to release the minutes of last month’s rate meeting. A deluge of economic data on both sides of the Atlantic will also drive market activity.
The economic data wire begins at 08:00 GMT with Italian gross domestic product (GDP). The Eurozone’s third largest economy expanded 0.4% in the second quarter and 1.4% annually, based on a median estimate of analysts.
A half hour later, the UK Office for National Statistics will release its latest batch of employment data for the months of June and July. The ILO-calculated unemployment rate for the three months prior to June will be presented. July claimant count data will also be made available.
The biggest data release of the session takes place at 09:00 GMT when the European Commission’s statistics branch reports on second quarter GDP. The euro area economy is forecast to grow 0.6% in the second quarter, confirming an earlier estimate.
The North American session features several notable releases, beginning at 12:30 GMT with monthly data on housing starts and building permits. Starts are forecast to climb 0.5% in July to a seasonally adjusted annual pace of 1.22 million units. Building permits, a proxy for future construction plans, are forecast to fall 2% to a 1.25 million-unit pace.
Energy traders will also be keeping an eye on the weekly crude inventory report from the US Energy Information Administration (EIA) at 14:30.
At 18:00 GMT, the US central bank will release the minutes of the July Federal Open Market Committee (FOMC) policy meeting. Although the Fed kept rates on hold last month, policymakers likely deliberated about how to wind down their $4.5 trillion balance sheet. Those discussions will be presented in the official transcript on Wednesday.
EUR/USD
The euro’s gradual downtrend continued on Tuesday, with prices briefly falling below 1.1700. The EUR/USD faces a critical support line at 1.1688, according to the analysts at Commerzbank. A fall below that key level could expose the pair to heavier losses. On the upside, firm resistance is seen at the August high near 1.1910.
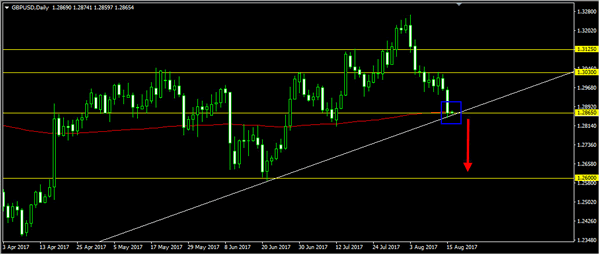
GBP/USD
The British pound declined sharply on Tuesday, as the dollar rebounded against a basket of world currencies. After a 100-pip decline, the GBP/USD exchange rate is trading near seven-week lows, with immediate support located at 1.2830. On the opposite side of the ledger, resistance is likely found at 1.2910.
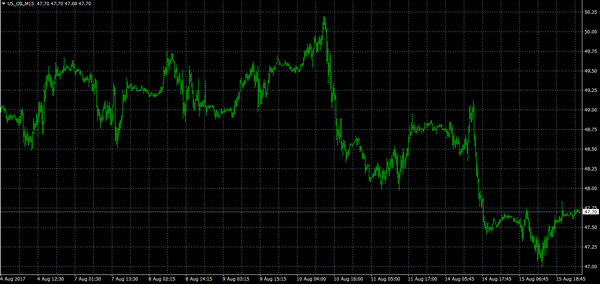
OIL
Crude prices rebounded on Wednesday, but remained under selling pressure following a series of volatile moves. US crude futures for September delivery were trading below $48.00 a barrel during Asian trade. The daily technical indicators remain bearish, with immediate resistance seen just above the $48.00 region.
Trade Idea: AUD/USD – Stand aside
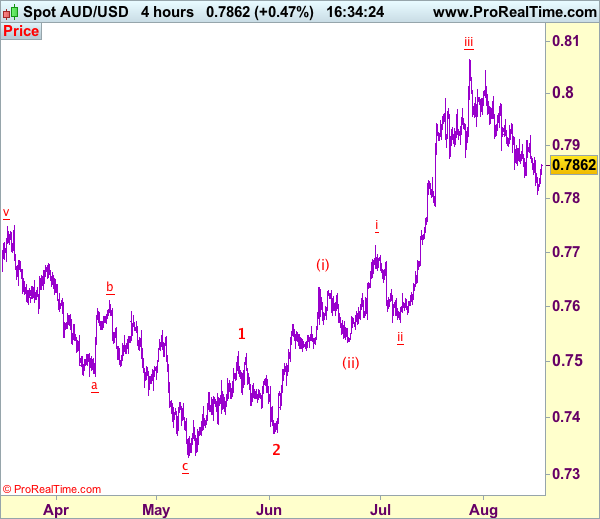
AUD/USD – 0.7861
Recent wave: Wave 5 ended at 1.1081 and major correction has commenced for fall to 0.7000 and then towards 0.6500-10
Trend: Near term up
Original strategy :
Sell at 0.7915, Target: 0.7675, Stop: 0.7975
Position: -
Target: -
Stop: -
New strategy :
Stand aside
Position: -
Target: -
Stop:-
Despite falling to 0.7808 yesterday, the subsequent rebound suggests consolidation above this level would be seen and recovery to 0.7900 cannot be ruled out, however, a sustained breach above resistance at 0.7919 is needed to signal low has been formed there, bring a stronger rebound towards 0.7945-50 but resistance at 0.7980 should cap upside, bring further consolidation later. In the event aussie breaks above 0.8000, this would suggest the pullback from 0.8066 top has ended and bring eventual retest of this level.
On the downside, below said support at 0.7808 would signal the fall from 0.8066 top (wave iii peak) is still in progress and downside risk remains for retracement of early upmove in wave iv to 0.7786 support, however, near term oversold condition should prevent sharp fall below 0.7750 and price should stay above i top at 0.7712, bring rebound later. We are keeping our latest bullish count that recent impulsive waves is unfolding as (1 2, (i)(ii), i ii) and may extend headway towards 0.8150.
On the 4-hour chart, the move from 0.8066 is the wave 5 with i: 0.8860, ii: 0.8315, wave iii is an extended move ended at 1.0183, iv: 0.9706 and wave v has ended at 1.1081 (also the top of entire wave 5). The subsequent selloff is the major correction which is unfolding as ABC-X-ABC and 2nd A leg has ended at 0.8848, followed by a-b-c wave B which ended at 0.9758, hence, 2nd C wave is now in progress and indicated downside target at 0.7000 and 0.6950 had been met, so further fall to 0.6710-20 cannot be ruled out.
Forex Technical Analysis: EUR/USD, USD/JPY, GBP/USD
EUR/USD
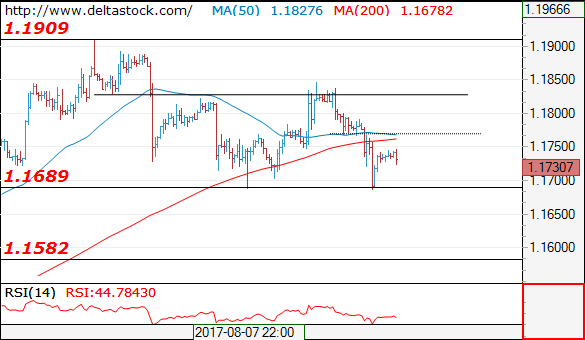
Current level - 1.1730
My outlook here remains bearish, for a break through 1.1687 lows, towards 1.1580. Key intraday resistance lies at 1.1770 and it should cap every attempt for a corrective rebound.
| Resistance | Support | ||
| intraday | intraweek | intraday | intraweek |
| 1.1770 | 1.1909 | 1.1680 | 1.1580 |
| 1.1830 | 1.2000 | 1.1580 | 1.1480 |
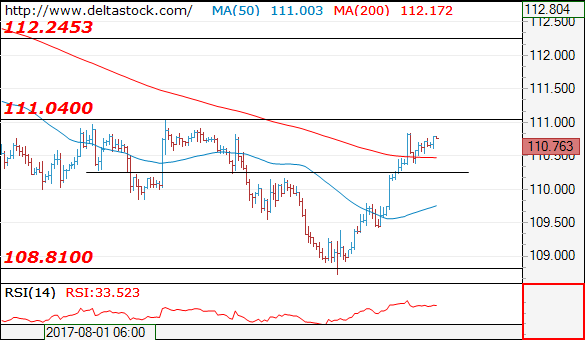
USD/JPY
Current level - 110.25
The recent break through 110.30 resistance confirms the positive outlook, and current minor consolidation pattern above that area is a prelude to a break through 111.10 hurdle, towards 112.20 major resistance.
| Resistance | Support | ||
| intraday | intraweek | intraday | intraweek |
| 111.10 | 112.20 | 110.30 | 108.10 |
| 112.20 | 114.50 | 108.80 | 107.00 |
GBP/USD
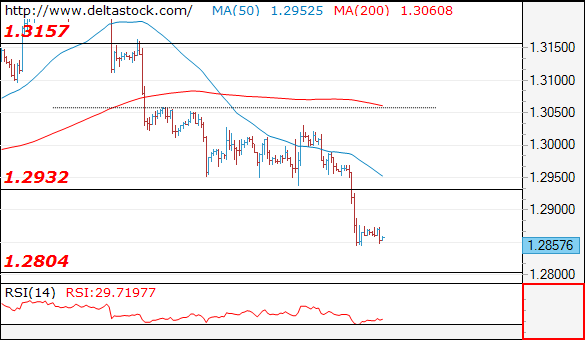
Current level - 1.2967
The downtrend has been confirmed and the bias is bearish below 1.2930, for a slide towards 1.2804, en route to 1.2705 zone.
| Resistance | Support | ||
| intraday | intraweek | intraday | intraweek |
| 1.2930 | 1.3260 | 1.2804 | 1.2804 |
| 1.3050 | 1.3500 | 1.2705 | 1.2480 |
Will The FOMC Minutes Show More Officials Joining The Cautious Camp?
Today, the main event will be the release of the July FOMC meeting minutes. The statement accompanying that decision was very similar to the previous one, with the only changes relating to the inflation outlook and timing of the balance sheet normalization. We expect the financial community to dig into the minutes looking for more precise clues on the timing of the B/S normalization, other than the 'relatively soon' part of the statement.
The statement was not clear on the inflation front either. The acknowledgment of inflation 'running below 2%' was a downgrade from the previous description that it was 'running somewhat below 2%'. However, officials still expect it to stabilize around the target over the medium term. In our view, this doesn't paint a clear picture of the Committee's view on inflation. The minutes of the June meeting showed a split Committee, with some members attributing the recent softness in prices to idiosyncratic factors, while others expressed concerns that this weakness may persist. Up until the July gathering, the latter camp appeared to be right, as inflation continued to drift lower. If the minutes show that this cautious camp among policymakers has grown larger, the market probability for another hike in 2017 may decline (from 50% currently), and USD could come under renewed selling interest.
EUR/USD traded lower yesterday, breaking below the crossroads of the 1.1750 (R1) hurdle and the short-term uptrend line taken from the low of the 23rd of June. The pair found fresh buy orders near the 1.1690 (S1) level and subsequently, it rebounded. The break below the aforementioned uptrend line has shifted the short-term bias to flat in our view. That said, in case the FOMC minutes today signal that the cautious camp among the FOMC is growing larger, the latest rebound could continue. A clear break back above 1.1750 (R1) could set the stage for further upside recovery, towards the 1.1830 (R2) zone.
Switching to the daily chart, even though the short-term outlook may have turned neutral, the fact that EUR/USD is still trading above a medium-term uptrend line drawn from the low of the 17th of April keeps the broader picture positive, in our view.
Australia's wage growth remains subdued
Overnight, Australia's wage price index for Q2 showed that wages rose at the same lackluster pace as in Q1. We think this is likely to confirm the RBA's concerns that even though the labor market continues to tighten, there is still no significant upward pressure on wage growth. The continued softness in wages enhances our view that the RBA is likely to remain on hold for the foreseeable future, and suggests that the Bank is unlikely to shift to a more hawkish stance anytime soon. As for AUD, we believe that its outlook is neutral for now. With the RBA unlikely to change tune, the currency's forthcoming direction may be decided primarily by incoming data, movements in iron ore prices, and changes in risk sentiment. Technically, it will be critical to see whether AUD/USD breaks below, or rebounds, from the key area of 0.7800, which acted as the upper bound of the wide sideways range that contained the price action from March 2016 until July 2017.
As for today's economic data:
In the UK, employment data for June will attract attention. The consensus is for the unemployment rate to have remained unchanged, while average weekly earnings are anticipated to have risen at the same pace as previously. We view the risks surrounding the unemployment rate forecast as tilted to the downside, considering that the services PMI for June showed the strongest increase in employment growth since April 2016. A downside surprise could support GBP. Otherwise, market focus may be primarily on any surprise in wages, which have remained subdued in recent months despite the notable pickup in inflation, keeping real wage growth in the UK negative and thereby, dampening the outlook for household spending and economic growth.
What's more, the fact that wages remain subdued confirms the BoE's view that domestic inflationary pressures have not picked up, and that the overshoot in inflation entirely reflects the drop in sterling. Unless wages accelerate materially in the coming months (alongside economic growth), we maintain our view that a rate hike by the BoE in the near-term is a remote scenario, especially considering yesterday's slowdown in core inflation.
GBP/USD tumbled yesterday, to find support near the key zone of 1.2850 (S1). The price structure on the 4-hour chart suggests a short-term downtrend, but considering the pair's proximity to the crossroads of the critical 1.2850 (S1) level and the longer-term uptrend line taken from the lows of the 7th of October, we prefer to stay sidelined for now. A potential decline in the UK unemployment rate today could prove the catalyst for a rebound from the aforementioned crossroads. We prefer to wait for a clear close below that crossroads before we become confident that the latest downtrend may continue.
From Eurozone, we get the 2nd estimate of GDP for Q2 while in the US, building permits and housing starts for July are due out.
EUR/USD
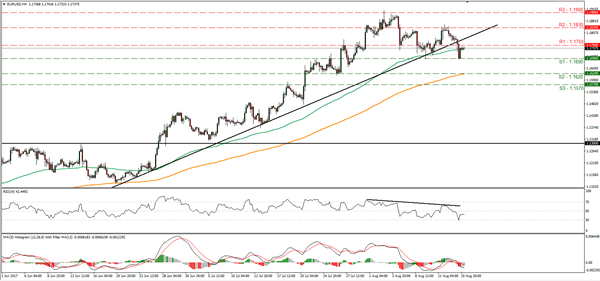
Support: 1.1690 (S1), 1.1620 (S2), 1.1570 (S3)
Resistance: 1.1750 (R1), 1.1830 (R2), 1.1900 (R3)
GBP/USD
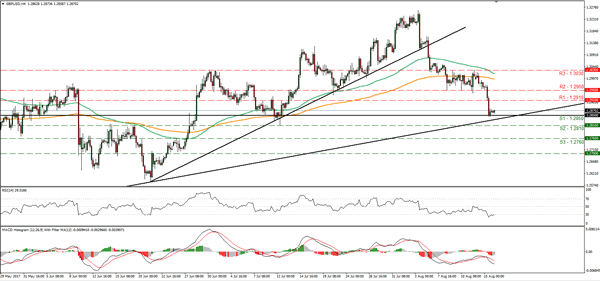
Support: 1.2850 (S1), 1.2810 (S2), 1.2760 (S3)
Resistance: 1.2910 (R1), 1.2950 (R2), 1.3030 (R3)
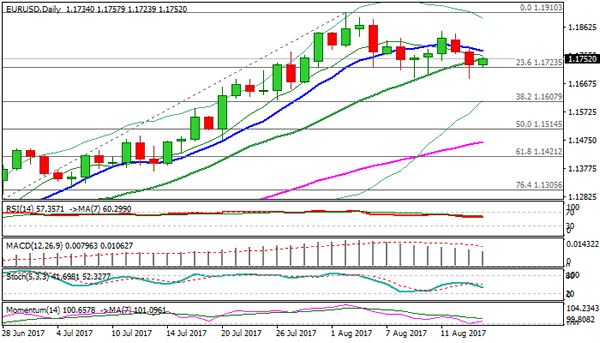
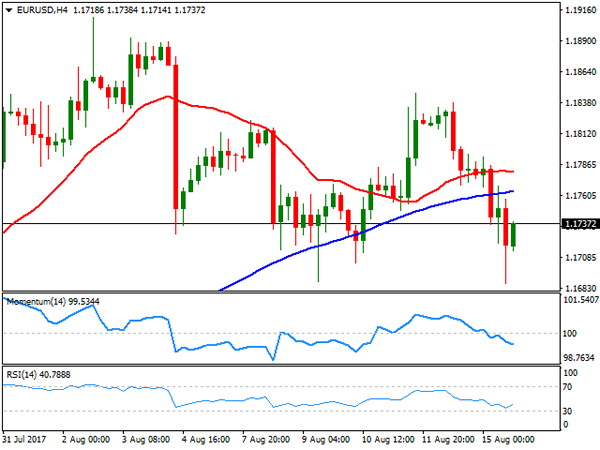
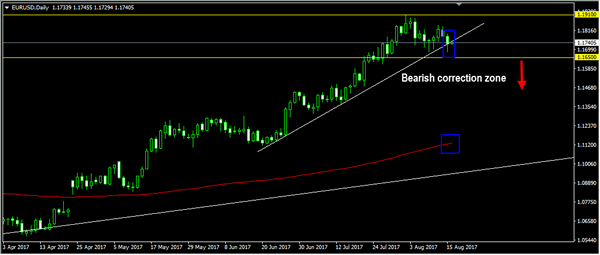
Technical Outlook: EURUSD – Strong Support At 1.1689 So Far Contained Downside Attempts
The Euro is holding within narrow range in early Wednesday's trading and consolidating fall of past two days that was so far contained by strong support at 1.1689 (09 Aug low).
Yesterday's repeated strong rejection at 1.1689 suggests the pair might spend some time in consolidation mode, before establishing in fresh direction.
Broken 20SMA marks initial resistance at 1.1751 and caps today's action for now, guarding south-turned 10SMA (1.1779). Break of these barriers would shift near-term bias higher and expose key n/t barrier at 1.1846 (11 Aug high).
Overall bullish structure keeps focus at the upside and eyes targets at 1.1910 and 1.2000 after correction, with stronger signs of bullish resumption while 1.1689 support holds. Further bullish acceleration could be expected on break above 20/10SMA pivots.
Otherwise, risk of deeper correction could be expected on firm break below 1.1689 that will complete Failure Swing pattern on daily chart and expose next strong support at 1.1607 (Fibo 38.2% of 1.1188/1.1910).
Eurozone Q2 GDP release is due today, with forecast unchanged from the first quarter (2.1% y/y, 0.6% q/q).
Res: 1.1779, 1.1800, 1.1838, 1.1846
Sup: 1.1723, 1.1689, 1.1640, 1.1607
Foreign Exchange Market Commentary: EUR/USD, USD/JPY, GBP/USD, GOLD, WTI CRUDE, DJIA, FTSE100, DAX
EUR/USD
Dollar gains extended on Tuesday, as easing geopolitical tensions coupled with better-than-expected US data. The EUR/USD pair extended its monthly decline down to 1.1686, early US session, with the following bounce well contained and with the pair ending the day around 1.1730. Partially responsible of the EUR's decline was the German's Q2 preliminary GDP, as the county grew at a slower-than-expected pace in the three months two June, although Q1 figures suffered upward revisions, and the figures were solid enough to indicate steady growth in the country. According to Destatis the economy grew by 0.6% in the quarter, while on a YoY, unadjusted basis, the economy advanced by 0.8%, well below previous 3.2%.
In the US, July retail sales figures were better-than-expected, with the main monthly reading rising 0.6%, above the consensus 0.3% forecast, whilst June figure was upwardly revised from -0.2%MoM to +0.3%MoM. Also, business activity grew at a much stronger-than-expected pace in the NY State according to the local manufacturing index that jumped to 25.2 in August from 9.0 in July. Overall, and while inflation is still a drag, the US economy seems to be strong enough to tolerate a third rate hike this year.
The EUR/USD pair has set a lower high for the week, with an early attempt to rally beyond 1.1800 being quickly reverted, adding to the case of a bottom to the latest dollar slump. From a technical point of view, however, the 1.1690 region is still proving to be a nice "buying on dips" level, although if the price does not advance beyond 1.1760, bulls may prefer to take profits out. Technical readings in the 4 hours chart, indicate that the pair may continue falling, as the Momentum indicator keeps grinding south within negative territory while the RSI consolidates around 40, and the price below its moving averages. These lasts, are losing directional strength and within a limited range, reflecting the uncertainty going on about where to go next.
Support levels: 1.1770 1.1735 1.1690
Resistance levels: 1.1820 1.1860 1.1910
USD/JPY
The USD/JPY pair settled at 110.43 after trading as high as 110.84 early US session, fueled by easing geopolitical concerns and a batch of solid US data that spooked away fears of an on-hold Fed for the rest of the year. The Yen was hit during Asian trading hours by news that North Korea backed away from its threat to launch missiles towards Guam, later pressured by rising stocks and bond yields. The US Treasury 10-year note yield peaked at 2.27% for the day, up from Friday's settlement at 2.19%, although the poor performance of Wall Street and yields retreating modestly in the US afternoon, helped the pair correcting lower. The Japanese calendar will remain empty this Wednesday, with the focus on US housing data and the latest FOMC minutes to be released later on the day. In the meantime, the 4 hours chart shows that the price settled around its 100 SMA, while technical indicators are losing upward strength near overbought readings, indicating decreasing buying interest at current levels. The pair needs to advance beyond 111.05 to be able to resume its advance during the upcoming sessions, and approach then to the 112.00 figure.
Support levels: 110.35 110.00 109.70
Resistance levels: 111.05 111.40 111.80
GBP/USD
The GBP/USD pair plunged to 1.2845 its lowest in over a month, after a second consecutive UK inflation reading below expected, dented further the case of a near-term rate hike in the kingdom. Headline inflation remained unchanged in July at 2.6% YoY and against expectations of higher readings, while for the month, the CPI fell by 0.1%. The Producer Price index also proved weak, with output prices up by 0.1% against previous and expected 0.2%. While still above the central bank's 2.0% target, inflation easing from near 3.0% and the uncertainty surrounding the Brexit will likely keep the Pound subdued, regardless dollar's self-strength or weakness. Anyway, better-than-expected US sales and manufacturing data fueled the decline for the pair, leaving it at risk of falling further. Having shed over 100 pips for the day, the pair is now consolidating around 1.2870, with the 4 hours chart showing that the price is well below a now bearish 20 SMA, while the Momentum indicator consolidates within negative territory and the RSI indicator in oversold levels, with no signs of upward corrective movement ahead.
Support levels: 1.2830 1.2795 1.2760
Resistance levels: 1.2910 1.2950 1.2990
GOLD
Gold prices fell strongly for a second consecutive day, although recovered partially ahead of Wall Street's close, as dollar's momentum faded in the US afternoon. Risk aversion kept easing on Tuesday on cooling tensions between North Korea and the US, whilst strong US retail sales and manufacturing data underpinned the greenback. Spot gold settled at $1,274.06 a troy ounce after trading as low as 1,267.24. The daily chart shows that timid buying interest surged around a bullish 20 DMA, a few cents above the mentioned daily low, while technical indicators extended their slides within positive territory, now getting closer to their mid-lines. In the 4 hours chart and for the shorter term, the risk is towards the downside, as the 20 SMA is gaining downward strength well above the current level, whilst technical indicators barely bounced from near oversold readings. In this last time frame, the daily low converges with a modestly bullish 100 SMA making of the 1,267.00 area a major support for this Wednesday, as a break below it will likely result in a new leg lower.
Support levels: 1,267.00 1,260.90 1,251.90
Resistance levels: 1,276.15 1,285.50 1,295.60
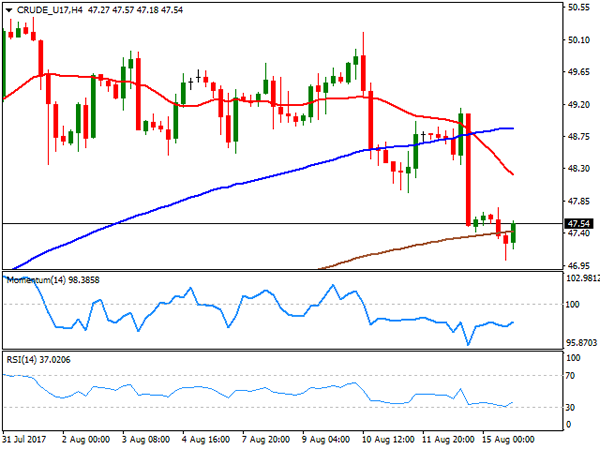
WTI CRUDE OIL
West Texas Intermediate crude futures closed the day unchanged around $47.50 a barrel, recovering in the US afternoon from an early slide to 47.02 a three-week low reached on concerns over growing supply from worldwide producers and slowed demand coming from China. US weekly crude oil stockpiles are expected to show another drawn for the week ended August 11th, with investors anticipating a 3.1 million barrels' decline. Easing dollar demand by the end of the day, helped the commodity bouncing, but the risk remains towards the downside, as in the daily chart, technical indicators maintain their bearish slopes within negative territory, while the price is hovering around a bearish 100 DMA. In the 4 hours chart, the price is stuck around the 200 SMA, and well below the 20 and 100 SMAs, with the shortest extending its slide below the largest, also favoring the downside. Technical indicators in this last time frame, have lost their bearish strength, but remain within negative territory and with limited upward strength, also in line with the ongoing downward momentum.
Support levels: 47.00 46.60 45.90
Resistance levels: 47.95 48.60 49.10
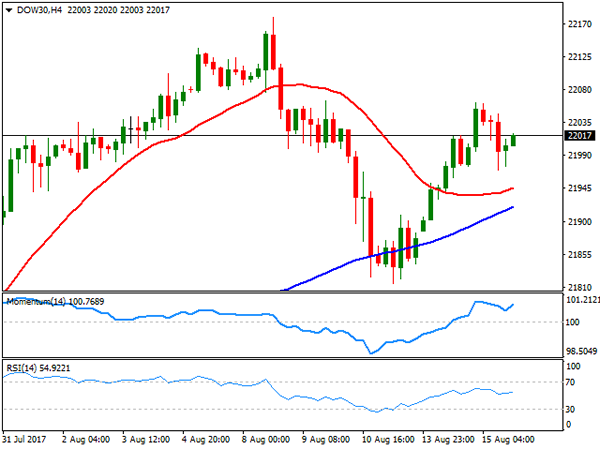
DJIA
US indexes hovered between gains and losses for most of this Tuesday, ending the mixed, but not far from their opening levels, on fading enthusiasm over easing risk aversion and investors needing fresh clues to take decisions, in the form of FOMC Minutes, to be unveiled this Wednesday. The Dow Jones Industrial Average ended the day at 21,998.99, up 5 points, whilst the Nasdaq Composite shed 7 points, to 6,333.01 and the S&P closed 0.05% lower at 2,464.61. Gainers outpaced losers within the Dow, with American Express leading advancers with a1.67% gain, followed by Apple that added 1.33%. Home Depot, on the other hand, was the worst performer, shedding 2.77%. From a technical point of view, the daily chart shows that the positive tone persists, as the index developed above a bullish 20 DMA, while technical indicators maintain modest upward slopes within positive territory, as the index posted a higher high and a higher low. For the shorter term, the 4 hours chart presents a bullish bias, as the 20 SMA gains upward strength below the current level, whilst technical indicators resumed their advances within positive territory after a modest downward correction, although standing below previous weekly highs.
Support levels: 21,970 21,931 21,892
Resistance levels: 22,062 22,096 22,137
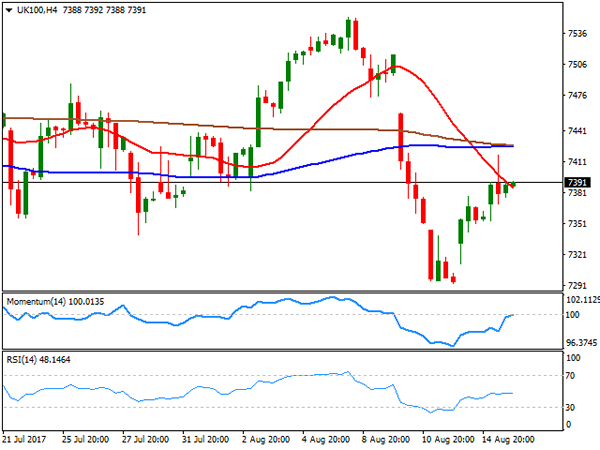
FTSE100
The FTSE 100 closed the day with modest gains at 7,383.85, up 30 points daily basis, as Pound's weakness offset a decline in mining-related equities. A weaker GDP usually boosts the index, as most of its listed companies make profits abroad. Travel-related shares led the way higher across the region, and in the UK, TUI was the best performer, adding 7.15%, followed y EasyJet that closed 4.51% higher. Provident Financial led decliners, down 3.78%, followed by Randgold Resources and Fresnillo, both down around 3.0%. Holding near the mentioned close, the daily chart shows that the Footsie settled a few points below its 20 and 100 SMAs, while technical indicators aim modestly higher, still within negative territory and with limited upward strength. In the 4 hours chart, a bearish 20 SMA continues attracting selling interest, now around the current level, while technical indicators lost upward strength within negative territory, indicating that further recoveries are unlikely at the time being.
Support levels: 7,343 7,312 7,281
Resistance levels: 7,415 7,440 7,477
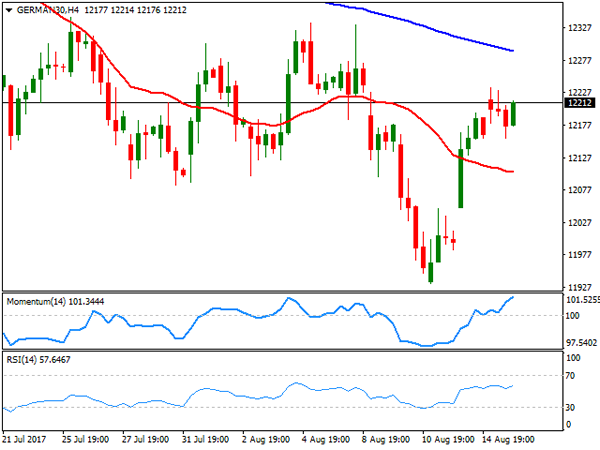
DAX
European equities ended the day with modest gains, with the German DAX adding 11 points to its Monday's rally to settle at 12,177.04. Within the benchmark, Lufthansa rose 4.92%, leading advancers, on reports that the company is in talks aimed at rescuing Air Berlin, followed by RWE AG which added 1.96%. ProSiebenSat.1 was the worst performer, down 0.94%, followed by Henkel AG that closed 0.89% lower. The index stands at 12,210 ahead of the Asian opening, with the daily chart showing that technical indicators extended their advances, but lost upward momentum within neutral territory, while the index is unable to settle above a bearish 20 DMA. In the 4 hours chart, the benchmark presents a more bullish-constructive stance, as it holds above its 20 SMA, whilst technical indicators keep heading north above their mid-lines. The weekly high is at 12,235, the level to surpass to see the index actually turning bullish this Wednesday.
Support levels: 12,178 12,131 12,095
Resistance levels: 12,235 12,272 12,316
Daily Technical Analysis: EURUSD, GBPUSD, USDJPY, USDCHF
EURUSD
The EURUSD had a bearish momentum yesterday bottomed at 1.1687 but closed a little bit higher at 1.1734. Price slipped below the trend line support as you can see on my daily chart below suggests a serious threat to the bullish outlook but as long as stay above 1.1650 I still prefer to buy on the dips with nearest target seen at 1.2000.The bias is bearish in nearest term. Immediate resistance is seen around 1.1770. A clear break above that area could lead price to neutral zone in nearest term testing 1.1850 area. On the downside, a clear break and daily close below 1.1650 would activate my neutral mode with a bearish short-term bias testing 1.1500 region.
GBPUSD
The GBPUSD continued its bearish momentum yesterday bottomed at 1.2846, touched the trend line support and daily EMA 200 as you can see on my daily chart below. The bias remains bearish in nearest term but buying at the trend line support is a good idea with a tight stop loss as a clear break and daily close below the trend line support would expose 1.2600 region. Immediate resistance is seen around 1.2888. A clear break above that area could lead price to neutral zone in nearest term testing 1.2950 or higher. Overall I remain neutral.
USDJPY
The USDJPY continued its bullish momentum yesterday topped at 110.84. The bias remains bullish in nearest term testing 111.00 – 111.50 area as a part of the bullish scenario after the appearance of the bullish pin bar as you can see on my daily chart below. Immediate support is seen around 110.35. A clear break below that area could lead price to neutral zone in nearest term testing 109.80 region. Overall I am neutral on this pair.
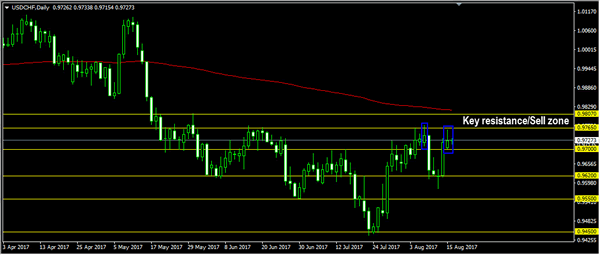
USDCHF
The USDCHF attempted to push higher yesterday topped at 0.9758 but closed a little bit lower at 0.9726. The bias is neutral in nearest term. Immediate support is seen around 0.9700. A clear break below that area could trigger further bearish pressure testing 0.9650/20 support area. On the upside, 0.9765 – 0.9807 remains a key resistance and a good place to sell with a tight stop loss as a clear break above that area would activate my bullish mode.
Safe Haven Currencies Gain Amid Rising Geopolitical Tensions
The safe haven currencies returned to favor this week as mounting tensions between the United States and North Korea saw investor's trim their risk appetite. The currencies gained despite some risks. For example, the Swiss franc which is also a sought after safe haven currency always comes the risk of the central bank intervention from the Swiss national bank.
Staying in line with his rhetoric, the US President Donald Trump said that he would hit North Korea with "fire and fury" amid facing falling approval ratings and widespread reshuffling of his cabinet. President Trump also said that he would hit North Korea with the likes that the world has never seen before.
The strong words from Trump saw an equally strong threat from North Korea which responded that it would hit the island of Guam in the Pacific. The back and forth rhetoric saw investors rushing to bonds and sending the yields lower, alongside a pick up in the safe haven currencies.
Gold, traditionally seen as a safe haven bet also posted strong gains. The precious metal rallied to a two and a half month high. Still, the precious metal remains broadly trading in a range for the past four months. Price action in gold suggests that the yellow metal is trading within the range of 1296 and 1212.
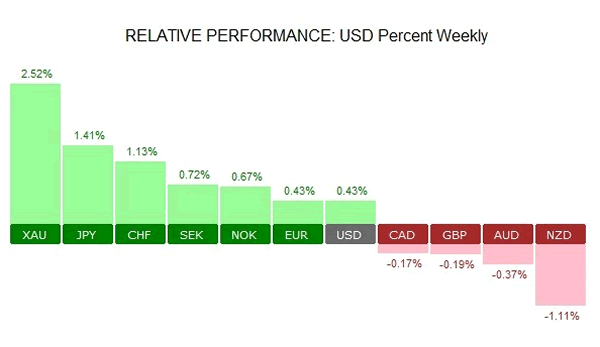
USD Weekly Performance: Week ending August 11, 2017
Investor concerns were also aptly reflected by the CBOE VIX index. Known as the fear index, the CBOE Volatility Index spiked to 15.51 by Friday's close.
US Consumer prices rise 0.1% in July
Consumer prices in the United States rose 0.1% in the month of July. The data was disappointing as economists forecast a 0.2% increase in consumer prices. On a year over year basis, consumer prices in the U.S. are up 1.7%. The core CPI, which excludes the volatile food and energy prices was seen rising 0.1% in July. This was also below the estimates of a 0.2% increase. Core inflation is also up 1.7% on the year.
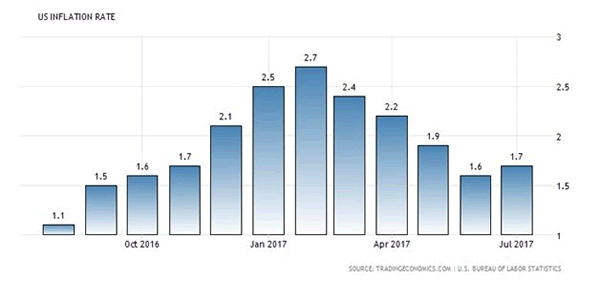
U.S. Inflation Rate YoY: 1.7% (July 2017). Source: Tradingeconomics.com
Food prices were seen rising 0.2% in July but energy prices fell 0.1%. The data showed that inflation continues to remain tame since February this year. It also puts to doubt whether the Fed will be able to continue with its rate hike plans amid slowing inflation.
The declines come as energy prices have fallen significantly after rising in 2016. In the six months ending January 2017, energy prices were seen rising 3.6% attributing to the increase in consumer prices as a result.
FOMC meeting minutes in focus
Looking ahead, the Federal Reserve will be releasing its meeting minutes from the August monetary policy meeting. The Fed did not change its language much but suggested that it would begin its balance sheet normalization relatively soon.
The markets are currently expecting the Fed to start unwinding its balance sheet as early as September. However, questions still remain on the prospects of further interest rate hikes for the remainder of this year.
The July jobs report managed to breathe some life into the interest rate expectations which managed to rise following a broadly better than expected increase in jobs as well as in wages. But with inflation data continuing to show a weak pace of increase, there is a strong chance that weaker inflation could potentially derail the Fed's plans for another rate hike this year.
It is therefore quite possible the markets will likely brush aside any hawkish statements from the meeting minutes due this Wednsday.