Sample Category Title
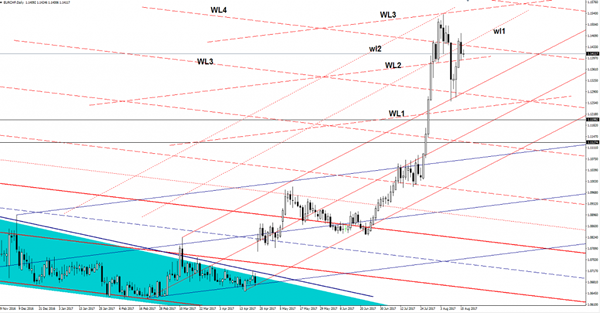
EUR/CHF Upside Uncertain
USD/CHF is struggling to hold ground as the yesterday’s drop invalidated a further upside movement. You can see that we had a false breakout above the first warning line (wl1) and above the fourth warning line (WL4). A failure to climb and stabilize above these levels will send it towards the upper media line (uml) again.
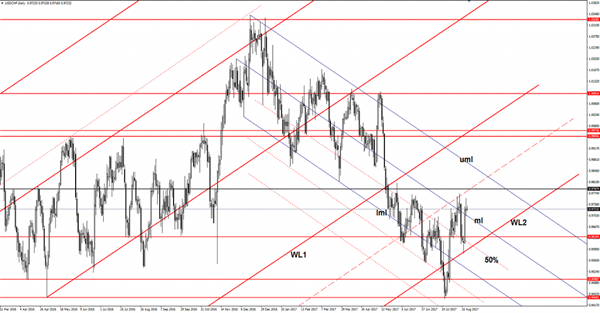
USD/CHF Upside Paused
Price has rallied since Monday, but has found temporary resistance again and now could come back to retest the broken median line (ml) of the minor descending pitchfork. Technically is somehow expected to climb much higher after the failure to close right on the second warning line (WL2) of the major ascending pitchfork.
The next upside targets will be at the 250% Fibonacci line (ascending dotted line) and higher at the 0.9787 static resistance, Could be attracted also by the upper median line (uml) of the minor descending pitchfork.
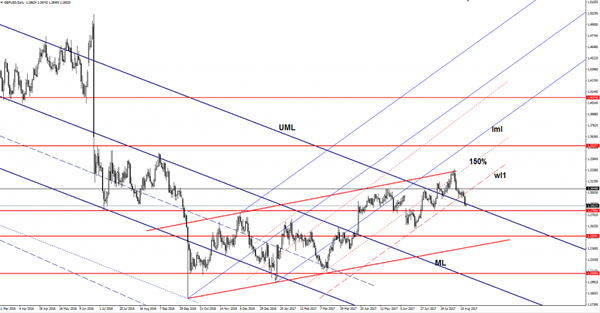
GBP/USD Melting Down
GBP/USD changed little today after the yesterday's massive drop, could extend the sell-off as the USDX should jump much higher. The USD is stronger again as the dollar index has managed to climb above the 93.81 static resistance and is expected to increase further in the upcoming period. USD received a helping hand from the United States data on Tuesday, we'll see how will react today after the FOMC Meeting Minutes.
USDX climbed much above the 94.00 psychological level, but failed to stay there, now is expected to pressure this level again. Technically, the index should increase as the behavior changed on the short term (has started to make higher lows).
The UK is to release the Average earnings Index later, which is expected to increase by 1.8% in June, matching the 1.8% growth in the former reading period. The Unemployment Rate is expected to remain steady at 4.5% for the second month in June, while the Claimant Count Change could be reported at 3.2K in July, much below the 5.9K in the previous reporting period.
You can see that is trading right below the upper median line (UML) of the major descending pitchfork, but remains to see if this will be a valid breakdown. A major drop will be confirmed only after a valid breakdown below the 1.2798 static support. You should know that a false breakdown will signal another leg higher after a retest of the UML and maybe the 1.2798 static support.
AUDUSD Shifts From Neutral To Bearish, Room For Further Weakness
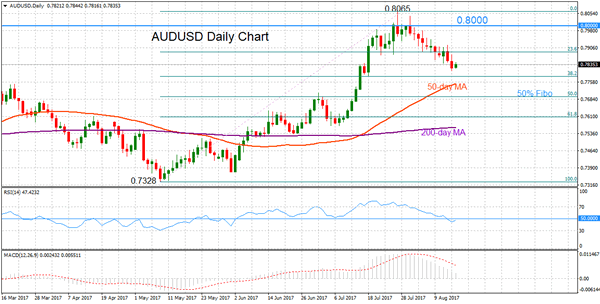
AUDUSD shifted from neutral to bearish after the market reached overbought levels. Prices were unable to sustain gains above the key 0.8000 psychological level and started to decline from the multi-year high of 0.8065.
Downward momentum picked up after RSI fell below 70 and MACD turned back down. There is room for weakness in AUDUSD to extend further and fall below the key 0.7800 level. The 38.2% Fibonacci retracement level of the rise from 0.7328 to 0.8065 is within reach at 0.7782 and is expected to provide support. From here, the 50% Fibonacci at 0.7695 is the next target. Below this, AUDUSD would come under more pressure to drop to 0.7607 (61.8% Fibonacci) and at this point there is scope to slip towards the 200-day moving average. A break below it would act as a catalyst for deeper declines towards the May 9 low of 0.7328 and beyond.
On the upside, resistance is at 0.7887 (23.6% Fibonacci) and the key psychological level at 0.8000. A break back above the 0.8065 peak would indicate that the current bearish phase was a correction of the recent rise from 0.7328 and there would be a resumption of the uptrend.
For now the risk is to the downside, keeping the short-term bearish while the overall technical landscape remains bullish. The price is above the 50-day and the 200-day moving averages and there was a bullish crossover on July 14.
Markets Welcome Risk-On Sentiment
With tensions abating between the US and North Korea USD bulls returned. A North Korean media report indicated that dictator Kim Jong Un had decided not to launch a threatened missile attack on Guam. In addition, South Korean President Moon Jae-in vowed to avoid a conflict at any cost. With a move away from safe havens both Gold and JPY suffered losses on the day. USD also appreciated against GBP, pushing GBPUSD to a 5-week low, after UK inflation held steady in July and raised questions as to whether the Bank of England will be able to raise rates again this year. German GDP, whilst growing, was below forecast, especially for (YoY) Q2 of 0.8% against the forecast 1.9%, that resulted in EUR selling. US data showed Retail sales improving in July, the strongest showing for 7 months, which will help the FOMC tighten monetary policy and give them the option to raise rates once more in 2017. Markets will be focusing on the latest minutes from the last FOMC meeting that are to be released later today.
EURUSD fell to its lowest level in 3 weeks at 1.16868 before rebounding in late trading. EURUSD is currently trading around 1.17×25
USDJPY improved over 1% on the day to reach a high of 110.845, its highest for 3 weeks. Currently USDJPY is trading around 110.75
GBPUSD lost 1% on Tuesday touching a low of 1.28458 a level last seen back in June. Currently GBPUSD is trading around 1.2855
Gold declined nearly 1% on Tuesday to reach a low of $1,267.25. Currently Gold is trading around $1,272
WTI reached a low not seen for 3 weeks of $47.14pb. Currently WTI is trading around $47.90pb
At 10:00 BST Eurostat will release Eurozone Gross Domestic Product (QoQ) & (YoY) for Q2. Forecasts call for an unchanged number of 0.6% & 2.1% respectively. GDP has been consistently rising, albeit very slowly, since 2014. Markets are expecting this trend to continue and will be EUR averse if the release is below expectations.
At 15:30 BST the US EIA Crude Oil stockpiles report for the week ending August 11th will be released. Another drawdown of -3.176M is expected which is a reduction in the previous larger drawdown of -6.451M. As always, whatever the release the markets always expect this release to have a significant impact on Oil prices.
Closing out the day at 19:00 BST will be the FOMC Minutes release. Markets will be dissecting the release for any indications to changes in monetary policy and the resulting tone that will signal the likelihood of further interest rate hikes.
Dollar Continues Gaining Against Yen After Yesterday’s Surge On Upbeat Retail Sales
The US dollar continued gaining during the Asian session following yesterday's spike versus the yen on upbeat retail sales. Sterling was also down against the greenback during morning trading, while other majors including the euro, aussie, kiwi and the Canadian dollar managed to recoup some of the losses against the US currency. The dollar index was broadly flat at 93.84.
In terms of economic data, today's first session of the day was relatively quiet. The wage price index for the second quarter out of Australia, which came in as expected at 0.5% q/q, was the only release. During the European session, the average earnings index out of the UK will be one of the key releases at 8:30 GMT. That will be followed by the preliminary second-quarter GDP figure for the eurozone at 9:00 GMT. During the US session, housing data and crude oil inventories will dominate the news flow.
Looking at the forex reactions, the dollar continued gaining for the third consecutive day against the yen to last trade at 110.77 yen ahead of the European session. US retail sales rose 0.6% m/m in July, their biggest increase this year on a pickup in sales of motor vehicles and increased discretionary spending. Not only did the report beat economists' expectations of 0.4%, but also showed an upward revision for the gains in the prior two months. This has provided optimism about growth in the third quarter in the US and lifted the probability of a rate hike by the Federal Reserve this year in December. Following the release, the dollar index rose to near a three-week high.
On the geopolitical front, the situation has calmed as North Korean president Kim Jong Un opted not to fire missiles at the US territory of Guam, as reported by state media.
The euro managed to recoup some of yesterday's heavy losses against the dollar when it tumbled on disappointing German GDP numbers and strong US retail sales. The preliminary figures released yesterday showed that Germany's economy expanded 0.8% annually, faring much worse than the expected 1.9% gain and below the upwardly revised prior figure of 3.2%. The disappointed was less on the quarterly expansion as the figures came in at 0.6% versus the 0.7% forecasted gain. Following the release of the GDP figures, the euro fell to $1.1735 and further plunged to $1.1687 after the US retail sales figures. During the Asian session, the euro was last trading at $1.1731.
Sterling slid against the dollar to an intra-day low of $1.2845 during yesterday's session on news that inflation cooled in July, dashing hopes of an interest rate hike. Annually, the consumer price index expanded 2.6%, below the expected gain of 2.7% and in line with the prior figure of 2.6%. On the monthly basis, inflation declined by 0.1%. The pound managed to recover modestly during the Asian session, but is still down on the day and was last trading at $1.2865.
Looking at gold, the precious metal weakened in the wake of the dollar strength and was last trading at $1,269.61 an ounce.
Oil prices firmed up on hopes for a big drop in US inventories that will be released later in the US session. WTI was last trading at $47.79 a barrel while Brent was at $51.11.
One Set Of Data Not Enough To Boost Bullish Dollar Bets
Developments in the last 48 hours have finally given dollar bulls much-needed motivation to send the greenback higher. It started on Monday, with upbeat comments from New York Fed President Bill Dudley, who opposed his colleagues' beliefs – by saying that he would favor a third rate increase this year. The crisis between the U.S. and North Korea has also appeared to ease, as both sides sought to lower tensions. Moreover, U.S. retails sales bolstered the third quarter growth outlook, recording their biggest gain in seven months, as consumers boosted spending. However, the magnitude of the dollar's move was limited, and the dollar index is only up 1.3% from 2017 lows, and still down 8.4% for the year.
Despite the robust retail sales figures and the hawkish tone from Bill Dudley, expectations for a rate hike in December is still below 50%, according to CME's FedWatch tool; indicating that one set of data is not enough to reverse interest rate expectations. Another factor that's likely to keep dollar bulls on the sidelines, is skepticism on the political front. When President Trump first took office, he announced the creation of the Manufacturing Jobs Initiative, where a group of the largest business leaders' firms joined to advise him. Seven of them have resigned already, with the latest being AF-CIO Richard Trumka and Deputy Chief of Staff Thea Lee, following the president's inadequate response to an attack at a white nationalist rally in Charlottesville, over the weekend. Unless we get some political stability in the U.S., any rally in the dollar is likely to be limited.
Today's Fed minutes may offer clues on the start of shrinking the $4.5 trillion asset portfolio. This should gradually send the longer end of the yield curve higher, but given that the news is already priced in, the impact on the dollar will be limited. I think the outlook on inflation will be the key thing to watch. Given the recent weakness in the Consumer Price Index and Personal Consumption Expenditure, markets need to know whether the Fed views the slow down as transitory or cyclical, and whether it is something to be concerned about. The dollar will take its direction based on how hawkish or dovish the Fed is on the inflation front.
Sterling was one of the worst performing currencies on Tuesday, falling 0.7% against the dollar. The dip came despite the U.K. government publishing a paper, outlining Britain's desire to negotiate a transitional customs union arrangement, to take effect after U.K. leaves the E.U. Although this is considered a positive development and suggests that policy makers are seeking a soft Brexit, traders were still uninterested. Politics within the U.K. seems to have taken a back seat for now, and unless we see a positive response from Brussels, the pound will not respond. Weaker than expected inflation also added to the pressure, with July CPI remaining stuck at 2.6%, this suggests that the BoE will remain on hold throughout this year. The focus today will shift to U.K employment data, and unless we see improvement in wages, sterling will likely remain under some pressure.
NZD/USD Candlesticks and Ichimoku Analysis
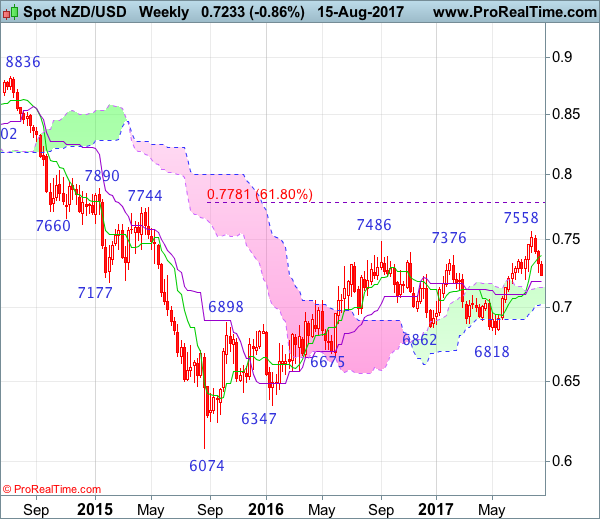
Weekly
• Last Candlesticks pattern: N/A
• Time of formation: N/A
• Trend bias: Up
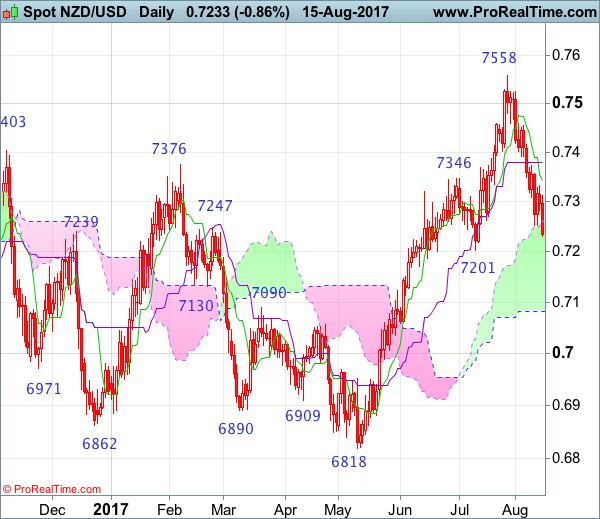
Daily
• Last Candlesticks pattern: Long black candlestick
• Time of formation: 1 Aug 2017
• Trend bias: Up
NZD/USD – 0.7237
Kiwi’s stronger-than-expected retreat from 0.7558 signals a temporary top has been formed there, hence consolidation below this level would be seen with downside bias for retracement of recent upmove, hence further weakness to 0.7201 support is likely, however, a daily close below this level is needed to add credence to this view, bring subsequent fall to 0.7145-50, then towards the lower Kumo (now at 0.7082) which is likely to hold from here due to near term oversold condition and bring rebound later.
On the upside, whilst initial recovery to 0.7300 cannot be ruled out, reckon upside would be limited to the Tenkan-Sen (now at 0.7345) and the Kijun-Sen (now at 0.7380) would hold, bring another decline later. Above 0.7390-00 would suggest first leg of decline form 0.7558 has ended instead, risk a stronger rebound to 0.7440-50 but upside would still be limited and price should falter well below said resistance at 0.7558, bring another retreat later this month.
Recommendation: Sell at 0.7370 for 0.7170 with stop below 0.7470.
On the weekly chart, as kiwi’s retreat from 0.7558 has kept price under near term pressure and 3 consecutive black candlesticks look set to be formed, suggesting top has possibly been formed at 0.7558, hence downside risk remains for retracement of recent upmove and a break below the Kijun-Sen (now at 0.7188) would add credence to this view, bring further fall to the upper Kumo (now at 0.7147) and then 0.7090-00 but reckon downside would be limited to the lower Kumo (now at 0.7026) and psychological support at 0.7000 would hold from here.
On the upside, expect recovery to be limited to 0.7300-10 and the Tenkan-Sen (now at 0.7379) should hold, bring another decline later. Above 0.7417 (last week’s high) would risk a stronger rebound to 0.7490-00 but still reckon said resistance at 0.7558 would limit upside and bring another retreat later. Only a break of 0.7559 would extend medium term erratic upmove from 0.6074 (2015 low) has resumed and may extend gain to 0.7690-00 (61.8% projection of 0.6074-0.7485 measuring from 0.6818) and later towards 0.7780-85 (61.8% Fibonacci retracement of 0.8836-0.6074), however, reckon upside would be limited to 0.7890 and price should falter well below resistance at 0.8035.
AUD/USD Candlesticks and Ichimoku Analysis
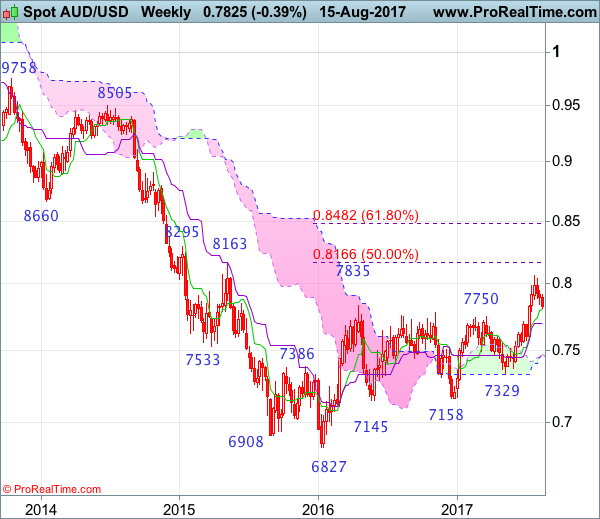
Weekly
• Last Candlesticks pattern: Long white candlestick
• Time of formation: 10 Jul 2017
• Trend bias: Up
Daily
• Last Candlesticks pattern: Long white candlestick
• Time of formation: 18 Jul 2017
• Trend bias: Up
As aussie has remained under pressure after meeting renewed selling interest around the Tenkan-Sen, suggesting near term downside risk remains for the retreat from 0.8066 temporary top to bring retracement of recent upmove, hence weakness to 0.7760 (61.8% Fibonacci retracement of 0.7571-0.8066) cannot be ruled out, however, reckon downside would be limited to previous resistance at 0.7712 and 0.7670-75 would hold from here, bring another rebound later this month.
On the upside, whilst recovery to 0.7855-60 is likely, reckon upside would be limited to 0.7900 and bring another decline. Only a daily close above 0.7925-30 would suggest low is formed, bring test of resistance at 0.7980 but a sustained breach above 0.8000 is needed to signal the pullback from 0.8066 has ended, bring retest of this level later. Looking ahead, a break above 0.8066 would confirm upmove has resumed and extend the medium term erratic rise from 0.6827 to 0.8163 resistance, then 0.8200, however, loss of near term upward momentum should limit upside and reckon another previous resistance at 0.8295 would hold.
Recommendation: Stand aside for now.

On the weekly chart, as aussie has continued trading lower after retreating from 0.8066, suggesting near term downside risk remains for retracement of recent upmove, a weekly close below the Tenkan-Sen (now at 0.7800) would bring correction to 0.7750, however, a sustained breach below previous resistance at 0.7712 is needed to signal a temporary top has been formed, bring test of the Kijun-Sen (now at 0.7698), then towards 0.7600-10 but support at 0.7571 should contain weakness.
On the upside, expect recovery to be limited 0.7855-60 and 0.7925-30 should hold, bring another retreat. Above 0.7980 resistance would revive near term bullishness and suggest the pullback from 0.8066 has ended, bring retest of this level, break there would extend recent upmove from 0.6827 low to previous resistance at 0.8163, then 0.8250, however, near term overbought condition should limit upside to another previous resistance at 0.8295 and price should falter below 0.8390-00, bring retreat later.
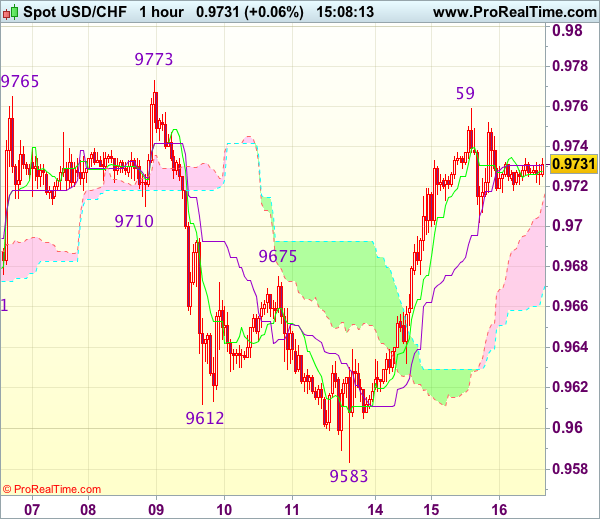
Trade Idea : USD/CHF – Buy at 0.9690
USD/CHF - 0.9728
Most recent candlesticks pattern : N/A
Trend : Near term up
Tenkan-Sen level : 0.9729
Kijun-Sen level : 0.9631
Ichimoku cloud top : 0.9711
Ichimoku cloud bottom : 0.9667
Original strategy :
Buy at 0.9695, Target: 0.9795, Stop: 0.9660
Position : -
Target : -
Stop : -
New strategy :
Buy at 0.9690, Target: 0.9790, Stop: 0.9655
Position : -
Target : -
Stop : -
As the greenback has maintained a firm undertone after staging a strong rebound from 0.9583 (last week’s low), adding credence to our view that the retreat from 0.9773 has ended there, hence consolidation with upside bias remains for another test of said resistance, however, break there is needed to confirm early rise from 0.9438 low has resumed and extend gain to 0.9808 and possibly 0.9825 resistance, having said that, near term overbought condition should limit upside and price should falter below previous support at 0.9859.
In view of this, we are looking to reinstate long on pullback as 0.9690-95 should limit downside and bring another rise later. Below previous resistance at 0.9675 would defer and risk weakness towards 0.9640 but downside should be limited to 0.9615-20 and bring another rise later.