Sample Category Title
Trade Idea : GBP/USD – Sell at 1.2920
GBP/USD - 1.2871
Most recent candlesticks pattern : N/A
Trend : Near term down
Tenkan-Sen level : 1.2863
Kijun-Sen level : 1.2907
Ichimoku cloud top : 1.2986
Ichimoku cloud bottom : 1.2974
Original strategy :
Sell at 1.2920, Target: 1.2820, Stop: 1.2955
Position : -
Target : -
Stop : -
New strategy :
Sell at 1.2920, Target: 1.2820, Stop: 1.2955
Position : -
Target : -
Stop : -
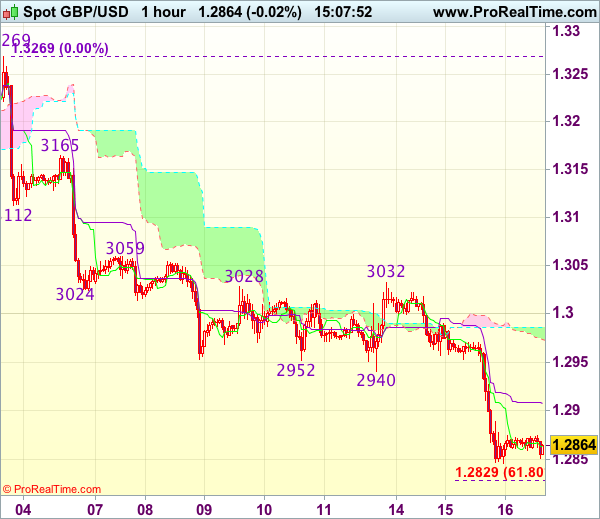
As cable has remained under pressure after breaking below support at 1.2933-40, adding credence to our bearish view that the decline from 1.3269 top is still in progress for retracement of early upmove, hence downside bias remains for further weakness to 1.2825-30 (61.8% projection of 1.3269-1.2940 measuring from 1.3032), having said that, near term oversold condition should limit downside to 1.2800 and reckon 1.2770 would hold from here, bring rebound later.
In view of this, would not chase this fall here and would be prudent to sell sterling on recovery as said previous support at 1.2933 should turn into resistance and cap cable’s upside, bring another decline. Above 1.2950 would defer and risk a stronger rebound to 1.2990-00 before another decline.
Trade Idea : EUR/USD – Sell at 1.1755
EUR/USD - 1.1733
Most recent candlesticks pattern : N/A
Trend : Sideways
Tenkan-Sen level : 1.1736
Kijun-Sen level : 1.1728
Ichimoku cloud top : 1.1798
Ichimoku cloud bottom : 1.1788
Original strategy :
Sell at 1.1755, Target: 1.1655, Stop: 1.1790
Position : -
Target : -
Stop : -
New strategy :
Sell at 1.1755, Target: 1.1655, Stop: 1.1790
Position : -
Target : -
Stop : -
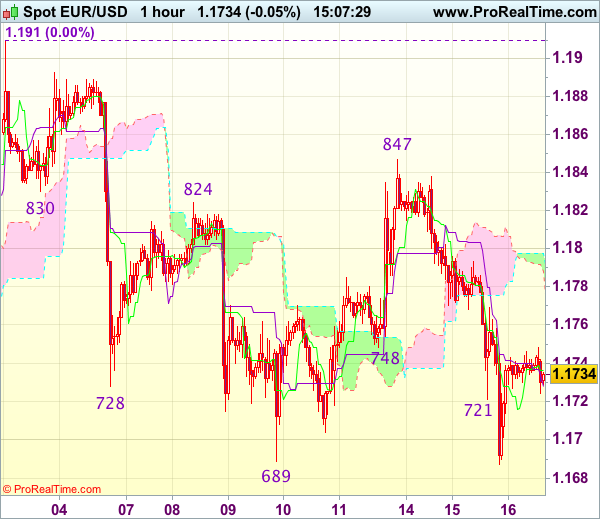
Euro’s selloff after meeting renewed selling interest at 1.1847 signals the erratic fall from 1.1910 top is still in progress and mild downside bias remains for further weakness to 1.1640-50 (50% Fibonacci retracement of 1.1370-1.1910 and previous support), below there would encourage for subsequent decline towards 1.1600-10 which is likely to hold from here due to near term oversold condition.
In view of this, we are looking to sell euro on recovery as 1.1755-60 should limit upside and bring another decline later. Above 1.1790-95 would abort and risk a stronger rebound to 1.1820 but price should falter below said resistance at 1.1847.
Trade Idea : USD/JPY – Buy at 110.20
USD/JPY - 110.86
Most recent candlesticks pattern : N/A
Trend : Near term up
Tenkan-Sen level : 110.71
Kijun-Sen level : 110.58
Ichimoku cloud top : 109.98
Ichimoku cloud bottom : 109.59
Original strategy :
Buy at 110.15, Target: 111.15, Stop: 109.80
Position : -
Target : -
Stop : -
New strategy :
Buy at 110.20, Target: 111.20, Stop: 109.85
Position : -
Target : -
Stop : -
As the greenback has risen again after brief pullback, adding credence to our bullish view that the rebound from 108.73 low is still in progress, hence gain to previous resistance at 111.05 cannot be ruled out, however, break there is needed to retain bullishness and extend this rise for a stronger correction of early decline to 111.25-30, having said that, near term overbought condition should prevent sharp move beyond previous resistance at 111.71, risk from there is seen for a retreat later.
In view of this, would not chase this rise here and would be prudent to buy dollar on pullback as 110.15-20 should limit downside. Only below previous resistance at 109.80 would abort and signal top is formed instead, bring weakness towards support at 109.42.

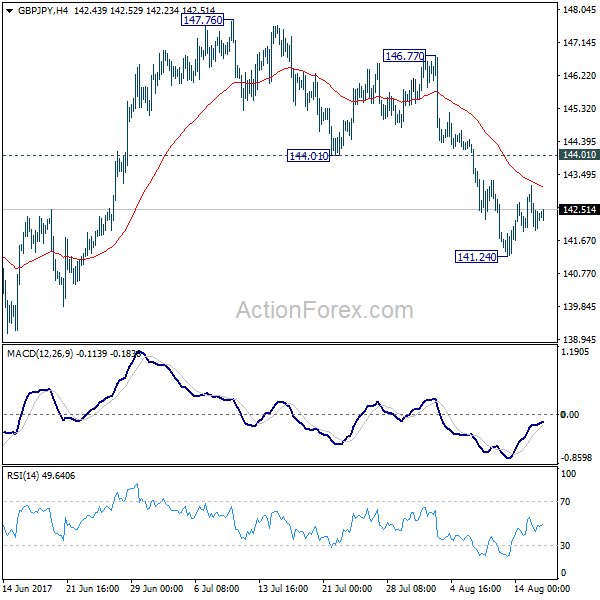
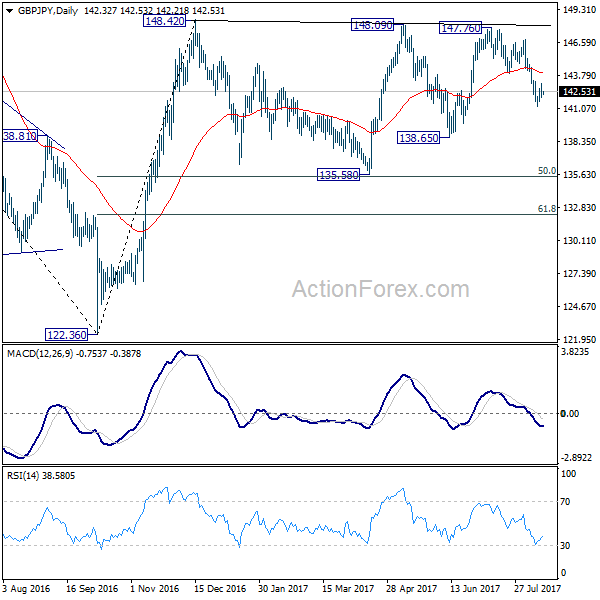
GBP/JPY Daily Outlook
Daily Pivots: (S1) 141.84; (P) 142.52; (R1) 143.07; More
Intraday bias in GBP/JPY remains neutral for the moment. With 144.01 support turned resistance intact, near term outlook stays mildly bearish for deeper decline. Break of 141.24 will extend the fall from 147.76 to 138.65 support and below. As GBP/JPY is seen as staying in consolidation pattern from 148.42, we'd expect strong support from 135.58 to contain downside. On the upside, break of 144.01 will indicate completion of the decline from 147.76 and turn bias back to the upside.
In the bigger picture, the sideway pattern from 148.42 is extending with another leg. But we'd expect strong support from 135.58 and 50% retracement of 122.36 to 148.42 at 135.39 to contain downside. Medium term rise from 122.36 is still expected to resume later. And break of 38.2% retracement of 196.85 to 122.36 at 150.43 will carry long term bullish implications. However, firm break of 135.58/39 will dampen the bullish view and turn focus back to 122.36 low.
The Minutes From The FOMC Meeting In July Are Due For Release In The US
Market movers today
In the UK, the key release today is the labour market report for June. Average weekly earnings growth has decreased in recent months and the subdued wage growth highlights the lack of underlying inflation pressure, diminishing the likelihood of a rate hike by the Bank of England for the remainder of 2017. We expect the unemployment rate to stay unchanged.
In the euro area, focus is on the first release of Italian Q2 GDP figures, where we expect growth of 0.4% q/q in line with positive signals from leading indicators such as PMI. Although we project the modest economic recovery in Italy to continue, with annual GDP growth of 1.4% this year, risks are still looming in the background for the country.
The minutes from the FOMC meeting in July are due for release in the US. Focus will remain on the discussions of the timing of quantitative tightening (we still expect tightening to be announced in September) and any comments on how concerned the Fed is about the low inflation which it now describes as ‘below 2%' (previously ‘somewhat below 2%').
Today the UK government will publish a position paper on possible solutions to the issue of the border between Northern Ireland and the Republic of Ireland fol lowing Brexit.
Selected market news
Risk-on sentiment continued yesterday and the 10Y German bund yield rose another 2.5bp and the yield curve steepened further. The move in the 10Y German yield was almost mirrored in periphery yields, hence the spreads stayed broadly stable yesterday. While a more sustained sell-off does not seem to be looming near-term, this week's risk-on sentiment has retraced most of last week's gains.
EUR/USD slid further but in our view this is a consolidation phase with the cross taking a breather before the next move higher. In the short -term, the upside in the cross is likely capped with stretched positioning long EUR/USD and a US economy regaining strength as reflected in the US retail sales figures released yesterday. The stronger US data could point to a continued fall in EUR/USD but in our view the underlying forces for higher levels should dominate. Instead, the USD is likely to continue strengthening versus the JPY.
Swedish inflation in July surprised on the upside and solidly breached the 2% line. The acceleration was mainly due to package holidays which showed an all-time high yearly rate of 30.3%. This extreme development seems to come from a combination of a new calculation method, strong demand for holidays abroad and possibly some lagged krona effects. The Riksbank minutes from July mentioned package holidays' contribution to inflation and argued that the high inflation outcome may support inflation expectations and hence a loosening of monetary policy but it still concluded ‘underlying inflationary pressures in the medium term have probably still not risen'. We expect the governing board to stick to that interpretation for now. Note that the SEK is already trading 2.5% stronger than the Riksbank forecast.
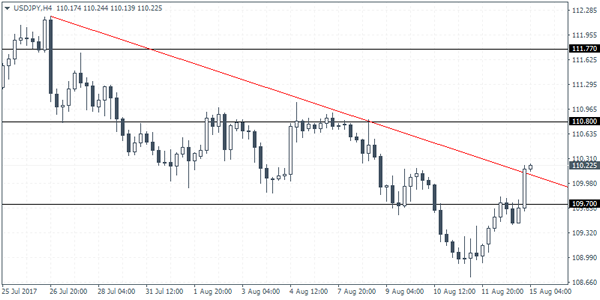
USDJPY Intraday Analysis
USDJPY (110.22): The USDJPY managed to post strong gains for a second consecutive day. Price action briefly rallied to a 6-day high at 110.85 yesterday before slightly easing back below the resistance level of 110.80. On the 4-hour chart, the trend line break has signaled a strong move to the upside. However, lack of a retest of the breakout levels suggests some downside risk. A retest to 110.17 is, therefore, quite likely. However, if we get to see a reversal here, USDJPY could be seen pushing higher.
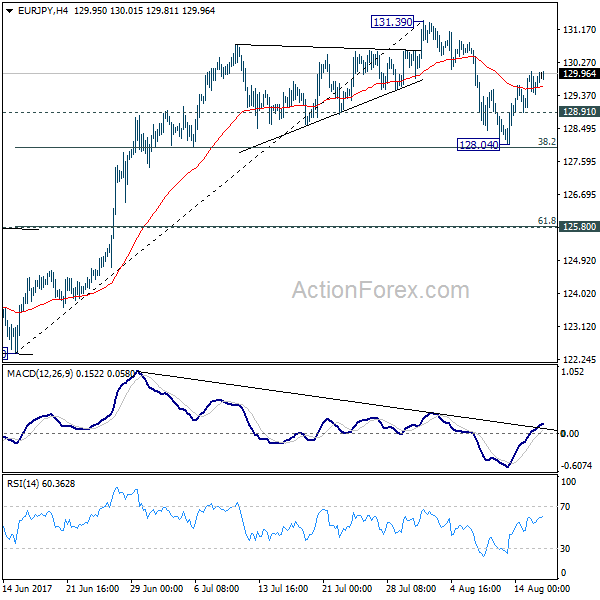
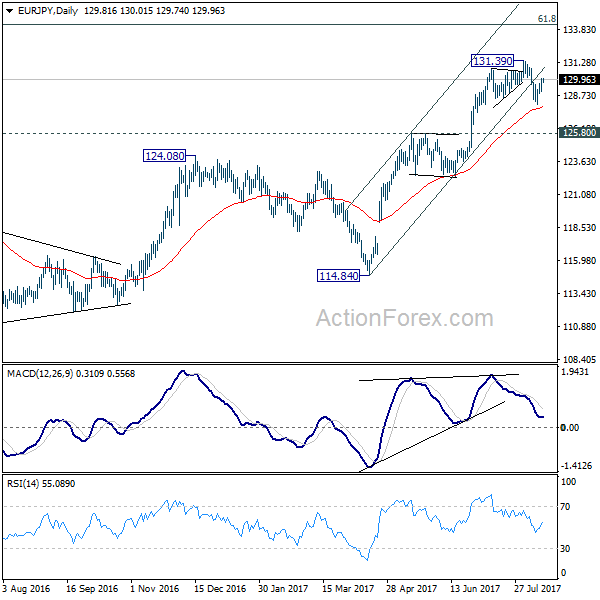
EUR/JPY Daily Outlook
Daily Pivots: (S1) 129.27; (P) 129.65; (R1) 130.24; More...
Intraday bias in EUR/JPY remains mildly on the upside for the moment. Rebound from 128.04 would target a test on 131.39 high. Break there is needed to confirm up trend resumption. Otherwise, we'd likely see more consolidation first. On the downside, below 128.91 minor support will turn bias to the downside for another fall. At this point, we'd still expect strong support from 38.2% retracement of 122.39 to 131.39 at 127.95 to bring rebound. But sustained break of 127.95 will bring deeper decline to 125.80 cluster support (61.8% retracement at 125.82) before completing the correction.
In the bigger picture, the down trend from 149.76 (2014 high) is completed at 109.03 (2016 low). Current rally from 109.03 should be at the same degree as the fall from 149.76 to 109.03. Further rise is expected to 61.8% retracement of 149.76 to 109.03 at 134.20. Sustained break there will pave the way to key long term resistance zone at 141.04/149.76. Medium term outlook will remain bullish as long as 124.08 resistance turned support holds.
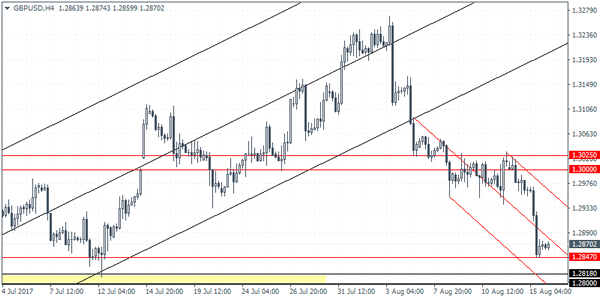
GBPUSD Intraday Analysis
GBPUSD (1.2870): The British pound extended declines to 1.2847 yesterday. This marks a support level that was previously tested around early July. A rebound off this level could suggest a near-term retracement, potential back towards 1.3025. This would mark the formation of the short-term head and shoulders pattern. A reversal off 1.3025 could suggest further declines down to 1.2626, which marks the measured move as well as coinciding with the former support.
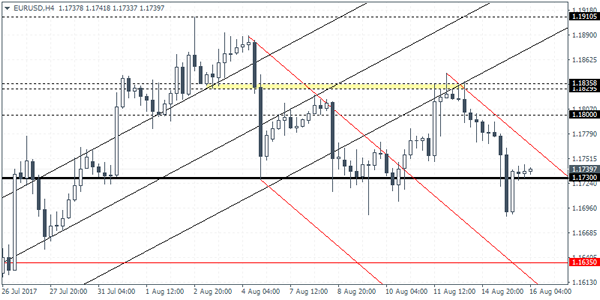
EURUSD Intraday Analysis
EURUSD (1.1739): The EURUSD posted declines for a second day. Price action broke to the downside from the inside bar that was formed on Monday. This potentially suggests some downside in prices. However, on the 4-hour chart, after a brief break down below the main support at 1.1730, EURUSD managed to recover back above this level. We could expect to see some consolidation taking place in the near term with the potential for the currency pair to rebound back to 1.1800. Only a confirmed close below 1.1730 will signal further declines towards 1.1635.
EUR/GBP Daily Outlook
Daily Pivots: (S1) 0.9068; (P) 0.9100; (R1) 0.9150; More
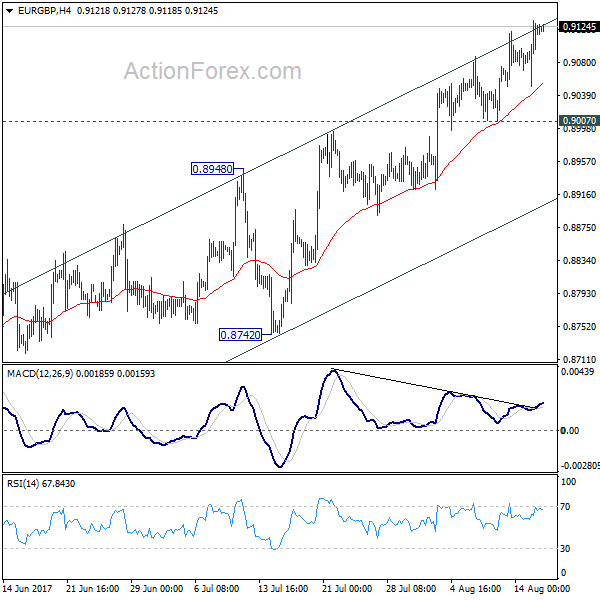
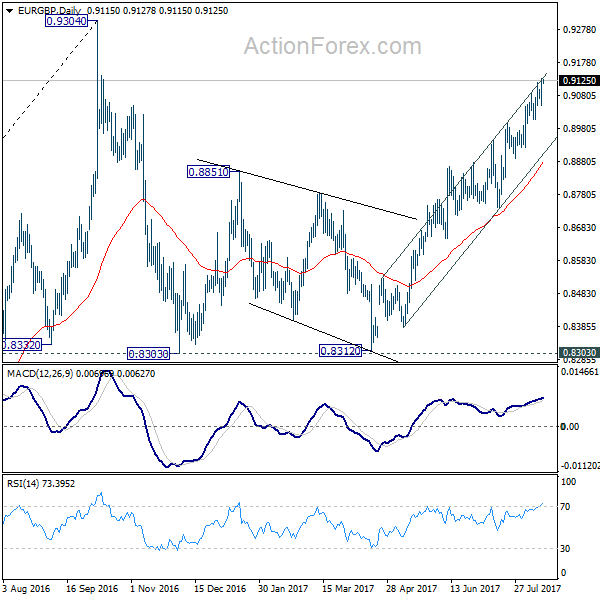
No change in EUR/GBP's outlook. Further rise is expected with 0.9007 support intact. Current rise from 0.8312 should target a test on 0.9304 high. At this point, there is no clear sign of up trend resumption yet. Hence, we'll be cautious on strong resistance from 0.9304 to limit upside and bring another fall. On the downside, considering bearish divergence condition in 4 hour MACD, break of 0.9007 support will indicate short term topping. Intraday bias will then be turned back to the downside for 0.8742/8948 support zone.
In the bigger picture, price actions from 0.9304 are viewed as a medium term corrective pattern. It's uncertain whether it is finished yet. But in case of another fall, we'd expect strong support from 0.8116 cluster support (50% retracement of 0.6935 to 0.9304 at 0.8120) to contain downside and bring rebound. Whole up trend from 0.6935 is expected to resume after consolidation from 0.9304 completes.