Sample Category Title
GBP/USD Analysis: At Three-Week Low
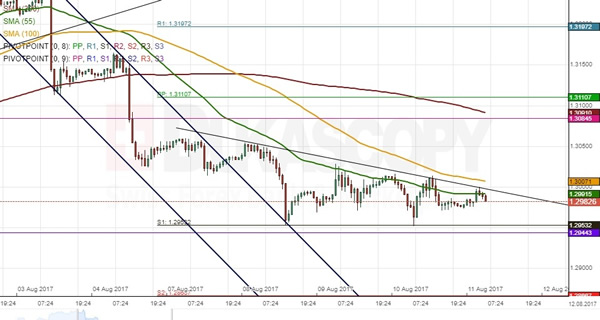
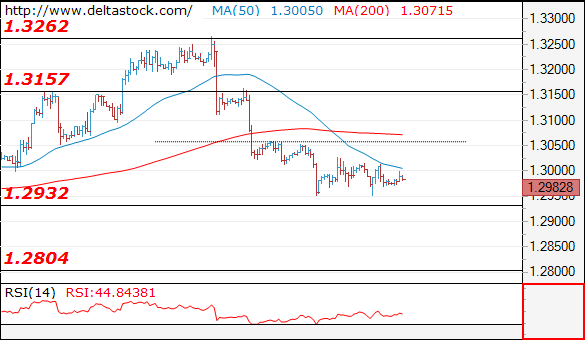
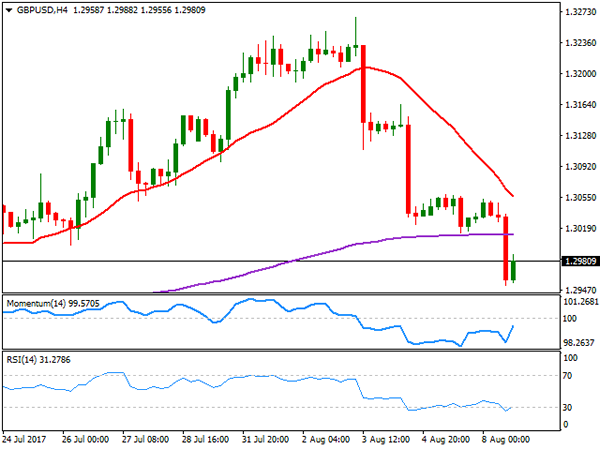
GBP/USD remained between the weekly S1 and the 100-hour SMA on Thursday, thus providing two additional confirmations of a descending triangle. The exchange rate managed to bounce off the short-term down-trend this morning; however, the lack of volatility demonstrates trader indecisiveness towards the pair. As the rate has entered a consolidation phase, it is rather unclear to which direction the Pound is set to go. Bearish technical indicators are signalling to a possible recovery that may lead the Sterling towards the 1.3020/40 area. Alternatively, the aforementioned triangle may be respected, thus setting the British currency down to the weekly S1 at 1.2953. Given the characteristics of this pattern, the weekly and monthly S1s should be breached to the downside.
EURUSD Analysis: Reveals Junior Pattern
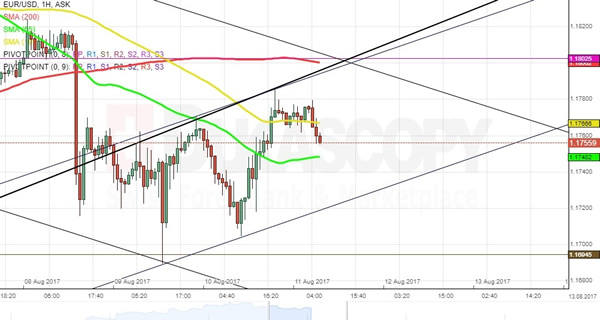
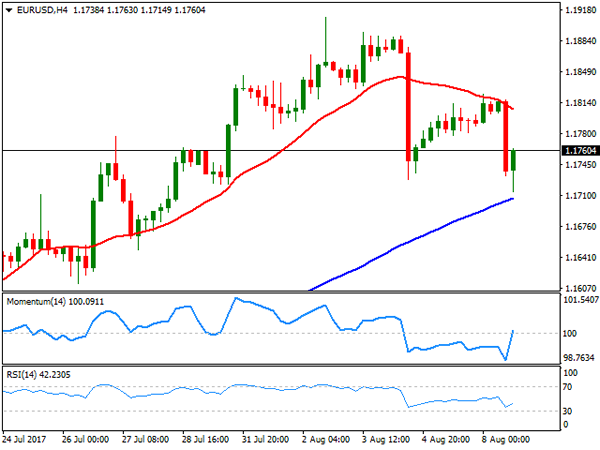
The previous long term support line continued to provide resistance to the currency exchange rate in the previous trading session, as it stopped a rebound of the EUR/USD pair.
On Friday morning the currency pair was declining after the encounter of the just mentioned resistance line. It was about to face the support of the 55-hour SMA, which as located near the 1.1750 mark.
Meanwhile, the main focus should be on the fact that an ascending channel pattern was revealed during Thursday's trading session. The pattern's lower trend line provides guidance for the ones, who want to know, where a rebound will occur.
Forex Technical Analysis: EUR/USD, USD/JPY, GBP/USD
EUR/USD
Current level - 1.1763
Yesterday's rise to 1.1784 should be considered the final leg of the consolidation pattern above 1.1687 and my outlook is bearish, for a sell-off towards 1.1580 area.
| Resistance | Support | ||
| intraday | intraweek | intraday | intraweek |
| 1.1780 | 1.1909 | 1.1700 | 1.1580 |
| 1.1825 | 1.2000 | 1.1580 | 1.1480 |
USD/JPY
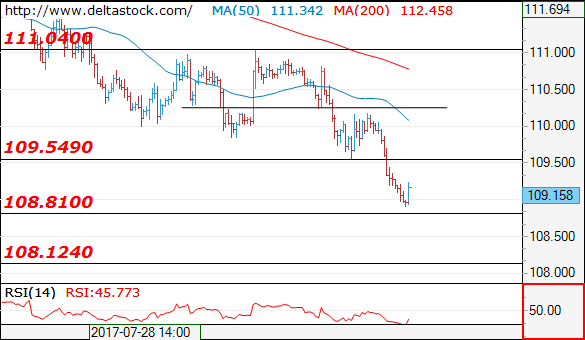
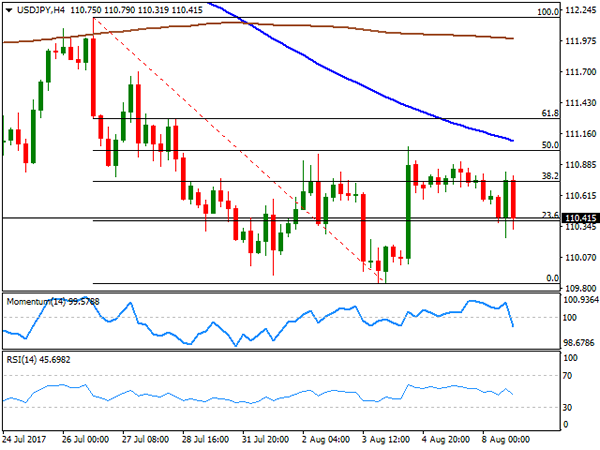
Current level - 109.15
Allow a brief intraday consolidation below 109.50, before another slide towards 108.10 zone.
| Resistance | Support | ||
| intraday | intraweek | intraday | intraweek |
| 109.50 | 112.20 | 108.80 | 108.10 |
| 110.30 | 114.50 | 108.10 | 107.00 |
GBP/USD
Current level - 1.2982
The consolidation pattern above 1.2930 is still underway, but my outlook remains bearish, for a break on the downside, towards 1.2810 zone. Key resistance lies at 1.3050.
| Resistance | Support | ||
| intraday | intraweek | intraday | intraweek |
| 1.3050 | 1.3260 | 1.2930 | 1.2930 |
| 1.3100 | 1.3500 | 1.2810 | 1.2810 |
Foreign Exchange Market Commentary: EUR/USD, USD/JPY, GBP/USD, GOLD, WTI CRUDE, DJIA, FTSE100, DAX
EUR/USD
The EUR/USD pair turned higher and closed the day with modest gains around 1.1780, as US PPI data provided a reality check on where US inflation and therefore the Fed stand these days. US July headline PPI came in below expected, falling 0.1% monthly basis, and up by 1.9% when compared to a year earlier. The core readings were also a miss, clearly suggesting that the Fed would be in no rush for additional tightening. Additionally, Fed's Dudley spoke, saying that he expects inflation to surge above 2% in the medium term, and growth to remain moderate, adding to the case for a Fed's gradual policy-tightening plan. Anyway, the greenback closed the day mixed, one again sharply lower against safe-haven assets, an only higher against those currencies who shed ground on self-weakness.
Friday's macroeconomic calendar anticipates a busy end to the week, as several members of the EU will release their July inflation figures, including Germany, while the US will also unveil it July CPI figures. These lasts are expected pretty much unchanged, but the PPI figures were also forecasted to be stronger that the final result according to other economic indicators.
From a technical point of view, the bearish pressure seems to have eased, as the pair posted a higher low daily basis, at 1.1703 and a higher high. For the short term, the 4 hours chart shows that the price remains is surpassing a bearish 20 SMA, while technical indicators turned higher, with the Momentum accelerating north within positive territory and the RSI indicator also up, now at 53. The immediate resistance is now 1.1820, with gains beyond it putting the pair on track to retest the yearly high of 1.1909.
Support levels: 1.1730 1.1690 1.1650
Resistance levels: 1.1820 1.1860 1.1909
USD/JPY
The USD/JPY pair remained under pressure all through this Thursday, falling down to 109.20 area late US session and heading into the Asian one nearby, as tensions between North Korea and the US coupled with poor US data that suggested that the Fed won't need to rush into tightening. US Treasury yields plunged alongside with equities, with the 10-year note benchmark reaching a fresh intraday six-week low of 2.21% and holding nearby at the end of the day, and the 30-year note yield setting at 2.80%. Wall Street had a rough day, with the DJIA and the Nasdaq on a three-digit decline adding to the negative momentum of the pair. The Japanese calendar will remain empty this Friday, which means that local equities will lead the way, and given the latest behavior of European and American indexes, there's a good chance local shares will follow-through. From a technical point of view, the pair gives no sign of changing course, despite being oversold, as in the 4 hours chart, technical indicators are hovering near oversold readings, but the price keeps posting lower lows, while moving further below bearish 100 and 200 SMAs. The immediate support is 108.80, June's low, with a break below the level favoring an extension down to 108.12 this year's low set last April.
Support levels: 109.50 109.20 108.80
Resistance levels: 110.15 110.40 110.70
GBP/USD
The GBP/USD pair settled at 1.2974, having, however, extended its weekly decline by a few pips to 1.2951 early London session. A bunch of fresh data coming from the UK failed to support the Pound, as it was in balance negative for the kingdom. For June, Industrial Production posted a modest advance, while Manufacturing Production remained flat, whilst the trade deficit widened by £2.0 billion to £4.6 billion. Also, the NIESR GDP estimate for the three months to July suggests that UK's output grew by 0.2%, below previous and expected 0.3%, with the economy running below its long run trend. Weak US data helped the pair bounce intraday, but remained unable to surpass the 1.3010/20 region, retreating twice from it. In the 4 hours chart, a flat 200 EMA and a bearish 20 SMA converge in the mentioned region, reinforcing the static support, while technical indicators retain the neutral-to-bearish stance, as the Momentum indicator remains directionless below its 100 level whilst the RSI turned south, but holds above previous lows. A break below 1.2950 will likely lead to or a steady slide towards the 1.2870 region, the next relevant static support.
Support levels: 1.2950 1.2910 1.2870
Resistance levels: 1.3015 1.3050 1.3090
GOLD
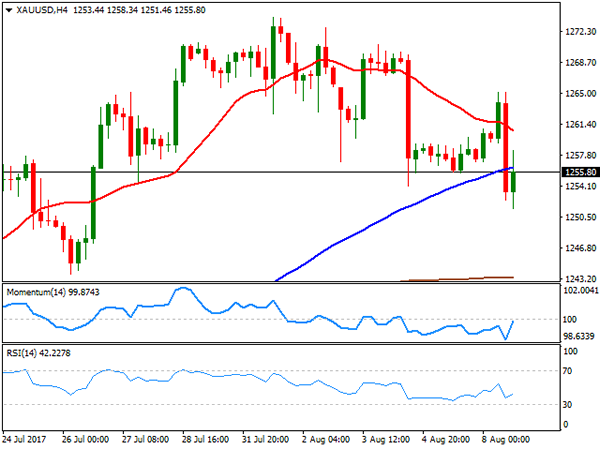
Gold prices extended their rallies to fresh 2-month highs this Thursday, with spot ending at $1,285.00 a troy ounce after trading as high as 1,287.74. The commodity added roughly $35 during the last three days, an impressive run to safety amid escalating tensions between the US and North Korea. A softer-than-expected US producer price index backed gold's rally, as the figures weaken the case for the US Fed to raise interest rates again this year. The bullish potential remains intact, given that in the daily chart, the 20 DMA accelerated north with a strong upward slope below the current level, whilst technical indicators keep heading north, now approaching overbought territory. In the 4 hours chart, technical indicators are losing upward strength, but still holding within overbought readings, whilst moving averages gain upward strength below the current level, favoring another leg higher towards the 1,300.00 figure.
Support levels: 1,281.20 1,270.10 1,261.30
Resistance levels: 1,288.90 1,296.10 1,303.10
WTI CRUDE OIL
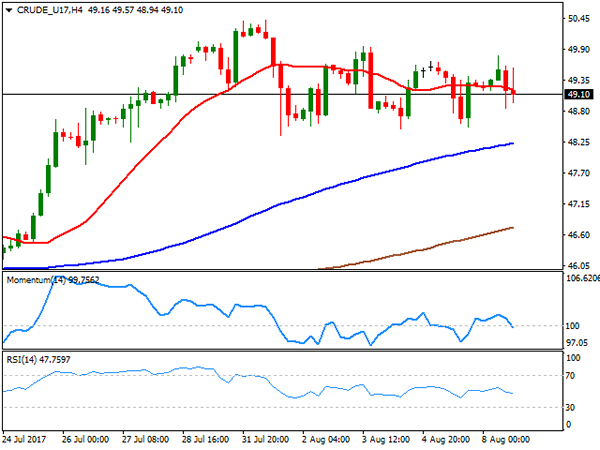
Crude oil prices plunged on Thursday, with West Texas Intermediate futures settling at $48.56 a barrel after trading as high as 50.20, hit by news coming from Russia, as oil producer Gazprom considers it "economically feasible" to resume production in mature fields after a global agreement among OPEC and non-OPEC expires. The news came after the OPEC announced its oil output rose by 173K barrels per day in July, suggesting that the market's glut will persist into 2018.The commodity is at the lower end of its last two-week range and looking quite vulnerable early Asia, as in the daily chart, the benchmark is pressuring its 20 SMA whilst technical indicators turned sharply lower, about to enter negative territory. In the 4 hours chart, the price broke below its 20 SMA and is currently challenging a bullish 100 SMA, while technical indicators head sharply lower within bearish territory, supporting a bearish extension for this Friday.
Support levels: 48.50 47.90 47.20
Resistance levels: 48.80 49.65 50.20
DJIA
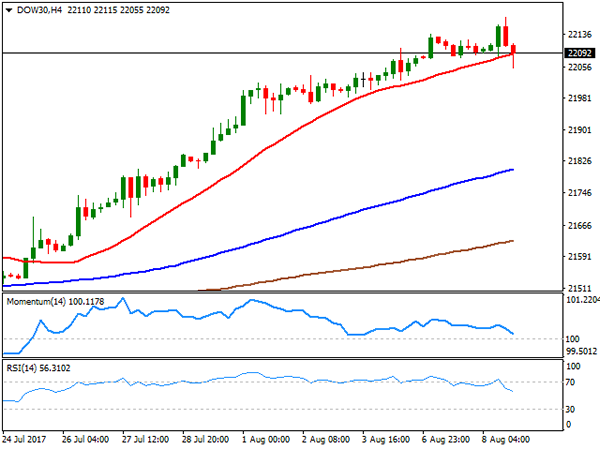
US equities had their worst day in over three months, with the Dow Jones Industrial Average down 204 points to settle at 21,844.01, its lowest since late July. The Nasdaq Composite shed 135 points and closed at 6,216.87, while the S&P ended at 2,438.22, down 1.45% or 35 points. Rising geopolitical tensions alongside with soft US PPI figures were behind the decline, with the tech sector being the worst performer. Within the Dow, only 3 members managed to close in the green, with McDonald's leading the advance, up 1.19%, followed by Coca Cola that added 0.38% following its UK associated earning report. Apple was the worst performer, down 3.19%, followed by Goldman Sachs that shed 2.26%. The index pared losses after testing its 20 DMA in the daily chart, in where technical indicators turned sharply lower, but are still within positive territory. In the 4 hours chart, technical indicators present a strong bearish momentum, despite having entered oversold territory, whilst the 20 SMA gains bearish traction well above the current level, supporting additional slides ahead.
Support levels: 21,808 21,760 21,719
Resistance levels: 21,897 21,941 21,992
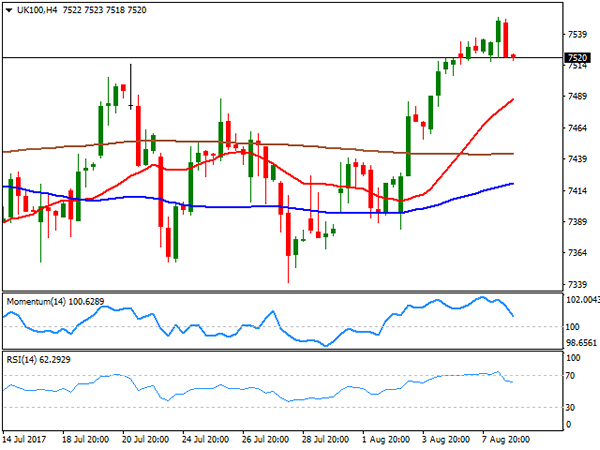
FTSE100
The FTSE 100 shed 106 points to end at 7,389.94, its lowest close for this August. Sentiment was again behind stocks' decline while for the London benchmark, a softer-than-expected economic growth estimate, dented further local investors' mood. The Footsie shed some 50 additional points in after hours trading, tracking Wall Street's decline. Notably, Coca-Cola HBC led advancers with a whopping 9.2% gain after reporting first half earnings growth with sales supported by warmer weather, followed by Worldpay Group that added 4.89%. Most members were down however, with InterContinental Hotels Group being the worst performer, down 3.07%. The Footsie's daily chart presents a strong bearish stance, as the benchmark broke below its 20 and 100 DMAs, while technical indicators entered negative territory with strong bearish slopes. In the shorter term, and according to the 4 hours chart, the bearish potential is also strong, as the index is far below all of its moving averages, whilst technical indicators retain their bearish slopes, despite being in oversold territory.
Support levels: 7,340 7,302 7261
Resistance levels: 7,383 7,410 7,445
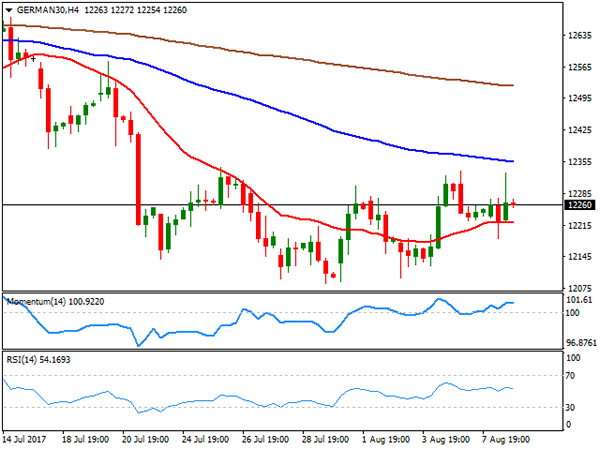
DAX
European equities remained depressed amid risk aversion, with the German DAX ending the day at 12,014.30, down 138 points or 1.15%, its lowest settlement since mid April. European indexes followed the lead of their Asian counterparts, and within the DAX, only two members managed to close in the green, ProSiebenSat.1 Media that added 0.38% and ThyssenKrupp that ended up 0.34%. The worst performer was Henkel, down 4.215, followed by Deutsche Bank that shed 3.78%. The index fell further in after-hours trading, heading into the Asian opening well below the 12,000 threshold. The bearish Momentum is strong according to technical readings in the daily chart, as indicators head lower within bearish territory, whilst the index approaches its 200 DMA at 11,906, now a probable bearish target for this Friday. In the 4 hours chart, the index is bar below now bearish moving averages, whilst technical indicators heading lower within oversold levels, in line with further slides ahead.
Support levels: 11,955 11,906 11,867
Resistance levels: 12,012 12,054 12,098
Daily Technical Analysis: EURUSD, GBPUSD, USDJPY, USDCHF
EURUSD
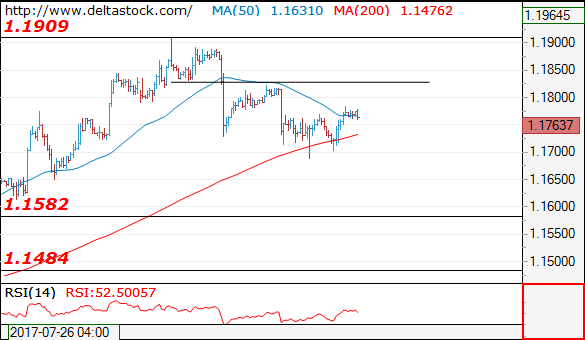
The EURUSD attempted to push lower yesterday bottomed at 1.1704 but closed higher at 1.1772. We have 2 consecutive bullish pin bar printed on daily chart as you can see on my daily chart below, suggests a bullish scenario. The bias is bullish in nearest term testing 1.1850 – 1.1910 region. Immediate support is seen around 1.1750. A clear break below that area could lead price to neutral zone in nearest term testing 1.1700 region but only a clear break below 1.1650 would interrupt the bullish outlook. On the upside, a clear break and daily close above 1.1910 would expose 1.2000 or higher.
GBPUSD
The GBPUSD was indecisive yesterday but overall still able to maintain its bearish intraday bias and hit a fresh two-week low at 1.2951. The bias remains bearish in nearest term testing 1.2930 – 1.2865 region. Immediate resistance is seen around 1.3015. A clear break above that area could lead price to neutral zone in nearest term testing 1.3050 but key resistance remains at 1.3125 region which need to be clearly broken to the upside to reactivate my bullish mode.
USDJPY
The USDJPY had a significant bearish momentum yesterday, broke below the trend line support as you can see on my daily chart below, bottomed at 109.15 and hit 108.99 earlier today in Asian session. This fact activates my bearish mode. The bias is bearish in nearest term testing 108.15. Immediate resistance is seen around 109.50. A clear break above that area could lead price to neutral zone in nearest term and reactivate my neutral mode as we might have a potential false break situation. On the downside, a clear break and daily/weekly close below 108.15 would expose 106.70 and 105.00 region next week.
USDCHF
The USDCHF attempted to push higher yesterday topped at 0.9675 but closed lower at 0.9625 and hit 0.9612 earlier today in Asian session. The bias remains bearish in nearest term testing 0.9550 area. Immediate resistance is seen around 0.9700. A clear break above that area could lead price to neutral zone in nearest term retesting 0.9765 – 0.9807 key resistance which remains a good place to sell with a tight stop loss. On the downside, a clear break and daily/weekly close below 0.9550 would expose 0.9450 key support which is a good place to buy with a tight stop loss.
USDCAD Extends Rise From 2-Year Low, No Change In Underlying Downtrend
USDCAD rose to a one-month high of 1.2752 as it continues to extend the bounce from the two-year low of 1.2413. The price action turned bullish in the short-term since the rise from the July 26 low and it appears that a base may be developing around the 1.2400 area. Daily momentum indicators are bullish – MACD turned back up and RSI rose to break above 50.
Prices reached the 1.2700 handle and are testing the first major retracement level of the decline from 1.3793 to 1.2413. This 23.6% Fibonacci level is at 1.2737. A daily close above it would target the next level (38.2% Fibonacci) at 1.2939 to open the way towards the key 1.3000 handle. Reaching the 1.3100 level and 50% Fibonacci would see some easing in downside pressure. But the market would need to rise above the 200-day moving average (MA) and 61.8% Fibonacci at 1.3263 to see a shift in the recent downtrend to a more neutral bias.
Near-term support is expected at the key 1.2700 area and at 1.2650. From here a deeper decline would target 1.2500 and then the two-year low of 1.2413. Breaking below this point would see a strengthening of the downtrend.
In the bigger picture, the crossover of the 50-day MA below the 200-day MA on July 13 gave a bearish signal. Meanwhile, the 50-day MA continues to point down, highlighting the overall bearish outlook. While the short-term technicals are bullish, clearer signals are needed in order to see if the recent bounce is a mere correction of the underlying downtrend or if it is the start of a shift in the trend.
Geopolitical Tensions Unfold, Though Rally For Safe Havens Comes To Halt
Escalating turmoil between the US and North Korea has continued to dominate the news flow in forex markets as the war of words threatens to spill over into army confrontation. However, the demand rally for the safe haven assets came to a halt ahead of European trading. Oil prices dropped, reversing some late night gains.
Markets in Asia woke up to news that President Trump increased his verbal threat to North Korea by saying that his earlier comment about “fire and fury” was not “tough enough” and how North Korea “better get their act together or they’re going to be in trouble like few nations ever have been in trouble in this world”. This led to gold hitting a fresh nine-week high of $1,288.84 an ounce and pushed the dollar/yen pair down through the 109 level. The demand for the Swiss franc also rose, with the franc strengthening against the dollar and the euro. However, the rally stopped with all the currency pairs being broadly flat and gold modestly declining as European traders were starting the day.
Dollar/yen was last trading at 109.2, gold was at $1,285.75 an ounce, dollar/franc was at 0.9625. The euro has weakened against the dollar to last trade at $1.1755. The pound was modestly up against the greenback, but trading just below the 1.3000 level.
Market participants are eagerly awaiting the inflation figure out of the US later in the session. Economists are forecasting a pickup in the monthly core CPI index with a gain of 0.2% in July, up from 0.1% the prior month. On an annual basis, CPI is expected to mirror the figure of 1.7% recorded in June. Should inflation overshoot expectations, the dollar will strengthen as investors will see rising consumer prices as a sign that an interest rate hike by the Federal Reserve has much higher chances of happening this year. The dollar index was modestly up during Asian trading to last trade at 93.48, linked to the weaker euro.
The Australian dollar has weakened against its US counterpart during the Asian session, though the aussie managed to soften its losses by firming up in late Asian trading. Following the speech by Reserve Bank of Australia Governor Philip Lowe the aussie tumbled to $0.7838, its lowest since mid-July, but managed to recover to 0.7858 ahead of European trading. RBA Governor Lowe opened his speech by saying the bank prefers to be prudent and keep the cash rate at 1.5% as it supports jobs growth and a return to average inflation. However, during the Q&A session the Governor said that market pricing on interest rate moves looks reasonable, also he hinted that the next move could be an increase. This provided support for the aussie.
Oil prices fell during the Asian session despite an updated forecast from OPEC showing that demand could increase by around 200,000 barrels a day for the next two years. WTI was last trading at $48.30 a barrel (down 0.60%) and Brent was at $51.63 (down 0.52%).
US Dollar Poised To Extend Declines Vs Japanese Yen
Key Highlights
- The US Dollar broke a major support area at 110.00 against the Japanese Yen to form a downtrend.
- There was a break below a key bullish trend line at 110.00-110.10 on the daily chart of USD/JPY.
- The US Initial Jobless Claims for the week ending Aug 5 2017 released yesterday posted an increase from 241K (revised) to 244K.
- The US Consumer Price Index for July 2017 will be released today. The forecast is an increase of 1.8% (YoY), more than the last 1.6%.
USDJPY Technical Analysis
The US Dollar failed to recover above 111.00 against the Japanese Yen. The USD/JPY pair broke a crucial support at 110.00 to initialize a major downtrend in the near term.
The daily chart of the USD/JPY pair clearly highlights back-to-back bearish candles from the 114.50 high. The pair even traded below the 112.00 support, 100-day and 200-day simple moving average.
There was also a break below a key bullish trend line at 110.00-110.10 on the daily chart, which has opened the gates for more declines.
If the recent break it true, the pair may soon test the last swing low of 108.15. It could even test the 1.236 extension of the last wave from the 108.80 low to 114.49 high. On the upside, the broken support at 110.00 is now a key resistance.
US Initial Jobless Claims
Recently in the US, the Initial Jobless Claims for the week ending Aug 5 2017 was released by the US Department of Labor. The market was aligned for no change from the last reading of 240K.
However, the actual result was a bit on the lower side, as there was a rise in claims to 244K. The last reading was revised up from 240K to 241K. The 4-week moving average now stands at 241,000, which is 1K less than the previous week's revised average.
The report added that:
The advance seasonally adjusted insured unemployment rate was 1.4 percent for the week ending July 29, unchanged from the previous week's unrevised rate. The advance number for seasonally adjusted insured unemployment during the week ending July 29 was 1,951,000, a decrease of 16,000 from the previous week's revised level.
Overall, the USD/JPY pair remains in a downtrend and it might continue to decline towards 108.00 in the near term.
Economic Releases to Watch Today
- US Consumer Price Index July 2017 (MoM) – Forecast +0.2%, versus 0.0% previous.
- US Consumer Price Index July 2017 (YoY) – Forecast +1.8%, versus +1.6% previous.
- US Consumer Price Index Ex Food & Energy July 2017 (YoY) – Forecast +1.7%, versus +1.7% previous.
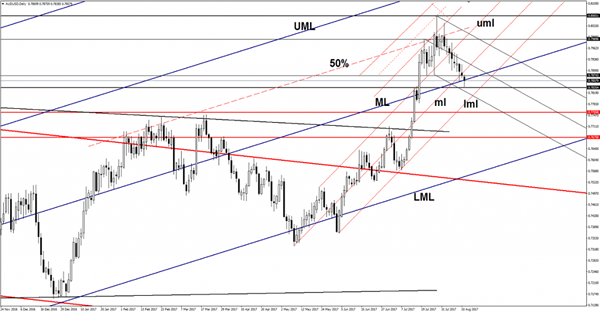
AUD/USD Pressuring Critical Support
Price is trading in the red, resuming the corrective phase. It has dropped as much as 0.7838 today, but has squeezed in the last hours and continues to pressure the median line (ML) of the major ascending pitchfork. A valid breakdown below the median line (ML) will signal a larger drop in the upcoming weeks.
You don't need to rush because we have another major support at the 0.7835.
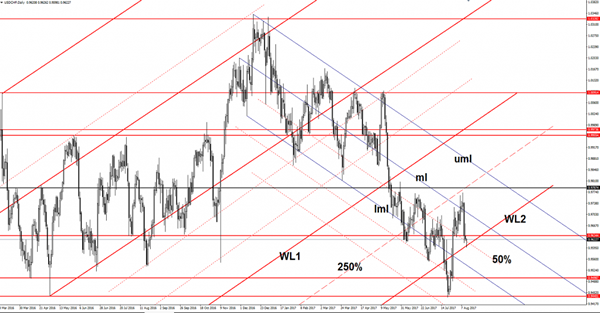
USD/CHF Bounce Or Break
USD/CHF opened with a gap down today and dropped as much as 0.9598 level, much below the 0.9617 yesterday’s low. Price has come back and closed the minor gap, but is premature to say that will climb higher in the upcoming hours because is under massive selling pressure.
A breakdown below the warning line (WL2) looks imminent after the failure to reach and retest the 250% Fibonacci line (ascending dotted line). Only some good US data could save it from downside, a valid breakdown will signal a drop towards the 0.9498 and towards the 0.9440 static support.