Sample Category Title
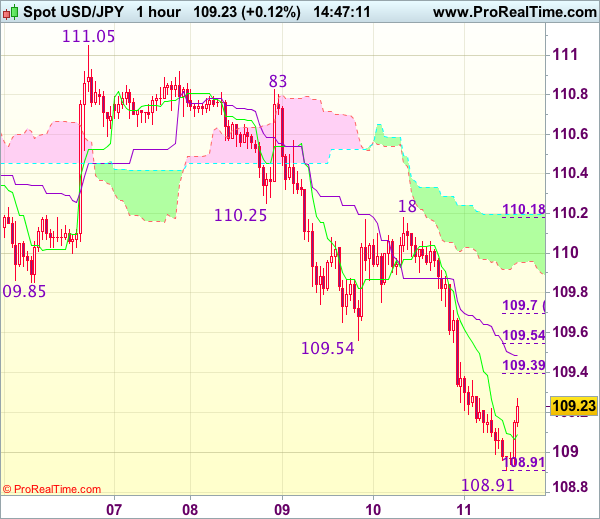
Trade Idea : USD/JPY – Sell at 109.70
USD/JPY - 109.20
Most recent candlesticks pattern : N/A
Trend : Near term down
Tenkan-Sen level : 109.09
Kijun-Sen level : 109.49
Ichimoku cloud top : 110.20
Ichimoku cloud bottom : 109.95
New strategy :
Sell at 109.70, Target: 108.70, Stop: 110.05
Position : -
Target : -
Stop : -
Although the greenback extended recent fall and dropped to 108.91 earlier today, current rebound suggests consolidation above this level would be seen and test of the Kijun-Sen (now at 109.49) is likely, however, reckon 109.70 (61.8% Fibonacci retracement of 110.18-108.91) would limit upside and bring another decline, below said support at 108.91 would extend recent fall to previous support at 108.82, break there would bring subsequent fall towards 108.50 but price should stay above chart support at 108.13.
In view of this, would not chase this fall here and would be prudent to sell dollar on recovery as 108.70 should limit upside. Only break of resistance at 110.18 would abort and signal recent decline has ended and risk a stronger rebound to 110.50 but price should falter below another previous resistance at 110.83.
Elliott Wave View: Gold More Upside
Short term Gold (XAUUSD) Elliott Wave view suggests that rally from 7/10 low is unfolding as a a double three Elliott wave structure. Up from 7/10 low (1204.69), Minor wave W ended at 1274.11 and pullback to 1251.27 ended Minor wave X. Wave Y is currently in progress as a zigzag Elliott wave structure where Minute wave ((a)) is expected to complete with one more leg higher and can reach as high as 1294.3 – 1304.6, then it should pullback in Minute wave ((b)) before the rally resumes, We don’t like selling Gold and expect buyers to appear again after Minute wave ((b)) pullback is complete in 3, 7, or 11 swing, provided pivot at 1251.27 low remains intact.
Gold 1 Hour Elliott Wave Chart
According to Elliott wave theory, Zigzag is a 3 waves structure having an internal subdivision of (5-3-5) swing sequence. The internal swing is labeled as A, B, C where A = 5 waves, B = 3 waves and C = 5 waves. This means that A and C can be impulsive or diagonal. The A and C waves must meet all the conditions of 5 waves structure, such as: having an RSI divergence, ideal Fibonacci extensions, ideal retracements etc. For illustration purpose, in a bearish zigzag graphic below, we can see what Elliott Wave Zig Zag structure looks like. 5 waves down in A, 3 wave bounce in B and another 5 waves down in C.
Geopolitical Tensions = Risk Aversion
On Thursday, US Producer Prices unexpectedly fell to 1.9% in July (forecast was 2.2%), recording its biggest drop in nearly a year and suggesting further constraints in inflation that will likely delay a Federal Reserve interest rate increase. Additional poor data from the US was released by the US Department of Labor for Initial Jobless Claims for the week ending August 4th. Markets had expected a decline from the previous release of 241K but were surprised with an increase to 244K. A tightening labor market and languid inflation puts the FOMC in a difficult position with their plans to tighten economic policy.
However, Federal Reserve Bank of New York President Dudley suggested on Thursday that the central bank was on track to raise interest rates once more, as he expects sluggish inflation to rise over the next several months.
With poor US economic data, and the rising tensions between the US & North Korea, the markets went into risk aversion 'mode', selling USD and buying safe havens. On Thursday, OPEC raised its outlook for oil demand in 2018 and cut its forecasts for output from rivals next year, although another increase in OPEC’s production suggested the market will stay in surplus regardless of the efforts to limit supply.
Japanese markets are closed for the Mountain Day public holiday on Friday so early trading conditions are reflecting less 'risk-appetite' than normal.
EURUSD traded down to 1.17038 in early Thursday trading, before rebounding higher. EURUSD is currently trading around 1.1770.
USDJPY declined over 0.7% on Thursday, reaching a low of 109.205 as the markets bought JPY in typical 'safe-haven' conditions. JPY buying continued overnight with USDJPY hitting a low of 108.90.3 – the lowest level seen in 2-months. USDJPY is currently trading around today’s lows at 108.98.
GBPUSD traded to a 3-week low, as an assortment of UK output and trade data did little to improve investor interest for an economy struggling to meet Bank of England targets. GBPUSD traded to a low of 1.29514, before retracing higher after UK Industrial Production data (MoM) came in at 0.5% in June, beating the forecast of 0.1%. Currently, GBPUSD is trading around 1.2990.
Gold climbed over 0.5% on Thursday, fueled by the tensions between the US and North Korea. Gold reached a high of $1,288.91 overnight – its highest level in 8 weeks. Currently, Gold is trading around $1,285.
WTI declined by nearly 2% on Thursday, as threats of further OPEC cuts are not counteracting the global glut, resulting in WTI hitting a low of $48.65. The trend continued overnight, with WTI losing another 0.9% – hitting a low of $48.20 in early trading. WTI is currently trading around $48.30.
There are several data releases out of Europe early on, but the markets will be focusing on US data releases later in the day:
At 13:30 BST, the US Department of Labor Statistics will release the much-anticipated Consumer Price Index Month-on-Month and Year-on-Year for July. Recent CPI releases have been tepid in regards to showing an economy that is growing with rising personal expenditure, and thus, directly influencing inflation. With an increase in CPI, the FOMC will have more maneuverability with regards to a potential rate hike before the end of the year. However, New York Fed President Dudley cautioned that it will 'take some time' for inflation to reach the central bank’s 2% target, the latest official warning that price pressures remain muted.
Trump Declined To Rule Out A Pre-Emptive Strike
Market movers today
In the US, CPI and CPI core for July are released today. Both inflation measures have been declining rapidly since February and are currently far below the Fed's 2% target and there is no immediate compelling argument for a drastic uptick. Although the Fed continues to believe the tighter labour market will eventually drive inflation up and the US dollar has recently depreciated sharply, these are both effects that take a long time to work their way into the CPI numbers. Thus, we believe inflation will continue to hover around 0.1% m/m (both headline and core), implying both figures increased to 1.7% y/y in July (in June, headline CPI read 1.6% y/y, while CPI core was 1.7%).
Further, Federal Reserve Bank of Minneapolis President Kashkari (voter, dovish) and Federal Reserve Bank of Dallas President Kaplan (voter, dovish) both speak today.
Germany, France, Spain and Italy all release their final HICP figures today.
In Denmark, gross unemployment figures are out and in Finland, Fitch may publish the country's debt rating.
Selected market news
Financial markets are in risk-off mode as the stand-off between the US and North Korea continues to escalate, with North Korea threatening to send missiles towards the US bases at Guam. Last night, President Trump reacted to the new threats saying 'They [North Korea] should be very nervous, because things will happen to them like they never thought possible, OK?'. Trump also stood by his words from earlier this week to bring down 'fire and fury' on North Korea. In fact, he said that the words earlier in the week might not have been 'tough enough'. Furthermore, Trump declined to rule out a pre-emptive strike.
The market jitters intensified on the obvious escalation of the conflict and US 10Y yields dropped by 5bp to 2.20%, German yields to 0.40% and in the equity market the colour was red across the board with the Nasdaq down more than 2%. The reaction in the equity market might have been aggravated by the fact that US equity indices were trading at or close to an all-time high going into this crisis. The market jitters are also very visible in the VIX index – the fear index – which rose 44% to above 16 yesterday night. But in that respect, note that the level for the VIX is still well below the level seen around the US presidential election for example. Hence, there is still room on the upside here. The market jitters have not necessarily peaked at this stage. In the FX market the safe-haven support for JPY has continued and USD/JPY has moved below 109 overnight.
There is a growing risk that the geopolitical concerns will continue. If that is the case, we would expect the biggest bond market impact to be on the US Treasury market. Investors will move into the highly liquid and not least ‘high yielding' US market. In that way they will also be able to benefit from a possible repricing of Fed expectations and a possible appreciation of the US dollar.
Today, the European market will continue to focus on the geopolitical jitters and we should expect lower Bund yields and lower equity markets as the markets open this morning.
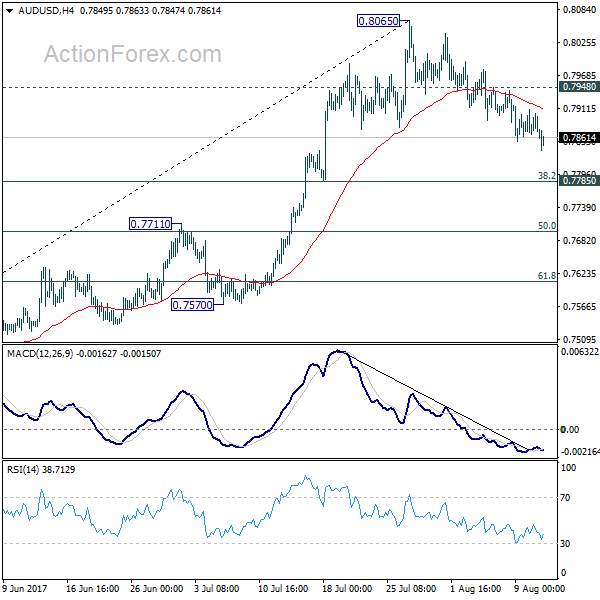
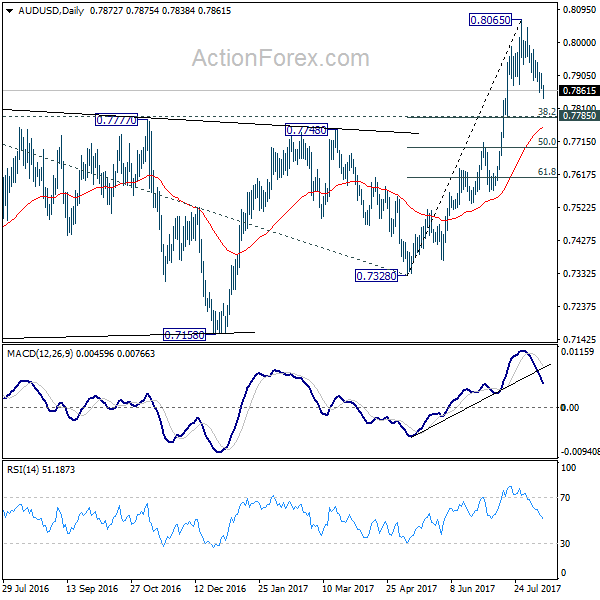
AUD/USD Daily Outlook
Daily Pivots: (S1) 0.7855; (P) 0.7883; (R1) 0.7902; More...
Intraday bias in AUD/USD remains on the downside as pull back form 0.8065 is still in progress. Deeper fall would be seen to 0.7785 cluster support (38.2% retracement of 0.7328 to 0.8065 at 0.7783). But we'd expect strong support there to bring rebound. Above 0.7948 minor resistance will turn bias back to the upside for retesting 0.8065. But decisive break there is needed to confirm rally resumption. Otherwise, we'd expect more consolidative trading in near term.
In the bigger picture, current development suggests that rebound from 0.6826 is developing into a medium term rise. There is no confirmation of trend reversal yet and we'll continue to treat such rebound as a corrective pattern. But in any case, break of 55 month EMA (now at 0.8100) will target 38.2% retracement of 1.1079 to 0.6826 at 0.8451. Break of 0.7328 support is needed to confirm completion of the rebound. Otherwise, further rise is now expected.
Market Update – Asian Session: Asian Equities And Currencies Extend Sell Off Amid Focus On North Korea And Ahead...
Asia Summary
With Japan closed for holiday, equity markets across Asia have extended the declines seen in the prior session (Hang Seng -1.8%, Kospi -1.6%, Shanghai -1.6%), amid lingering worries related to North Korea, rise in VIX and the over 2.4% decline seen in the Nasdaq in NY trading. As such, technology stocks have underperformed (Tencent -3%, Hynix -4%), along with commodity related names (Rusal -4.5%). Bucking the trend, shares of Noble Group have risen over 10% following its H1 results. Chinese defense companies are also moving higher with North Korea in focus.
With the weakness in equities and generally 'risk-off' sentiment, the Aussie has declined by over 0.40%. RBA Governor Lowe also reiterated his preference for a weaker currency. With the Asian equity weakness and North Korea tensions, Asian currencies are broadly weaker, with the Philippine Peso declining to its lowest level since 2006. The Korean Won has weakened by 0.2%, after the sharp losses seen on Thursday’s session.
Looking ahead, traders are focusing on the US July CPI figures which are due to be released later today.
Key economic data
(CN) China July Fiscal Revenues CNY1.65T, +11.1% y/y; Fiscal Spending CNY1.35T, +5.4% y/y
(KR) South Korea July Export Price Index M/M: 1.0% v -0.2% prior; Y/Y: 8.0% v 4.7% prior
(SG) SINGAPORE Q2 FINAL GDP Q/Q: 2.2% V 0.5%E; Y/Y: 2.9% V 2.5%E
(NZ) NEW ZEALAND JULY BUSINESS NZ MANUFACTURING PMI: 55.4 V 56.2 PRIOR
(NZ) New Zealand REINZ July House Sales Y/Y: -24.5% v -24.7% prior
Speakers and Press
Australia
(AU) RBA Gov Lowe: Not prepared to intervene at moment, but prepared to intervene in A$ in 'extreme' situations
China
(CN) China Cybersecurity Authority: Probing Tencent, Baidu, Sina Weibo for violation of cybersecurity laws
(CN) China said to consider curbs on certain money market fund investments - China Securities Times
Japan
(JP) Japan readies missile shield following the recent North Korea threat related to Guam - Japanese Press
(JP) According to Japanese press poll, 64% are against PM Abe serving a third term as LDP Head
Other
(KR) US Defense Sec Mattis: Diplomatic efforts on North Korea are 'gaining traction'
(KR) South Korea Ministries held meeting to discuss the economy and markets, to take measures if sees unusual market movements
(PH) Philippines Central Bank Governor Espenilla: BSP following 'flexible' FX rate policy; Peso (PHP) movement 'modest' and its CPI pass-through is muted
(SA) Saudi Oil Min Al-Falih: More oil output cuts must be collective
Asian Equity Indices/Futures (00:30ET)
Nikkei closed for holiday, Hang Seng -1.8%%, Shanghai Composite -1.6%, ASX200 -1.3%, Kospi -1.6%
Equity Futures: S&P500 -0.1% ; Nasdaq -0.4% , Dax flat , FTSE100 flat
FX ranges/Commodities/Fixed Income (00:30ET)
EUR 1.1761-1.1777; JPY 108.91-109.22 ; AUD 0.7839-0.7876; NZD 0.7252-0.7283
Aug Gold +0.1% at 1,291 /oz; Aug Crude Oil -0.3% at $48.47/brl; Sept Copper -0.7% at $2.89/lb
GLD SPDR Gold Trust ETF daily holdings unchanged at 786.9 tons
(AU) Australia sells July 2022 Bonds, avg yield 2.1337%, bid to cover 4.69x
(CN) PBOC SETS YUAN REFERENCE RATE AT: 6.6642 V 6.6770 PRIOR
(CN) China PBoC OMO injects CNY130B in v CNY90B in 7 and 14-day reverse repo prior
Equities notable movers
Australia
National Australia Bank, NAB.AU Q3 Cash Profit +5%, general weakness the Australian banking sector; -1.4%
US markets on close: Dow -0.9%, S&P500 -1.5%, Nasdaq -2.1%, Russell -1.8%
Best Sector in S&P500: Utilities +0.3%
Worst Sector in S&P500: Technology -2%
At the close: VIX 16.04 (+4.93 pts); Treasuries: 2-yr 1.34% (-1bp), 10-yr 2.25% (-1bp), 30-yr 2.83% (-2bps)
US Market Summary
US markets extended their opening losses into the afternoon, after European equities closed at their lowest level since March, as heightened tensions on the Korean peninsula still reverberated globally and Pres Trump made further bellicose remarks on the situation. All sectors except utilities are in the red for the day, with tech sending the Nasdaq to its worst three-day slide since November. Kohl's and Macy's led retail names lower after earnings and guidance. The Dollar weakened throughout the session after PPI data came in lower than expected and NY Fed President Dudley sounded more cautious about the inflation outlook than he did just a couple of months ago. Treasury yields dropped as investors showed appetite for the 30-year bond auction mid-day amidst the geopolitical tensions. The VIX popped to a three-month high, and gold futures are up at their best levels since June.
US Afterhours Movers
After Market Movers
AMRS Reports Q2 -$0.46 v -$1.06e, Rev $25.7M v $23.7Me; +11.9% afterhours
CWH Reports Q2 $0.91 v $0.69e, Rev $1.3B v $1.16Be; +5.7% afterhours
NVDA Reports Q2 $1.01 v $0.69e, Rev $2.23B v $1.95Be; Guides Q3 Rev $2.35B v $2.13Be; -4.5% afterhours
SNAP Reports Q2 -$0.16 v -$0.14e, Rev $181.7M v $187Me; Daily active users (DAUs) 173M, +4% q/q, +21% y/y; -12.7% afterhours
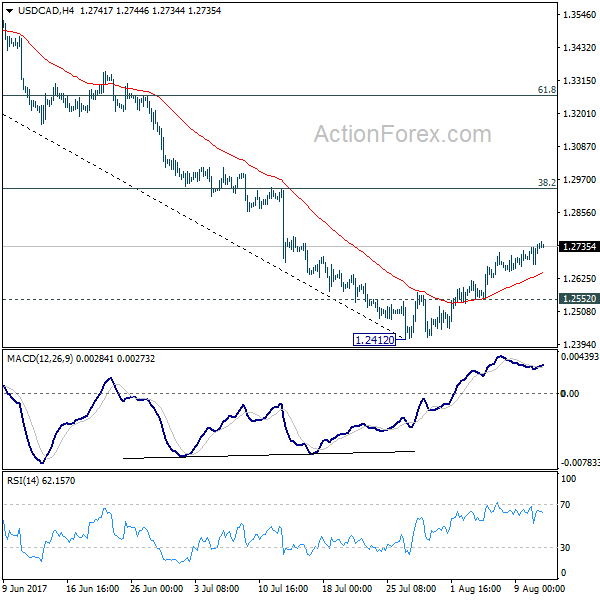
USD/CAD Daily Outlook
Daily Pivots: (S1) 1.2695; (P) 1.2720; (R1) 1.2768; More....
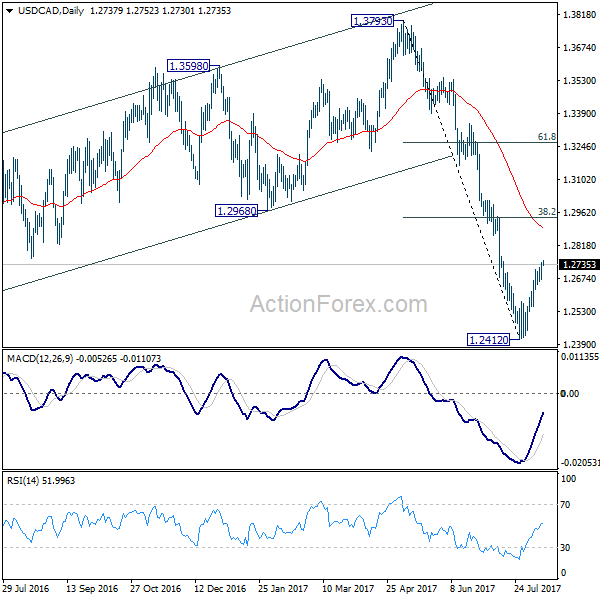
USD/CAD's rebound from 1.2412 short term bottom is still in progress and further rise would be seen. Intraday bias remains on the upside for 38.2% retracement of 1.3793 to 1.2412 at 1.2940. Considering the the pair is losing upside momentum, we'd expect upside to be limited by 1.2940 to complete the correction. On the downside, below 1.2552 minor support will turn bias back to the downside for retesting 1.2412 low first.
In the bigger picture, price actions from 1.4689 medium term top are seen as a correction pattern. A short term bottom is formed at 1.2412 after hitting 61.8% projection of 1.4689 to 1.2460 from 1.3793 at 1.2415. But there is no sign of completion of the correction yet. Break of 1.2412 will target 50% retracement of 0.9406 to 1.4869 at 1.2048. At this point, we'd look for strong support from there to contain downside and bring rebound. Meanwhile, sustained break of 1.2968, 38.2% retracement of 1.3793 to 1.2412 at 1.2940 will be the first sign of completion of the correction and will turn focus back to 1.3793 key resistance.
EUR/USD Daily Outlook
Daily Pivots: (S1) 1.1722; (P) 1.1753 (R1) 1.1804; More...
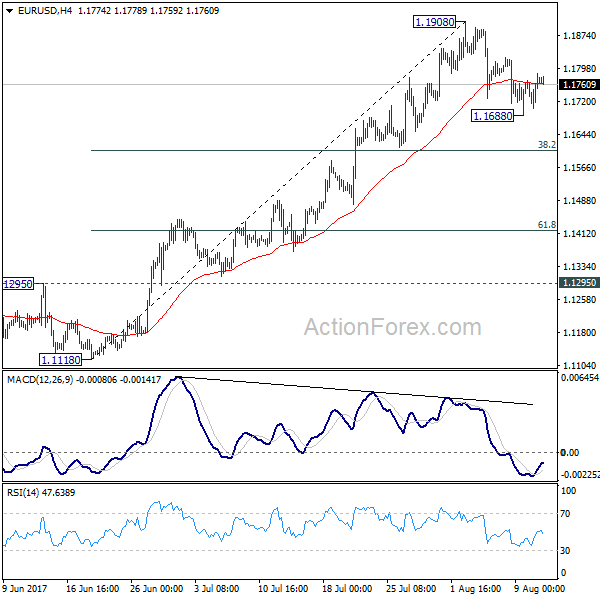
A temporary low is in place at 1.1908 and intraday bias is turned neutral first. Stronger recovery could be seen but break of 1.1908 is needed to confirm up trend resumption. Otherwise, more consolidation would be seen with risk of another decline. Below 1.1688 will target 38.2% retracement of 1.1119 to 1.1908 at 1.1606. At this point, we'd expect strong support from 1.1606 to bring rebound. But sustained break of 1.1606 would bring deeper pull back to 61.8% retracement at 1.1420.
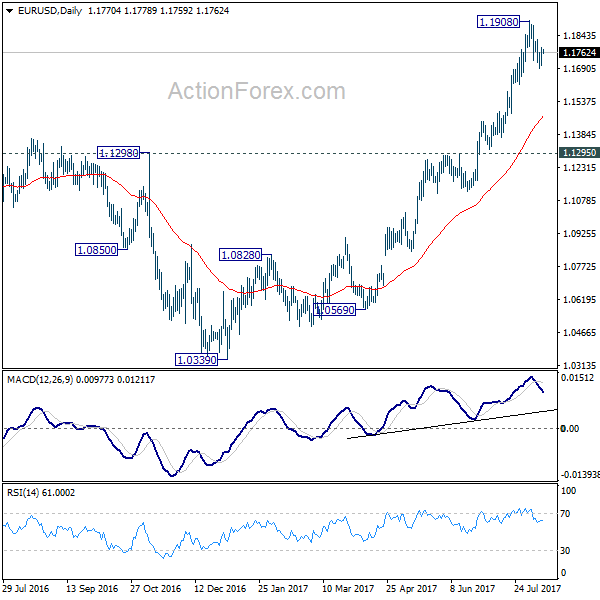
In the bigger picture, an important bottom was formed at 1.0339 on bullish convergence condition in weekly MACD. Sustained break of 55 month EMA (now at 1.1760) will pave the way to key fibonacci level at 38.2% retracement of 1.6039 (2008 high) to 1.0339 (2017 low) at 1.2516. While rise from 1.0339 is strong, there is no confirmation that it's developing into a long term up trend yet. Hence, we'll be cautious on strong resistance from 1.2516 to limit upside. But for now, medium term outlook will remain bullish as long as 1.1295 support holds, in case of pull back.
GBP/USD Daily Outlook
Daily Pivots: (S1) 1.2946; (P) 1.2980; (R1) 1.3011; More...
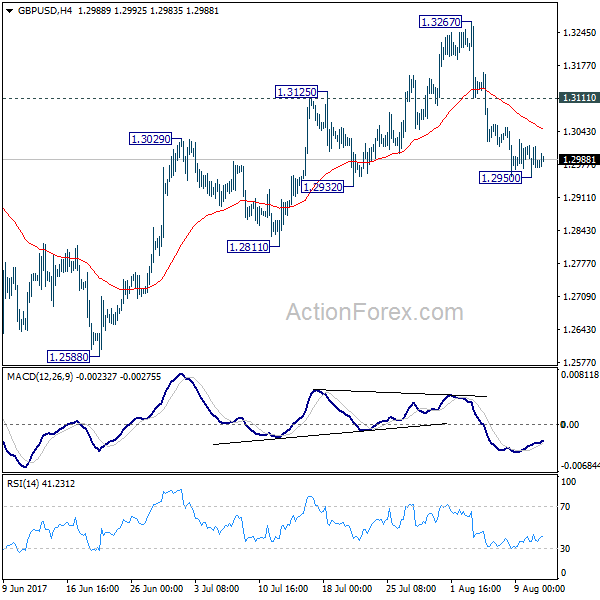
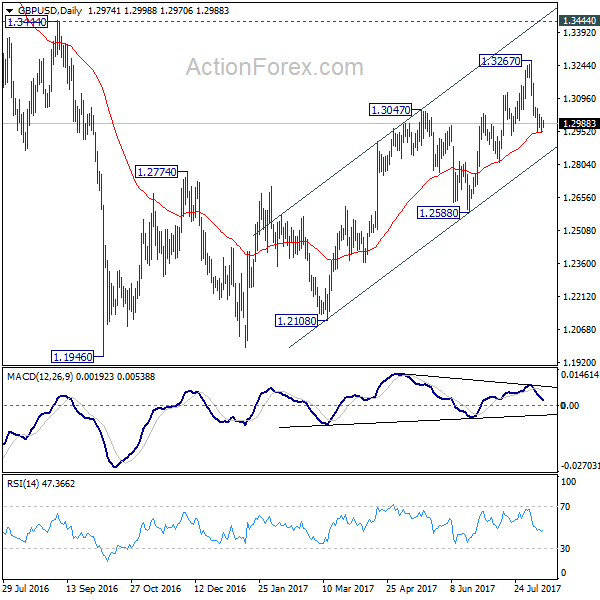
Intraday bias in GBP/USD remains neutral for consolidation above 1.2950 temporary low. Outlook stays bearish and deeper decline is expected as long as 1.3111 resistance holds. As noted before, price actions from 1.1946 are seen as a corrective pattern and could have completed at 1.3267. Break of 1.2932 will affirm this bearish case and target 1.2588 key near term support for confirmation. However, break of 1.3111 resistance will turn bias back to the upside for retesting 1.3267 high.
In the bigger picture, overall, price actions from 1.1946 medium term low are seen as a corrective pattern that is still in progress. While further upside is expected, larger outlook remains bearish as long as 1.3444 key resistance holds. Down trend from 1.7190 (2014 high) is expected to resume later after the correction completes. And break of 1.2588 will indicate that such down trend is resuming.
USD/CHF Daily Outlook
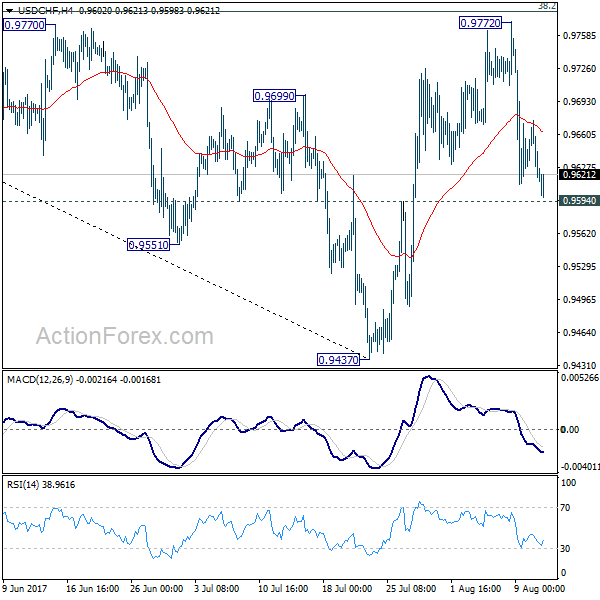
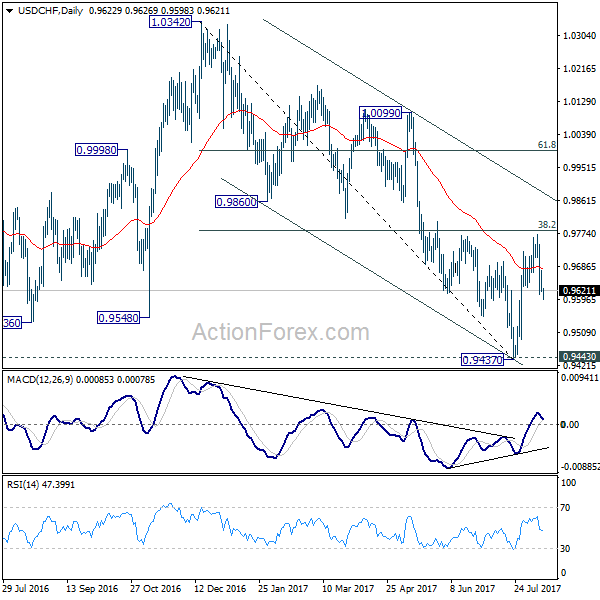
Daily Pivots: (S1) 0.9603; (P) 0.9639; (R1) 0.9660; More...
USD/CHF is staying in range of 0.9594/9772 and intraday bias remains neutral for the moment. Outlook is a bit mixed as the pair is bounded inside medium term falling channel. The pair was also limited below 38.2% retracement of 1.0342 to 0.9437 at 0.9783. Firm break of 0.9594 will dampen our bullish view and turn bias back to the downside for 0.9437. This could also extend the fall through 1.0342 through 0.9437/43 key support level. On the upside, above 0.9772 will revive the bullish case of reversal and turn bias back to the upside.
In the bigger picture, current development argues that USD/CHF has successfully defended 0.9443 key support level. And long term range trading in 0.9443/1.0342 is extending with another rise. At this point, there is no sign of an up trend yet. Hence, while further rise is expected in USD/CHF, we'll start to be cautious on loss of momentum above 61.8% retracement of 1.0342 to 0.9437 at 0.9996.