Sample Category Title
NZD/USD Into A Corrective Phase
NZD/USD focuses on correction right now and could drop much deeper if the USDX will resume the minor rebound. Price looks undecided right now, has squeezed in the last hours and has erased the earlier losses. Could decrease further as is still under selling pressure on the short term, is seeking for strong support and could find one very soon.
Price dropped as much as 0.7308 level on Wednesday, you should be careful because the fundamental factors will take the lead again. Technically is expected to drop further and I believe that only the fundamental factors could turn the price to the upside.
As already know, the Reserve Bank of New Zealand will publish the Official Cash Rate, which is expected to remain unchanged at 1.75%. The interest rate remains steady since since November 2016, when was decreased for the last time by 0.25%.
The RBNZ Rate Statement and the RBNZ Press Conference could bring a high volatility on the NZD/USD.
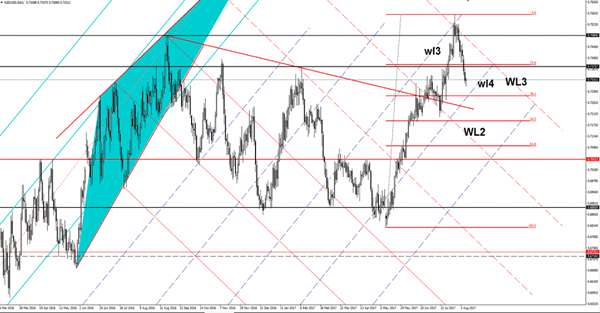
Price goes down and could reach and retest the fourth warning line (wl4) of the former ascending pitchfork. I've said in the previous articles that the perspective remains somehow bullish on the Daily chart as long as the rate stays above the warning line (wl4).
The correction is natural after the rejection from the confluence between the WL3 with the third warning line (wl3). A dovish RNZD will punish the Kiwi, which will depreciate versus all its rivals.
Only a valid breakdown will signal a major drop and a reversal because the current drop could be only temporary.
How Have You Drawn Your GBP/JPY Daily Trend Line
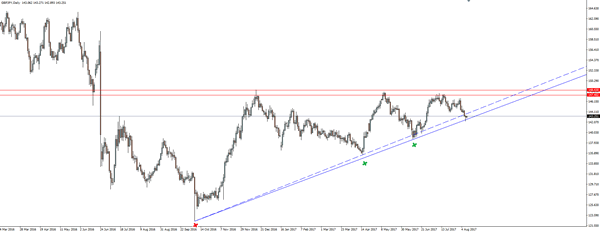
On GBP/JPY we have this huge trend line support level that has formed, but with the subjectivity of trend lines fresh in the mind after Tuesday's GBP/USD blog, I want to ask the following simple question:
'How have you drawn your GBP/JPY daily trend line?'
GBP/JPY Daily:
Trump’s Bay Of Pigs Moment
Trump's Bay of Pigs Moment
The relentless risk off moves in currency markets appears to have abated somewhat after Wednesday's pyrotechnics in Asia.The dollar took on a distinctly August inspired flavour in NY afternoon trading within extremely subdued ranges.
But looking at price action across asset classes, the North Korea entanglement remains the number one agitator. US ten year yield traded towards 2.2 % gold ripped through $1,277 per ounce in afternoon NY as equities have turned decidedly edgy amid the intensifying geopolitical and fiscal uncertainties.
Liquidity conditions have a way of exaggerating market panic, but when a cowardly act of terrorism was reported in Paris, it increased the markets anxiety level 10 folds as risk sentiment quickly devolved.But it will be yesterday Trump's Bay of Pigs moment that will keep traders on edge. However, we've seen this picture before and the geopolitical status quo usually returns to equilibrium fairly quickly.But it should even more so this time after Secretary of State Rex Tillerson extinguished the raging political fires. CNN reported that Tillerson said that “nothing that I have seen, and nothing that I know of, would indicate that the situation has dramatically changed in the last 24 hours. Americans should sleep well at night.”
Traders very keen to hear Bill Dudley, the Boss of the powerful NY Fed who will speak on Thursday and the markets are anticipating he will provide a key on Fed policy and impart some influence on global sentiment.
Australian Dollar
The regional geopolitical risk overhang continues to weigh on the Aussie. But taxing liquidity conditions contributed to some outsized moves yesterday after the AUD was sideswiped by CNY and AUD data that marginally missed the mark. Yesteradtys aggressive sell off after Chinese CPI miss the mark was a combination of bad timing and low liquidity rather than anything else. But the current risk averse mind set aside. With the US “reflationaistas” coming to the fore after some seriously buoyant jobs data all but setting the stage for a robust US economic recovery, we may only be one solid US data point away from a big repricing of December US rate hike probabilities.A more aggressive Fed is the most significant headwind for the Aussie dollar bulls
Euro
A short lived peak below 1.1700 raised a few eyebrows but with little follow through, the tried and tested buy the dip mentality ruled. Participation remains light as traders continue to look for larger position squeeze to get back long EUR positioning comfortably
Japanese Yen
Recent moves are all about traders getting in front of haven Yen repatriation flow on global risk aversion. And predictably those bets are unwinding after Secretary of State Tillerson doused the flame of fury. Japanese investors, who hold considerable foreign investment exposures, are prone to repatriate on risk aversion. This despite the proximity to North Korea. Until the missiles actually launch, this will continue to be the go to geopolitical risk averse investor mind set.
Korea Complex
With geopolitical tensions increasing on the Korean Peninsula, KRW could remain under pressure as the market should continue to engage USD longs until the pressures abate.
The KOSPI has been a real pain trade since the NASDAQ swoon.With the market turning sour on Korean assets in the wake of the latest brouhaha, investors will likely be in for more distress and sleepless nights before things get better.
Gold Jumps on North Korea Jitters
Gold has posted strong gains in the Wednesday session. In North American trade, spot gold is trading at $1272.93, up 0.97% on the day. On the release front, there are no major events on the schedule. US employment indicators missed their forecasts. Preliminary Nonfarm Productivity gained 0.7%, short of the forecast of 0.9%, while Preliminary Unit Labor Costs came in at 0.6%, well below the estimate of 1.1%. On Thursday, the US will release PPI, which is expected to remain at 0.1%. The markets are also expecting unemployment claims to remain steady at 240 thousand.
Gold prices have risen in recent weeks, taking advantage of a struggling US dollar. The rally has continued on Wednesday, as geopolitical tensions have boosted the metal. The war of words between North Korea and the US has escalated, and the rising political tensions have sent global stock markets lower. Pyongyang has reacted furiously to new sanctions imposed by Washington, and has threatened to attack Guam, which is a major US military base. President Donald Trump is taking a tough line on North Korea, and has promised that any aggression from North Korea will be met with "fire and fury." With Trump and North Korean President Kim Jong-un on a possible collision course, risk appetite has decreased, as nervous investors have snapped up gold, a traditional safe-haven asset. If the crisis worsens, we can expect gold prices to move towards the $1300 level.
Investor appetite for the US dollar has softened, as political risk has been growing and there are doubts if the Fed will raise rates before 2018. President Trump's administration seems rudderless and Trump's inability to pass healthcare legislation has increased political risk in the US. As well, the Federal Reserve's monetary policy remains unclear. Earlier this year the Fed strongly hinted that it planned to raise rates three times in 2017, but has only pressed the rate trigger twice. In June, Fed Chair Janet Yellen shrugged off low inflation, saying that it was due to "transient" factors, leaving the impression that the Fed still planned one final hike. However, inflation has not improved and the Fed has changed its tune. Last week, St. Louis Federal Reserve President James Bullard said he opposed further Fed hikes, warning that another hike would actually delay inflation from hitting the Fed's target of 2%. The markets have become more skeptical about a rate hike in December, as the odds have fallen to 34%, compared to 43% a week ago.
Pound Unchanged, UK Manufacturing Report Next
The British pound is almost unchanged in Wednesday trade. In the North American session, the pair is trading at 1.2995, up 0.02% on the day. On the release front, US employment indicators missed their forecasts. Preliminary Nonfarm Productivity gained 0.7%, short of the forecast of 0.9%, while Preliminary Unit Labor Costs came in at 0.6%, well below the estimate of 1.1%. Later in the day, the UK releases the RICS House Price Balance, which is expected to improve slightly to 9%. Thursday will be busy, with key indicators in both the UK and the US. The UK releases Manufacturing Production, which is expected at a flat 0.0%. The US will release PPI, which is expected to remain at 0.1%. The markets are also expecting unemployment claims to remain steady at 240 thousand.
The war of words between North Korea and the US has escalated, and the rising political tensions have sent global stock markets lower. Pyongyang has reacted furiously to new sanctions imposed by Washington, and has threatened to attack Guam, which is a major US military base. President Donald Trump is taking a tough line on North Korea, and has promised that any aggression from North Korea will be met with "fire and fury." With Trump and North Korean President Kim Jong-un on a possible collision course, risk appetite has decreased, as nervous investors have snapped up gold, a traditional safe-haven asset. If the crisis worsens, the pound could take advantage and move higher against the dollar.
The pound continues to lose ground, as GBP/USD has slipped 2.0% since August 3. On Tuesday, the pair dropped below the symbolic 1.30 level, for the first time since July 21, in response to a strong US employment report. The indicator improved to 6.16 million, marking a record high. This follows the strong nonfarm payrolls report on Friday, as the US labor market remains red-hot.
The US dollar has managed to hold its own against the pound, but the greenback is under pressure. Paralysis in Washington is weighing on the dollar, as Donald Trump's antics and the Republican's inability to pass a healthcare bill in Congress has increased political risk in the US. As well, the Federal Reserve's monetary policy remains unclear. Earlier this year the Federal Reserve strongly hinted that it planned to raise rates three times in 2017, but has only pressed the rate trigger twice. In June, Fed Chair Janet Yellen shrugged off low inflation, saying that it was due to "transient" factors, leaving the impression that the Fed still planned one final hike. However, inflation has not improved and the Fed has changed its tune. Last week, St. Louis Federal Reserve President James Bullard said he opposed further Fed hikes, warning that another hike would actually delay inflation from hitting the Fed's target of 2%. The markets have become more skeptical about a rate hike in December, as the odds have fallen to 34%, compared to 43% a week ago.
Safe Havens Benefit on Geopolitical Uncertainty; Dollar Touches 3-Week High
Rising tensions between North Korea and the US led traditional safe havens to post gains today. Meanwhile, the few data releases during the day failed to cause much of a reaction in currency markets.
The Swiss franc, which as of recently was hitting headlines on continuing weakness, surged today on the back of safe haven demand. In particular, euro/franc fell to as low as 1.1259 after starting the day at 1.1447. It was last down 0.9% on the day. Dollar/franc also posted hefty losses – the pair was last trading at 0.9666, down 0.8%. Both pairs touched near two-week lows during today's trading while a considerable portion of the franc's earlier gains were retraced by late European trading hours.
Japan's currency and gold, also perceived as safe havens, benefitted as well from the risk-off sentiment. Dollar/yen fell to a near two-month low of 109.55 during today's trading. It afterwards gave up more than 50% of its daily gains to last trade above the 110 mark. In the meantime, gold rose to a near two-month high of $1276.07 an ounce. The precious metal was trading around $1271.50 during afternoon European trading hours, being up 0.9% on the day.
Out of the US, preliminary estimates showed second quarter non-farm productivity, which measures hourly output per worker, rising 0.9% on an annualized basis, above the 0.7% increase that was expected. The respective figure from the first quarter was revised upwards to 0.1% from zero before. Meanwhile, labor costs over the same period were kept under control as a result of improving productivity – they rose by 0.6%. Forecasts were for a rise by 1.2%, while costs during the first quarter were revised upwards to 5.4% from 2.2%. Dollar/yen moved slightly higher as the numbers hit the markets.
Later in the day, figures showed US wholesale inventories accelerating by 0.7% month-on-month in June, the most in six months. Both analysts' projections and May's rise stood at 0.6%. A significant part of the increase was attributed to rising automobile inventories as the sector is facing difficulties due to slowing demand, resulting in a supply glut. The greenback posted some losses relative to the yen as the data went public.
The dollar index, a broader gauge of dollar strength, rose to its highest since July 28 when it reached 93.89 in today's trading. The index was last up 0.1% and close to its daily high. The US currency was up relative to the euro, though not by much – euro/dollar traded at 1.1745. Pound/dollar was more or less flat just below the 1.30 handle.
Turning to Canadian data, seasonally adjusted housing starts rose to 222.3 thousand in July from June's 212.9 thousand. Expectations were for a reading of 205.0 thousand. Turning to building permits, those surprised to the upside in June, rising by 2.5% in contrast to analysts' forecasts for a contraction by 2.0%. The rise was mostly due to increased plans for commercial buildings in Ontario. May' respective figure was revised upwards to point to a 10.7% growth from 8.9% before. Forex market reaction within the first few minutes of the release of the above data was limited. The Canadian dollar was under pressure recently relative to its US counterpart due to falling oil prices. Dollar/loonie last traded marginally above the 1.27 handle, 0.3% up on the day and close to its daily high 1.2720 which constituted a near one-month high.
The Energy Information Administration's report on US crude oil inventories showed stockpiles falling much more than expected. WTI rose upon immediate release of the data, though not by much while it soon after reversed course to head lower. It was last 0.1% down at $49.11 a barrel. Brent crude was flat at $52.16. the fall in price could have been attributed to rising gasoline inventories.
The Reserve Bank of New Zealand will be completing its meeting during afternoon US trading hours. Kiwi/dollar was slightly down at 0.7320 after hitting a three-week low of 0.7307 earlier in the day.
Trade Idea Wrap-up: USD/CHF – Sell at 0.9725
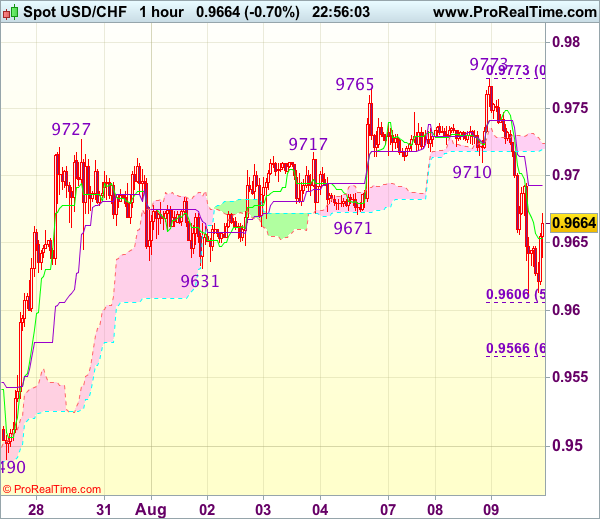
USD/CHF - 0.9663
Most recent candlesticks pattern : N/A
Trend : Near term up
Tenkan-Sen level : 0.9653
Kijun-Sen level : 0.9693
Ichimoku cloud top : 0.9724
Ichimoku cloud bottom : 0.9721
Original strategy :
Sell at 0.9725, Target: 0.9625, Stop: 0.9760
Position : -
Target : -
Stop : -
New strategy :
Sell at 0.9725, Target: 0.9625, Stop: 0.9760
Position : -
Target : -
Stop : -
Although the greenback extended recent rise from 0.9438 to 0.9772, lack of follow through buying on break of previous resistance at 0.9765 and the subsequent selloff below support at 0.9631 add credence to our view that top has been formed at 0.9773, hence consolidation with downside bias remains for further fall to 0.9605-10 (50% Fibonacci retracement of 0.9438-0.9773), however, near term oversold condition should limit downside to 0.9580 and reckon 0.9665 (61.8% Fibonacci retracement) would hold from here.
In view of this, we are looking to sell dollar on recovery as 0.9725-30 should limit upside. Only break of yesterday’s high at 0.9773 would abort and revive bullishness for the rise from 0.9438 to extend gain to 0.9800-10.
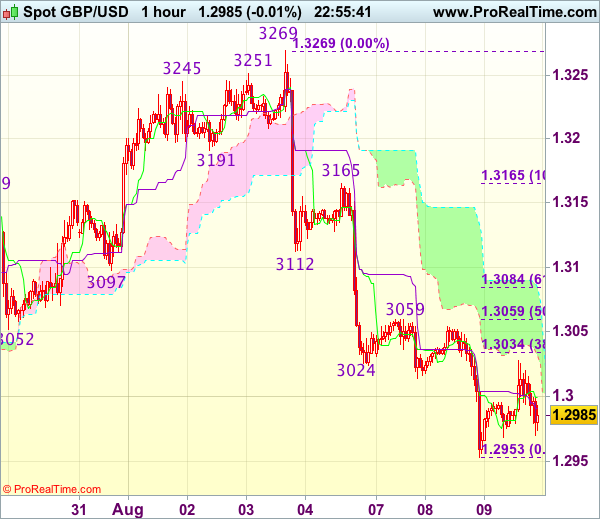
Trade Idea Wrap-up: GBP/USD – Hold long entered at 1.3000
GBP/USD - 1.2990
Most recent candlesticks pattern : N/A
Trend : Near term down
Tenkan-Sen level : 1.2998
Kijun-Sen level : 1.2991
Ichimoku cloud top : 1.3074
Ichimoku cloud bottom : 1.3025
Original strategy :
Bought at 1.3000, Target: 1.3100, Stop: 1.2965
Position : - Long at 1.3000
Target : - 1.3100
Stop : - 1.2965
New strategy :
Hold long entered at 1.3000, Target: 1.3100, Stop: 1.2965
Position : - Long at 1.3000
Target : - 1.3100
Stop : - 1.2965
Although cable slipped to 1.2953 yesterday, the subsequent rebound suggests consolidation above this level would be seen and gain to 1.3059 resistance is likely, however, break there is needed to signal low is possibly formed, bring test of 1.3080-85 (61.8% Fibonacci retracement of 1.3165-1.2953), break there would add credence to this view, bring a stronger rebound to 1.3110-20 but resistance at 1.3165 should remain intact.
In view of this, we are holding on to our long position entered at 1.3000. Below 1.2965-70 would signal decline has resumed and extend the fall from 1.3269 top towards previous chart support at 1.2933 but reckon 1.2900 would hold from here, risk from there has increased for a rebound to take place later.
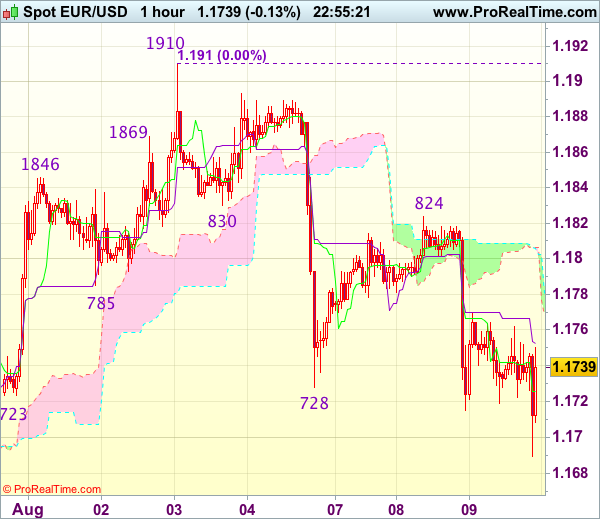
Trade Idea Wrap-up: EUR/USD – Hold short entered at 1.1770
EUR/USD - 1.1739
Most recent candlesticks pattern : N/A
Trend : Near term up
Tenkan-Sen level : 1.1726
Kijun-Sen level : 1.1751
Ichimoku cloud top : 1.1806
Ichimoku cloud bottom : 1.1803
Original strategy :
Sold at 1.1770, Target: 1.1670, Stop: 1.1770
Position : - Short at 1.1770
Target : - 1.1670
Stop : - 1.1770
New strategy :
Hold short entered at 1.1770, Target: 1.1670, Stop: 1.1770
Position : - Short at 1.1770
Target : - 1.1670
Stop : - 1.1770
As the single currency met renewed selling interest at 1.1824 yesterday and dropped again, adding credence to our view that the decline from 1.1910 top is still in progress and downside bias remains for this move to bring retracement of early upmove, hence further weakness to 1.0670 would be seen but reckon support at 1.1650 would remain intact due to oversold condition.
In view of this, we are holding on to our short position entered at 1.1770. Above 1.1800-05 would risk another test of 1.1824-30 resistance but only break there would signal the erratic fall from 1.1910 has ended, bring further gain to 1.1855-60 first.
Trade Idea Wrap-up: USD/JPY – Stand aside
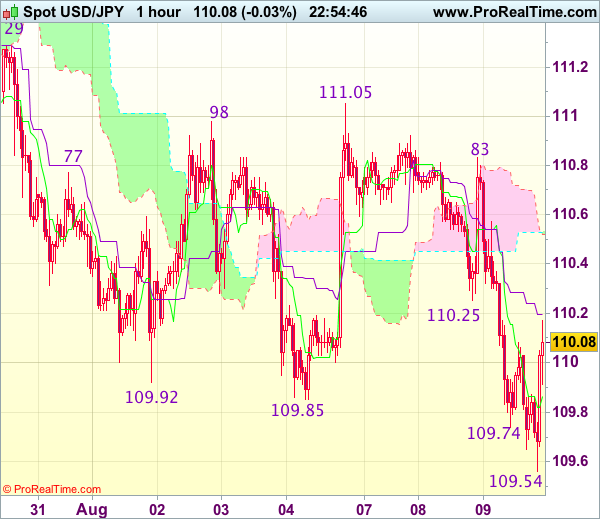
USD/JPY - 110.10
Most recent candlesticks pattern : N/A
Trend : Near term down
Tenkan-Sen level : 109.87
Kijun-Sen level : 110.20
Ichimoku cloud top : 110.53
Ichimoku cloud bottom : 110.52
New strategy :
Stand aside
Position : -
Target : -
Stop : -
Although the greenback fell to as low as 109.54, lack of follow through selling and the subsequent rebound suggest consolidation would be seen and test of previous support at 110.25 cannot be ruled out, however, break there is needed to signal low has been formed, bring a stronger rebound to 110.55-60 but reckon upside would be limited to resistance t 110.83 and price should falter below 111.05 (last week’s high).
On the downside, below said support at 109.54 would signal recent decline has once again resumed and extend weakness to 109.20-25, having said that, loss of near term downward momentum should prevent sharp fall below there and price should stay above 109.00. As near term outlook is mixed, would be prudent to stand aside for now.