Sample Category Title
Risks to the U.S. Economic Outlook from Foreign Trade
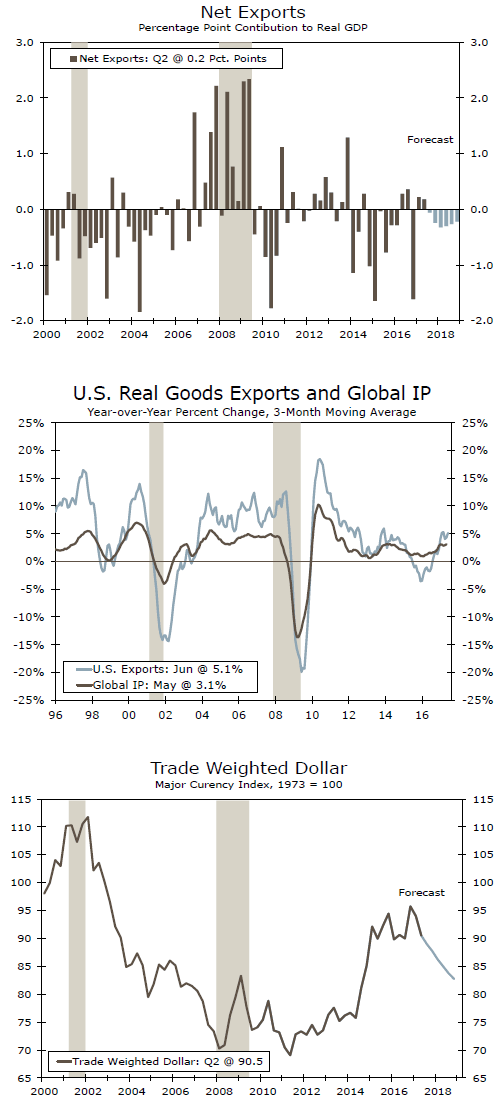
We forecast that real net exports will exert a modest drag on U.S. real GDP growth in coming quarters. Foreign economic growth that is stronger than expected would lessen the drag from the external sector.
Net Exports Likely Will Exert Modest Drag on U.S. GDP Growth
As shown in the top chart, real net exports can have a volatile effect on U.S. real GDP growth on a quarter-by-quarter basis. That said, net exports have generally exerted a modest drag on overall GDP growth since the Great Recession ended in 2009. Looking forward, we forecast that real net exports will slice 0.2 to 0.3 percentage points from overall GDP growth through the end of 2018. Could net exports actually be accretive to GDP growth over our forecast horizon?
Net exports are simply the difference between exports and imports. So a decline in imports would boost real GDP, everything else equal. But an outright decline in imports is usually associated with recession. That is, reductions in domestic demand (consumer, fixed investment and government spending) pull down imports as well. But the decline in imports generally provides some offset on GDP growth from the drop in domestic demand. But falling imports usually do not prevent overall GDP from contracting when recessionary shocks hit the economy.
Export Growth Depends Largely on Foreign Economic Growth
A more benign way to realize stronger GDP growth from the external sector is via exports. So could exports actually grow strongly enough to deliver a positive boost to U.S. real GDP growth from overall net exports? As shown in the middle chart, U.S. export growth and the rate of economic growth in the rest of the world have a high degree of correlation. At present, exports are growing at roughly 5 percent on a year-ago basis and growth in global industrial production is clipping along at approximately 3 percent. In order for export growth to strengthen significantly, global economic activity would need to accelerate even further. Although we look for global growth to strengthen somewhat in coming quarters, a return to the 5 percent growth rates that characterized the middle years of the past decade seem to be a tall order.
Could a weaker dollar help to boost growth in American exports? Since the beginning of the year, the U.S. dollar has depreciated about 7 percent on a broad trade-weighted basis and our currency strategy team looks for further weakness in the greenback on a trend basis (bottom chart). However, the statistical analysis that we and other analysts have conducted over the years shows that the sensitivity of American export growth to changes in the value of the dollar is much lower than it is to changes in global economic growth. So, a dollar that is weaker than our current forecast would impart some upside potential to U.S. export growth, but it likely would not be a "silver bullet" either in terms of strong export growth.
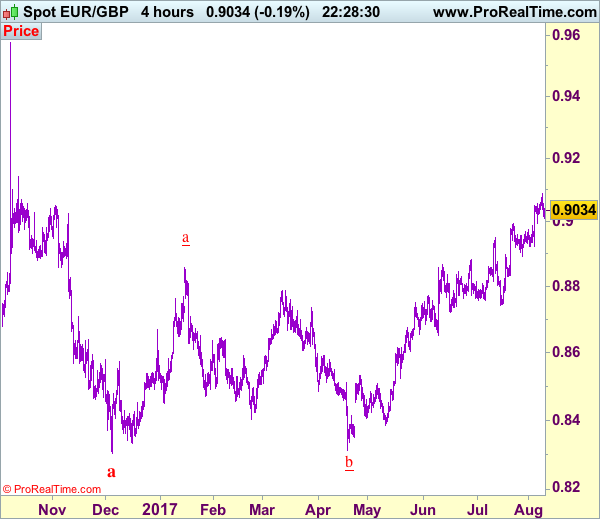
Trade Idea: EUR/GBP – Hold short entered at 0.9080
EUR/GBP - 0.9035
Recent wave: Major double three (A)-(B)-(C)-(X)-(A)-(B)-(C) is unfolding and 2nd (A) has possibly ended at 0.6936.
Trend: Near term up
Original strategy :
Sold at 0.9080, Target: 0.8980, Stop: 0.9100
Position : - Short at 0.9080
Target : - 0.8980
Stop : - 0.9100
New strategy :
Hold short entered at 0.9080, Target: 0.8980, Stop: 0.9080
Position : - Short at 0.9080
Target : - 0.8980
Stop : - 0.9080
As the single currency has retreated after rising to 0.9088 yesterday, retaining our view that consolidation below this level would be seen and mild downside bias remains for test of indicated support at 0.8995, break there would suggest top is possibly formed there, then weakness to 0.8965-70 would follow but below 0.8945-50 is needed to add credence to this view, bring retracement of recent upmove towards support at 0.8922.
In view of this, we are holding on to our short position entered at 0.9080. Above said resistance at 0.9088 would risk gain to 0.9145-50, however, still reckon sharp move beyond there should not be repeated and upside should be limited to 0.9175-80, price should falter below 0.9100, bring correction later.
Our preferred count is that, after forming a major top at 0.9805 (wave V), (A)-(B)-(C) correction is unfolding with (A) leg ended at 0.8400 (A: 0.8637, B: 0.9491 and 5-waver C ended at 0.8400. Wave (B) has ended at 0.9413 and impulsive wave (C) has either ended at 0.8067 or may extend one more fall to 0.8000 before prospect of another rally. Current breach of indicated resistance at 0.9043 confirms our view that the (C) leg has ended and bring stronger rebound towards 0.9150/54, then towards 0.9240/50.
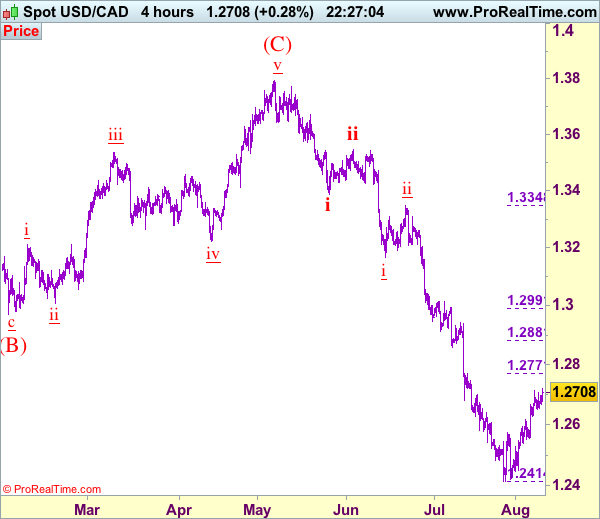
Trade Idea: USD/CAD – Sell at 1.2770
USD/CAD - 1.2703
Recent wave: Only wave v of c has ended at 0.9407 and wave C of major A-B-C correction is underway with wave iii ended at 1.4690, wave v of C may bring one more marginal rise probably in 2018
Trend: Down
Original strategy :
Sell at 1.2770, Target: 1.2570, Stop: 1.2830
Position: -
Target: -
Stop: -
New strategy :
Sell at 1.2770, Target: 1.2570, Stop: 1.2830
Position: -
Target: -
Stop:-
Although the greenback has continued trading with a firm bias and near term upside risk remains for the rebound from 1.2414 (wave iii trough) to bring correction of recent decline in wave iv to1.2745-50, reckon upside would be limited to 1.2771 (previous resistance as well as 38.2% Fibonacci retracement of wave iii) and bring retreat later, below 1.2625-30 would bring test of 1.2540-50, break there would suggest the rebound from 1.2414 has ended instead, bring further fall to 1.2490-00 but reckon support at 1.2451 would hold on first testing. We are keeping our count that wave v as well as wave (C) ended at 1.3794 and impulsive wave (i ii, i ii) is now unfolding with minor wave iii possibly ended at 1.2414, hence wave iv correction is underway.
In view of this, would be prudent to stand aside for now and look to sell on further subsequent rebound as 1.2771 resistance should limit upside. Above 1.2800-10 would defer and risk a stronger correction to 1.2850, however, still reckon upside would be limited to 1.2880-85 (50% Fibonacci retracement of wave iii) and bring retreat later next week.
To recap, wave B from 1.3066 is unfolding as an a-b-c and is sub-divided as a: 1.2192, b: 1.2716 and wave c is a 5-waver with i: 1.1983, ii: 1.2506, extended wave iii with minor iii at 1.0206, wave iv ended at 1.0781 and wave v as well as wave iii has ended at 0.9931, hence the subsequent choppy trading is the wave iv which is unfolding as (a)-(b)-(c) with (a) leg of iv ended at 1.0854, followed by (b) leg at 1.0108 and (c) leg as well as the wave iv ended at 1.0674. The wave v is sub-divided by minor wave (i): 0.9980, (ii): 1.0374, (iii): 0.9446, (iv): 0.9913 and (v) as well as v has possibly ended at 0.9407, therefore, consolidation with upside bias is seen for major correction, indicated target at 1.3700 and 1.4000 had been met and further gain to 1.4700 would be seen later.
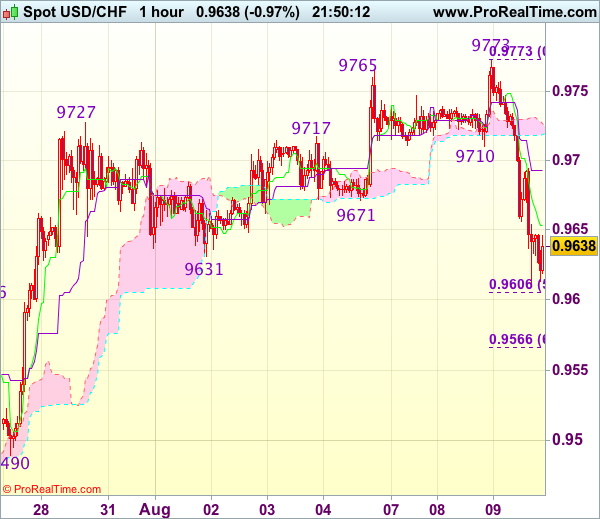
Trade Idea Update: USD/CHF – Sell at 0.9725
USD/CHF - 0.9645
Original strategy :
Sell at 0.9725, Target: 0.9625, Stop: 0.9760
Position : -
Target : -
Stop : -
New strategy :
Sell at 0.9725, Target: 0.9625, Stop: 0.9760
Position : -
Target : -
Stop : -
Although the greenback extended recent rise from 0.9438 to 0.9772, lack of follow through buying on break of previous resistance at 0.9765 and the subsequent selloff below support at 0.9631 add credence to our view that top has been formed at 0.9773, hence consolidation with downside bias remains for further fall to 0.9605-10 (50% Fibonacci retracement of 0.9438-0.9773), however, near term oversold condition should limit downside to 0.9580 and reckon 0.9665 (61.8% Fibonacci retracement) would hold from here.
In view of this, we are looking to sell dollar on recovery as 0.9725-30 should limit upside. Only break of yesterday’s high at 0.9773 would abort and revive bullishness for the rise from 0.9438 to extend gain to 0.9800-10.
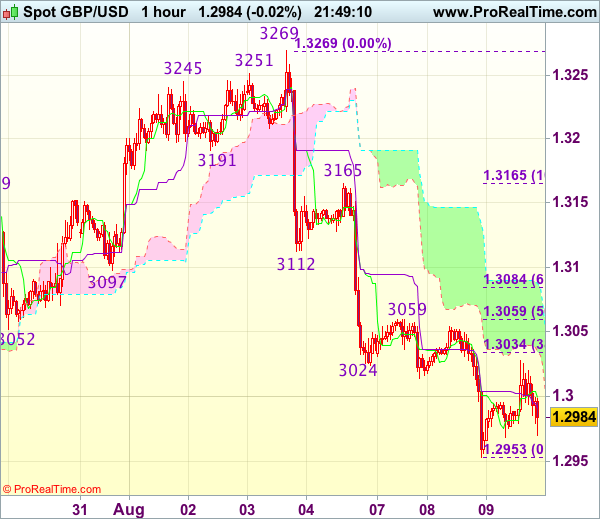
Trade Idea Update: GBP/USD – Hold long entered at 1.3000
GBP/USD - 1.2981
Original strategy :
Bought at 1.3000, Target: 1.3100, Stop: 1.2965
Position : - Long at 1.3000
Target : - 1.3100
Stop : - 1.2965
New strategy :
Hold long entered at 1.3000, Target: 1.3100, Stop: 1.2965
Position : - Long at 1.3000
Target : - 1.3100
Stop : - 1.2965
Although cable slipped to 1.2953 yesterday, the subsequent rebound suggests consolidation above this level would be seen and gain to 1.3059 resistance is likely, however, break there is needed to signal low is possibly formed, bring test of 1.3080-85 (61.8% Fibonacci retracement of 1.3165-1.2953), break there would add credence to this view, bring a stronger rebound to 1.3110-20 but resistance at 1.3165 should remain intact.
In view of this, we are holding on to our long position entered at 1.3000. Below 1.2965-70 would signal decline has resumed and extend the fall from 1.3269 top towards previous chart support at 1.2933 but reckon 1.2900 would hold from here, risk from there has increased for a rebound to take place later.
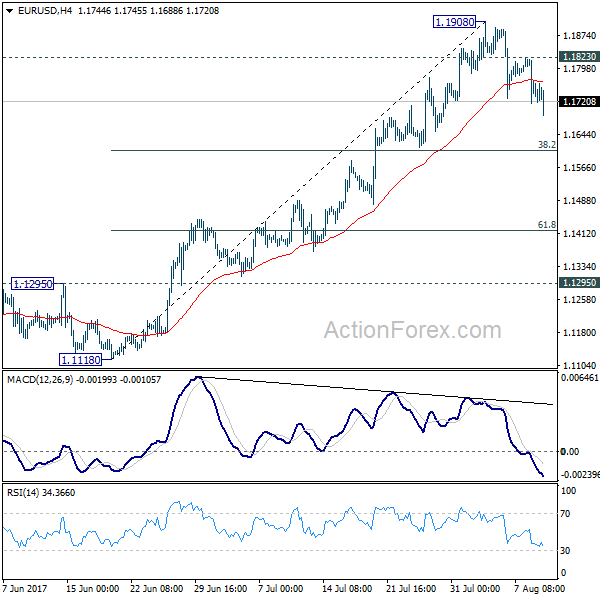
EUR/USD Mid-Day Outlook
Daily Pivots: (S1) 1.1703; (P) 1.1763 (R1) 1.1813; More...
Intraday bias in EUR/USD remains on the downside as pull back from 1.1908 short term top is in progress. At this point, we'd expect strong support from 38.2% retracement of 1.1119 to 1.1908 at 1.1606 to bring rebound. But break of 1.1908 is needed to confirm up trend resumption. Otherwise, more consolidation would be seen in near term. Meanwhile, sustained break of 1.1606 would bring deeper pull back to 61.8% retracement at 1.1420.
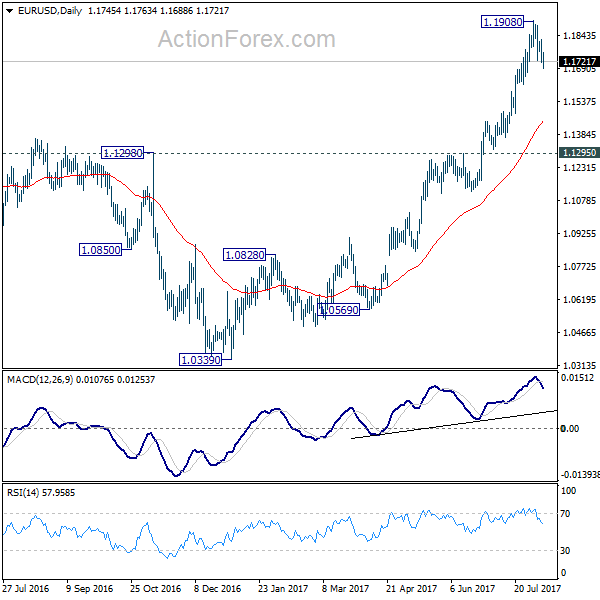
In the bigger picture, an important bottom was formed at 1.0339 on bullish convergence condition in weekly MACD. Sustained break of 55 month EMA (now at 1.1760) will pave the way to key fibonacci level at 38.2% retracement of 1.6039 (2008 high) to 1.0339 (2017 low) at 1.2516. While rise from 1.0339 is strong, there is no confirmation that it's developing into a long term up trend yet. Hence, we'll be cautious on strong resistance from 1.2516 to limit upside. But for now, medium term outlook will remain bullish as long as 1.1295 support holds, in case of pull back.
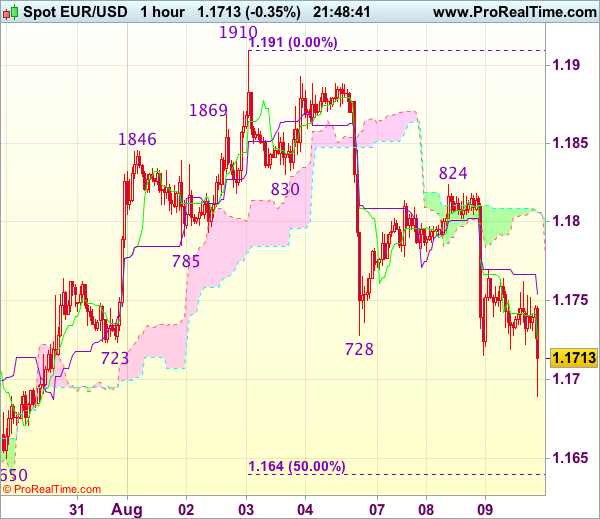
Trade Idea Update: EUR/USD – Hold short entered at 1.1770
EUR/USD - 1.1713
Original strategy :
Sold at 1.1770, Target: 1.1670, Stop: 1.1805
Position : - Short at 1.1770
Target : - 1.1670
Stop : - 1.1805
New strategy :
Hold short entered at 1.1770, Target: 1.1670, Stop: 1.1770
Position : - Short at 1.1770
Target : - 1.1670
Stop : - 1.1770
As the single currency met renewed selling interest at 1.1824 yesterday and dropped again, adding credence to our view that the decline from 1.1910 top is still in progress and downside bias remains for this move to bring retracement of early upmove, hence further weakness to 1.0670 would be seen but reckon support at 1.1650 would remain intact due to oversold condition.
In view of this, we are holding on to our short position entered at 1.1770. Above 1.1800-05 would risk another test of 1.1824-30 resistance but only break there would signal the erratic fall from 1.1910 has ended, bring further gain to 1.1855-60 first.
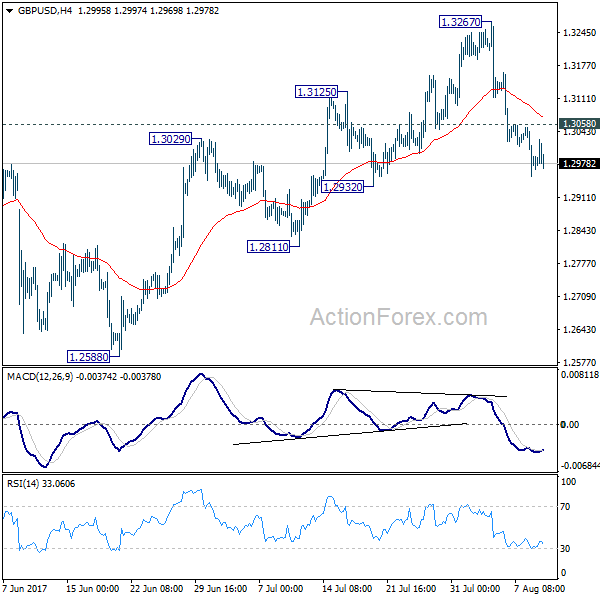
GBP/USD Mid-Day Outlook
Daily Pivots: (S1) 1.2946; (P) 1.2999; (R1) 1.3047; More...
Intraday bias in GBP/USD remains on the downside for 1.2932 support first. Price actions from 1.1946 are seen as a corrective pattern, no change is this view. Such correction could have completed at 1.3267 already. Break of 1.2932 will affirm this bearish case and target 1.2588 key near term support for confirmation. On the upside, however, above 1.3058 minor resistance will turn bias neutral first. But deeper fall is expected as long as 1.3267 resistance holds.
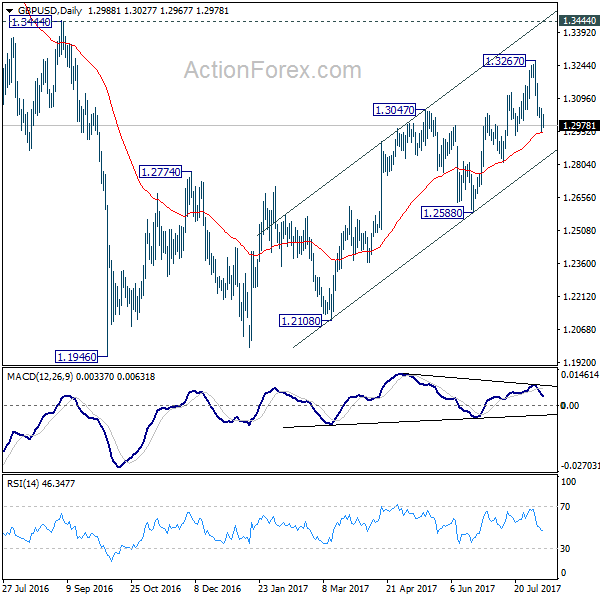
In the bigger picture, overall, price actions from 1.1946 medium term low are seen as a corrective pattern that is still in progress. While further upside is expected, larger outlook remains bearish as long as 1.3444 key resistance holds. Down trend from 1.7190 (2014 high) is expected to resume later after the correction completes. And break of 1.2588 will indicate that such down trend is resuming.
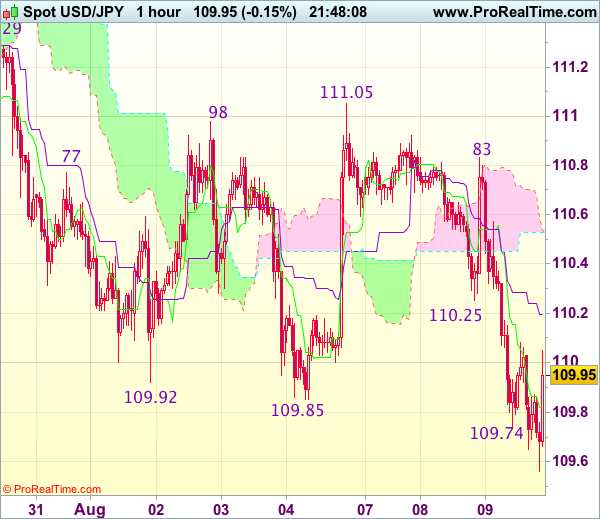
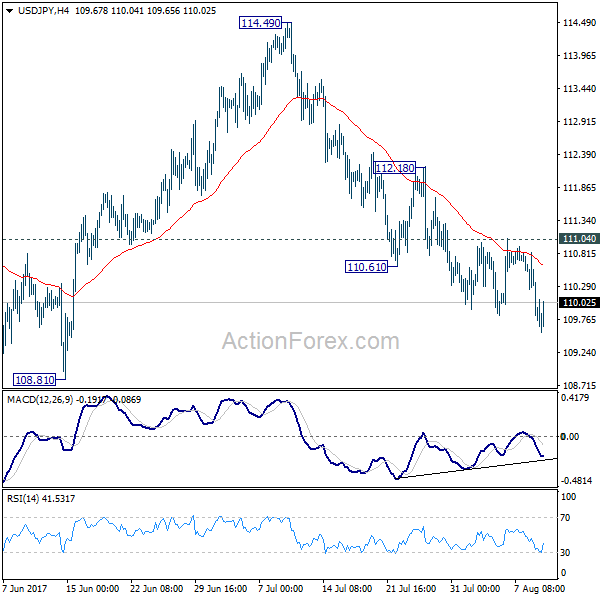
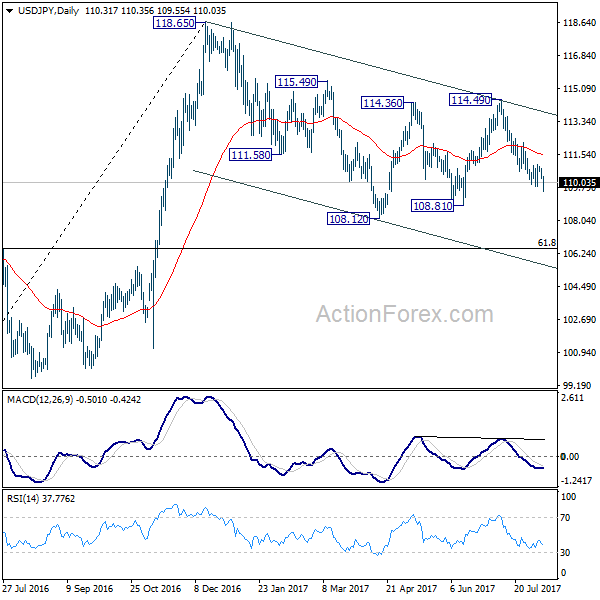
USD/JPY Mid-Day Outlook
Daily Pivots: (S1) 110.11; (P) 110.46; (R1) 110.69; More...
Intraday bias in USD/JPY remain son the downside as fall from 114.49 is still in progress for 108.81 support. Break there will resume whole correction from 118.65 and target 61.8% retracement of 98.97 to 118.65 at 106.48. On the upside, break of 111.04 resistance is needed to indicate short term bottoming. Otherwise, outlook will stay bearish in case of recovery.
In the bigger picture, the corrective structure of the fall from 118.65 suggests that rise from 98.97 is not completed yet. Break of 118.65 will target a test on 125.85 high. At this point, it's uncertain whether rise from 98.97 is resuming the long term up trend from 75.56, or it's a leg in the consolidation from 125.85. Hence, we'll be cautious on topping as it approaches 125.85. If fall from 118.65 extends lower, down side should be contained by 61.8% retracement of 98.97 to 118.65 at 106.48 and bring rebound.
Trade Idea Update: USD/JPY – Stand aside
USD/JPY - 110.00
New strategy :
Stand aside
Position : -
Target : -
Stop : -
Although the greenback fell to as low as 109.54, lack of follow through selling and the subsequent rebound suggest consolidation would be seen and test of previous support at 110.25 cannot be ruled out, however, break there is needed to signal low has been formed, bring a stronger rebound to 110.55-60 but reckon upside would be limited to resistance at 110.83 and price should falter below 111.05 (last week’s high).
On the downside, below said support at 109.54 would signal recent decline has once again resumed and extend weakness to 109.20-25, having said that, loss of near term downward momentum should prevent sharp fall below there and price should stay above 109.00. As near term outlook is mixed, would be prudent to stand aside for now.