Sample Category Title
Gold And USD Turn Higher After Trump’s North Korea Statement
Gold Remains Sensitive to U.S. dollar strengthening. After falling to a nearly two-week low on Tuesday gold prices turned higher after unease over North Korea, reversing the downward move after the jobs data pushed the dollar away of its 13-mnt low. While the U.S. dollar remains a headwind for gold, gold is seeing less pressure from bond markets. U.S. 10-year bond yields remain relatively low last trading at 2.28%. Gold as a non-yield asset is sensitive to higher interest rates.
U.S. Dollar Holds Gains. The dollar pared gains slightly after Trump's North Korea comments, still supported by the job market data which underscored the view that the Federal Reserve has ammunition to continue on its tighter monetary policy path. A strong jobs report last Friday gave the dollar index its strongest daily performance this year. The job data were the latest metric to highlight tightening labor market conditions in the U.S. and to that extent that's a dollar-positive data.
Oil prices settled lower after OPEC meeting. After the news on increasing exports from key OPEC producers and lower crude shipments from Saudi Arabia oil traded much lower. After U.S. inventories fell more than expected last week crude briefly pared losses in late trading. U.S. crude fell 0.55 percent to $49.12 per barrel and Brent was last at $52.03, down 0.65 percent on the day.
Risk Aversion Seen As US, North Korean Tensions Escalate
- Gold, yen and Swiss franc benefit from safe haven flows;
- Will EIA data be the trigger for further gains in oil after API report large drawdown;
- US productivity and labour costs of interest ahead of Friday's inflation report.
We're seeing significant risk aversion in the markets on Wednesday, with the escalation in tensions between the US and North Korea triggering moves into safe haven assets.
Equity markets in Europe are down more than 1% in most cases and Wall Street is also facing a negative open, as investors turn away from perceived riskier instruments in favour of the traditional safe havens. Gold – the ultimate safe haven instrument – is up around 0.6% so far on the day and could extend these gains if investor sentiment continues to deteriorate.
The yen, despite Japan being in the thick of it, is also seeing plenty of safe haven flows although it's the Swiss Franc which is proving to be the biggest winner in all of this, trading around 1% higher against the US dollar, euro and pound. It will be interesting to see if the yen maintains its safe haven status should this continue to escalate into something far more serious than just the war of words it currently is.
Oil is trading a little higher again on the day, possibly spurred on a little by the latest verbal sparring between Donald Trump and North Korea. Still, it continues to trade a little off the highs of the last week or so, with $53 still proving a strong barrier to the upside in Brent and $50 doing likewise in WTI. EIA may provide the necessary catalyst for a test of this later on in the day, especially if we see a number in line with last night's API report.
US data is looking a little light once again, although as we saw on Tuesday, even numbers that aren't typically associated with big market moves can take their toll. The JOLTS number further highlighted the diminishing slack in the US labour market that should drive higher wages in the not too distant future, although it's worth noting that this is something the Fed has been expecting for some time as the unemployment number has continued to decline. Today's numbers from the US come in the form of non-farm productivity and unit labour costs, both of which should theoretically, at least, be a key indicator of future wage and inflation trend. More good numbers here could trigger similar moves to those we saw yesterday, particularly with the dollar continuing to look very oversold.
UK Inflation Report Hearing Highlight Slow Day In Finance
The United Kingdom's Inflation Report Hearings headline a slow day in the global financial markets on Wednesday, giving investors more time to dissect quarterly earnings and geopolitical developments from around the world.
The UK's Treasury Committee will examine expenditure, administration, and policy at the upcoming Inflation Report Hearings, which are scheduled to begin at 10:00 GMT. Inflation is a highly contentious topic following Brexit, with the Bank of England (BOE) signaling its preparedness to overshoot its price target in support of faster economic growth.
Just last week, the BOE's Monetary Policy Committee kept interest rates at rock bottom in a 6-2 vote.
Elsewhere in Europe, Greece is scheduled to report on consumer inflation on Wednesday. Italy also plans to release its latest industrial production figures and Portugal will also report on global trade and unemployment.
Shifting gears to North America, Statistics Canada will release its latest report on housing starts and building permits. Starts are forecast to decline in year-over-year terms. Permits – a bellwether of future construction plans – are also forecast to drop.
In terms of US data, the Commerce Department will release wholesale inventories for the month of June. Oil traders will also monitor the weekly crude inventory report courtesy of the US Energy Information Administration (EIA).
Chinese economic data also made headlines on Wednesday after the National Bureau of Statistics reported on inflation. China's consumer price index (CPI) rose 1.4% annually in July, compared with 1.5% the previous month. The producer price index (PPI) rose 5.5% annually, unchanged from the previous month.
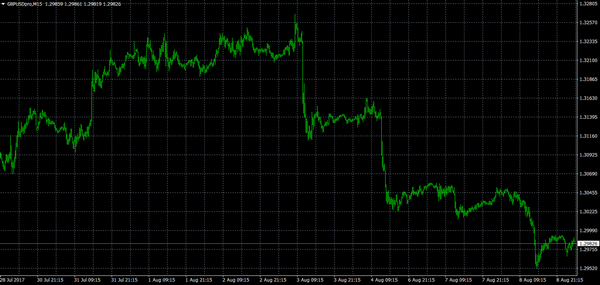
GBP/USD
The British pound has declined sharply over the past four sessions, as investors reduced their bullish bets following the Bank of England's policy decision. The GBP/USD exchange rate fell below 1.3000 in overnight trading. With the pair breaking the critical 1.3000 support, further volatility may be in store. Immediate support is located at 1.2965. Resistance is found just up ahead a t 1.3005.
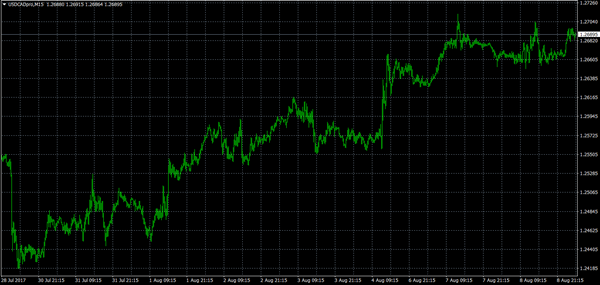
USD/CAD
After soaring to multiyear highs last month, the Canadian dollar has been on a slow, steady decline. The USD/CAD is currently trading at three-week highs and appears poised to continue higher in the short term. Immediate resistance sits at 1.2714. On the opposite side of the ledger, support is located at 1.2622. The USD/CAD was last up 0.2% at 1.2688.
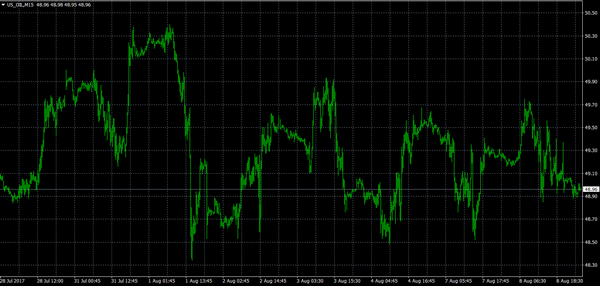
WTI OIL
Crude prices continued lower on Tuesday in choppy trading as Saudi Arabia lowered its September crude supplies. However, investors continue to await news on Libya and Venezuela – two OPEC members that hold considerable sway over the market's short-term supply/demand imbalance. At the time of writing, US West Texas Intermediate (WTI) futures were down 0.3%. Prices remain firmly capped below the psychological $50 barrier.
EUR/CHF Elliott Wave Analysis
EUR/CHF : 1.1327
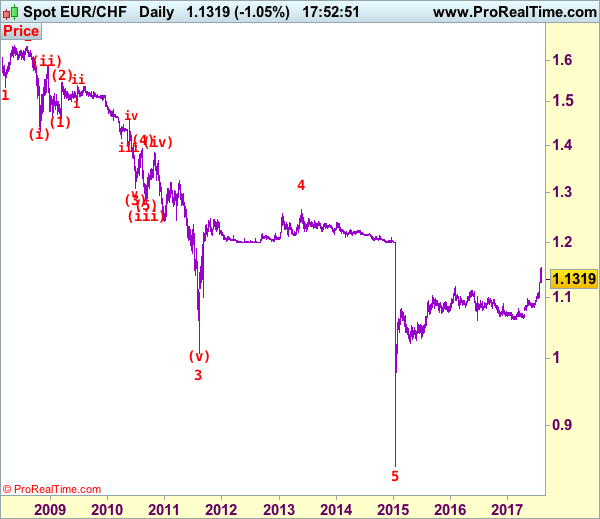
EUR/CHF: Major wave 5 trough ended at 0.8426 and correction has commenced from there for subsequent gain towards 1.1400-1.1500.
Although the single currency extended recent rally to 1.1538 late last week, the subsequent sharp retreat suggests a minor wave iii has ended there, hence 1-2 weeks of consolidation below this level would take place in some form of wave iv, hence mild downside bias is for correction to 1.1250, however, reckon downside would be limited to 1.1185-90 (50% Fibonacci retracement of 1.0833-1.1538) and bring rebound later (tentatively minor b leg of wave iv) back to 1.1400, however, price should falter well below 1.1538 wave iii top, bring another corrective decline in c leg of wave iv later this month.
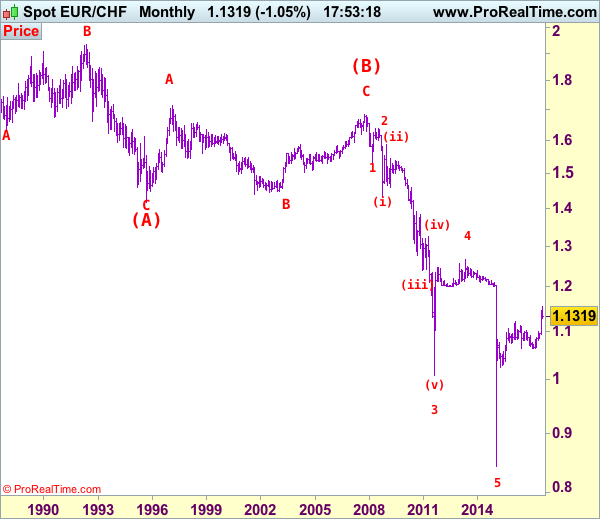
To recap our preferred count, the decline from 1.6828 (end wave (B)) is labeled as the beginning of wave (C) which should unfold as an impulsive move with 1: 1.5326, 2: 1.6377 and wave 3 is sub-divided into (i): 1.4300, (ii): 1.5880 and wave (iii) is still unfolding with (1): 1.4577, (2): 1.5448 and wave (3) is an extended 3rd with i: 1.5006, ii: 1.5383, wave iii: 1.3073, then wave iv ended at 1.3925 and wave v at 1.3073, wave (4) ended at 1.3925 and wave (5) has ended at 1.2765 which also marked the low of wave (iii) and wave (iv) has ended at 1.3835 and wave (v) as well as larger degree wave 3 has ended at 1.0075. The selloff from 1.2650 signals wave 4 has ended there and we are taking a view that the wave 5 could also have ended 0.8426, hence consolidation is seen with mild upside bias for rebound to 1.1000 first (already met), then towards 1.1400.
On the downside, whilst initial corrective fall to 1.1185-90 is likely, reckon downside would be limited and euro should stay well above 1.1100-05 (61.8% Fibonacci retracement of 1.0833-1.1538), bring upmove in wave v later (probably in late Q3). Only a drop below previous resistance at 1.0988 (wave i top) would abort and signal recent upmove has ended, bring correction to 1.0950, then 1.0900 but support at 1.0833 should remain intact.
Recommendation: Buy again at 1.1200 for 1.1400 with stop below 1.1100.
The long-term downtrend started from 1.9626 (Apr 1985) to 1.4166 (Sep 1995) is treated as wave (A) with A:1.6285 (Dec 1987), B: 1.9342 (May 1992) and C: 1.4166, then wave (B) ended at 1.6828 with A: 1.7147 (Feb 1997), B: 1.4398 (Sep 2001), C: 1.6828 (Nov 2007), therefore, wave (C) is now in progress with the breakdown indicated as above. This wave (C) already met indicated downside target at 1.1455/60 and 1.1300, it could have ended at 0.8426, consolidation with mild upside bias is seen for gain to 1.1000 and later towards 1.2000.
CRUDE OIL Ready To Push Higher
Crude Oil is trading higher. Hourly support is given at 47.86 (26/07/2017 low). Strong resistance can be found at 50.41 (31/07/2017). Expected to monitor resistance at 50.41 (31/07/2017 high).
In the long-term, crude oil has recovered after its sharp decline last year. However, we consider that further weakness are very likely. Strong support lies at 35.24 (05/04/2016) while resistance can now be found at 55.24 (03/01/2017 high).
SILVER Bouncing Back
Silver's bullish pressures are back. Hourly resistance lies at 16.94 (02/08/2017 high). The commodity has set up a new support 16.13 (07/08/2017 high). Expected to edge higher.
In the long-term, the death cross indicates that further downsides are very likely. Resistance is located at 25.11 (28/08/2013 high). Strong support can be found at 11.75 (20/04/2009).
GOLD Trading Sideways
Gold is consolidating. Hourly support is given at 1251 (08/08/2017 low). Strong support is given at 1204 (10/07/2017 high). Hourly resistance is given at 1274 (01/08/2017 high). Expected to see further consolidation.
In the long-term, the technical structure suggests that there is a growing upside momentum. A break of 1392 (17/03/2014) is necessary ton confirm it, A major support can be found at 1045 (05/02/2010 low)
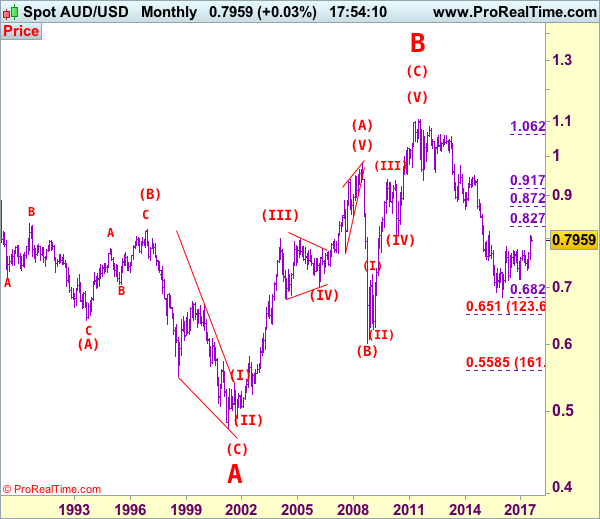
AUD/USD Elliott Wave Analysis
AUD/USD – 0.7888
AUD/USD – Wave 5 of C and (B) has possibly ended at 1.1081
Aussie has retreated again after faltering below resistance at 0.8066, retaining our view that further consolidation below this level would be seen and initial downside risk remains for pullback to 0.7815-20 (50% Fibonacci retracement of 0.7571-0.8066), however, reckon downside would be limited to 0.7800 and bring another rise later, above 0.7980 would signal the retreat form 0.8066 has ended, bring test of 0.8000, then towards said resistance, once this level is penetrated, this would extend medium term erratic rise from 0.6827 (2016 low) for retracement of early downtrend to 0.8100, then towards previous resistance at 0.8163.
We are keeping our count that top has been formed at 1.1081 (wave 5 of V) and major correction (A-B-C-X-A-B-C) has commenced, indicated downside targets at 0.7945 (61.8% Fibonacci retracement of entire rise from 0.6007-1.1081) and 0.7750 had been met and downside bias is seen for further weakness to 0.6800, then 0.6700 but reckon 0.6500 would hold from here.
Our preferred count is that the rally from 0.6007 to 0.7270 (7 Jan 2009) is marked as wave A, the retreat to 0.6248 (2 Feb 2009) is wave B and the subsequent upmove is labeled as wave C with wave (iii) and wave (iv) ended at 0.8265 and 0.7700 respectively and wave (v) as well as 3 ended at 0.9407, then wave 4 ended at 0.8066 (instead of 0.8578). The wave 5 has met our indicated projection target of 1.1060 and could ended at 1.1081, this level is now treated as the peak of wave (C) as well as larger degree wave B, hence major fall in wave C has commenced, our initial downside target at psychological support at 0.7000 has just been met and further weakness to 0.6500 would be seen later.
On the downside, whilst initial pullback to 0.7815-20 cannot be ruled out, reckon 0.7800 would limit downside and bring another rise later. Below 0.7760 (61.8% Fibonacci retracement of 0.7571-0.8066) would defer and suggest a temporary top is possibly formed, bring test of previous resistance at 0.7712 but only break there would provide confirmation, bring retracement of recent rise to 0.7650 first.
Recommendation: Buy at 0.7800 for 0.8000 with stop below 0.7700.

Our alternate count on the daily chart treated the top formed in 2008 at 0.9851 could be a larger degree wave I and was followed by a deep and sharp correction in wave II to 0.6007 and wave III is unfolding from there.
The long-term uptrend started from 0.4775 (2 Apr 2001) with an impulsive structure. Wave I is labeled as 0.4775 to 0.9851 (15 Jul 2008), wave II has ended at 0.6007 (Oct 2008) and wave III is still in progress which may extend further gain to 1.1265.
BITCOIN Stalling Below $3500
Bitcoin keeps on surging. Hourly resistance is given at 3478 (08/08/2017 high) and hourly support lies very far at 2403 (26/07/2017 low). The road is wide open for another bullish move.
In the long-term, the digital currency has had an exponential growth. There are decent likelihood that the asset will consolidate above $1500. Long-term support is given at $1464 (04/05/2017 low).
EUR/CHF Starting To Reverse
EUR/CHF has consolidated and short-term buying pressures are definitely back on . Hourly support located at 1.1412 (04/08/2017 low) has been broken. Expected to show continued weakness.
In the longer term, the technical structure has reversed. Strong resistance at 1.1200 (04/02/2015 high) has been broken. Yet,the ECB's QE programme is likely to cause persistent selling pressures on the euro, which should weigh on EUR/CHF. Supports can be found at 1.0184 (28/01/2015 low) and 1.0082 (27/01/2015 low)