

Sample Category Title
EUR/USD Analysis: Move Into Critical Zone
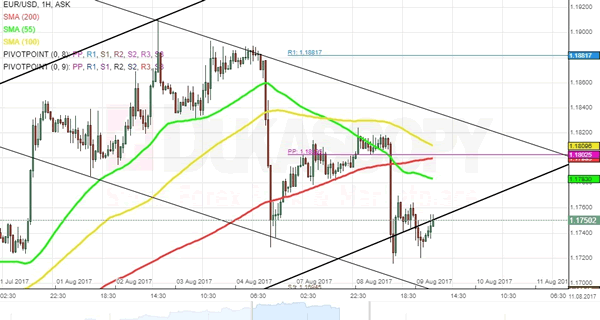
The common European currency depreciated against the US Dollar earlier than expected. The currency exchange rate was about to approach the resistance of the 100-hour SMA just above the 1.1820 mark when it suddenly dropped. The reason for the sudden plummeting of the currency exchange rate was the release of the almost never financial markets impacting JOLTS Job Openings. The published data was so much higher than the initially forecasted that the US Dollar skyrocketed all across the boards. For the EUR/USD pair that resulted in the rate reaching the zone near the lower trend line of the long term ascending channel pattern near the 1.1750 mark. It still has to be seen, whether a surge reoccurs or a decline of the pair continues. Clues for that might be on the longer term charts.
GBP/USD Analysis: Finds Support Near 1.2960
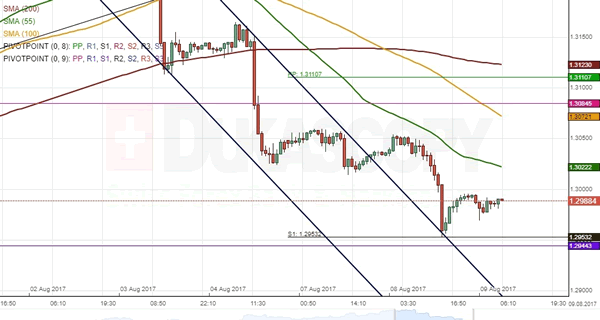
After breaching the senior channel down on Monday, the Pound managed to retrace from its upper boundary the following day. The rate found support at a support cluster formed by the weekly and monthly S1s circa 1.2950 and has since edged higher just to reach the 1.30 mark. The strong down-trend that guided the price last week has allayed, suggesting that the Pound may eventually appreciate against the US Dollar in this session. An immediate resistance is provided by the 55-hour SMA at 1.3025, while a more distant upside target for today is an intersection of the 100-hour SMA and the monthly PP circa 1.3000. In terms of a downside limit, the pair is not expected to go below the monthly and weekly S1s.
USD/JPY Analysis: Pressured By Bears
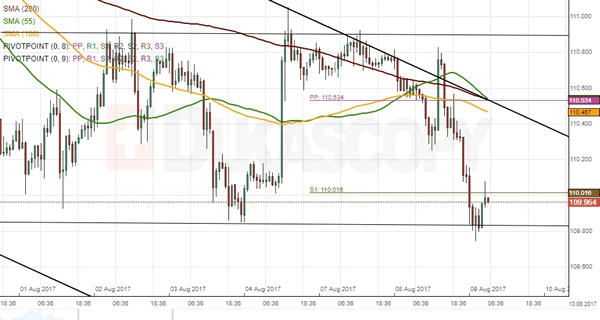
Despite being sticky to the upper boundary of the senior channel down, the USD/JPY exchange rate failed to move past this level (not taking into account the false breakout mid-session). The pair was located near the 55-, 100– and 200-hour SMAs for most of the session. However, the false breakout resulted in the price crossing all the SMAs and the weekly PP from above. The failed attempt to move above the latter pushed the Greenback even lower until its closing price at 110.33. On Wednesday morning, the rate resumed its fall even below the weekly S1, but managed to reverse near the 109.80 mark. It is likely that the rate tries to approach the upper channel boundary once again, thus remaining between the weekly S1 and PP for the whole session. The given level may be reached on Thursday morning.
XAU/USD Analysis: Increases volatility
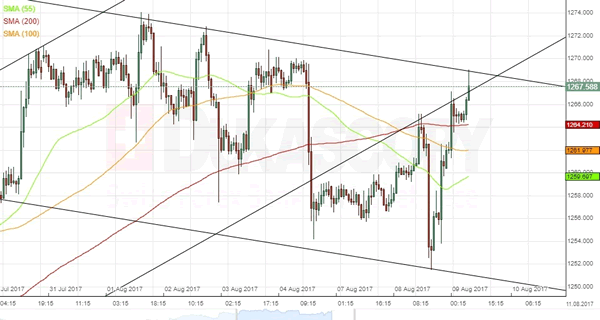
Fundamental changes form the US Dollar side have taken place in the financial markets. As a result, the price of the yellow metal has changed. In general, the JOLTS Job Openings data was released at 14:00 GMT on Tuesday and revealed such a high number, compared to the average market forecast, that the Greenback jumped. Due to that move the pair sort of reached the lower trend line of the recently adjusted descending channel pattern. Afterwards a rebound took place and the metal was already at the upper trend line of the channel down pattern on Wednesday morning. It still had to be seen whether the metal bounces off the resistance and a short term decline begins or the surge continues. The outcome will be possible to forecast as the bullion moves away from the trend line.
AUD/USD: Westpac Consumer Sentiment
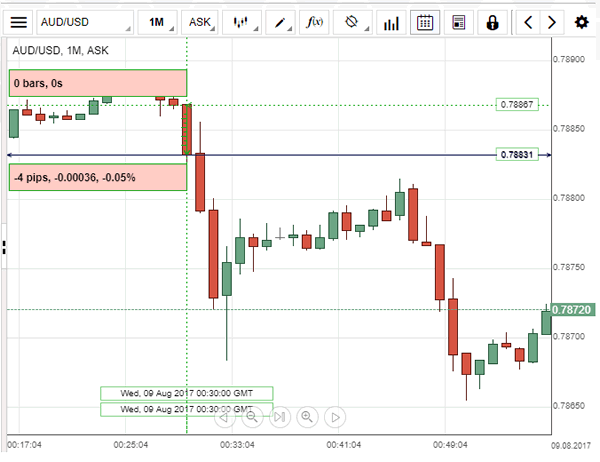
Australian consumer sentiment fell to the weakest level since the Great Financial Crisis in August, contributing to the decline in the AUD/USD currency pair. The Aussie fell against the US Dollar to be traded below the 0.7883 mark on Wednesday's morning. The Westpac-Melbourne Institute revealed that its Consumer Confidence Index dropped 1.2% in August, following a 0.4% increase registered in the prior month. Moreover, consumer sentiment weakened for the third time in the last four months amid higher pressures on households' finances and concerns about interest rate hike. However, Westpac forecasts that the Reserve Bank of Australia would keep rates on hold in 2018, due to expectations for insufficient economic growth and low inflation.
Trade Idea: GBP/USD – Sell at 1.3090
GBP/USD – 1.3040
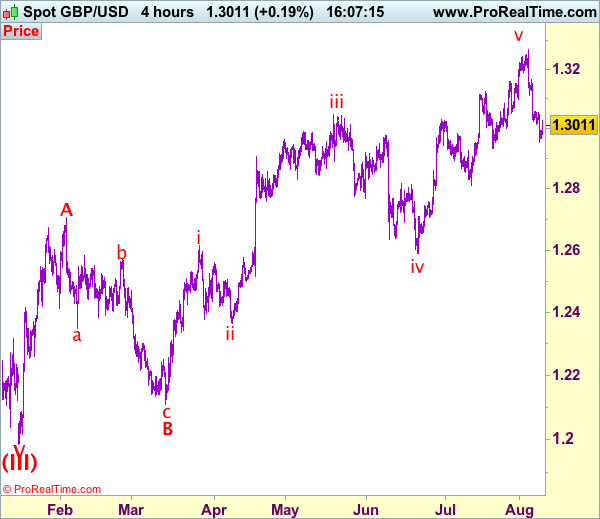
Recent wave: Wave V of larger degree wave (III) has ended at 1.1986 and major correction has commenced from there for gain to 1.3000 and 1.3140-50
Trend: Near term up
Original strategy :
Sell at 1.3150, Target: 1.2980, Stop: 1.3210
Position: -
Target: -
Stop: -
New strategy :
Sell at 1.3090, Target: 1.2890, Stop: 1.3150
Position: -
Target: -
Stop:-
Although cable has recovered after falling to 1.2953 yesterday, suggesting minor consolidation above this level would be seen and recovery to 1.3055-60 cannot be ruled out, however, reckon upside would be limited to 1.3090-00 and bring another decline later, below said support at 1.2953 would extend the fall from 1.3269 top for retracement of recent upmove to previous support at 1.2933, break there would extend weakness to 1.2890-00 before rebound.
In view of this, would be prudent to sell cable on subsequent recovery as previous support at 1.3112 should turn into resistance and cap upside. Only break of indicated resistance at 1.3165 would defer and suggest first leg of decline from 1.3269 has ended instead, risk a strong rebound to 1.3200, however, price should falter well below said resistance and bring another decline later.
Our preferred count on the daily chart is that cable's rebound from 1.3500 (wave (A) trough) is unfolding as a wave (B) with A ended at 1.7043, followed by triangle wave B and wave C as well as wave (B) has ended at 1.7192, the subsequent selloff is the larger degree wave (C) which is still unfolding with minor wave (III) of larger degree wave 3 ended at 1.1986, hence wave (IV) correction is in progress which could either be a triangle wave (IV) of a complex formation but upside should be limited to 1.3500 and price should falter well below 1.4000, bring another decline in wave (V) of 3 for weakness to 1.1500, then 1.1200.
Trade Idea: GBP/JPY – Sell at 143.60
GBP/JPY - 142.80
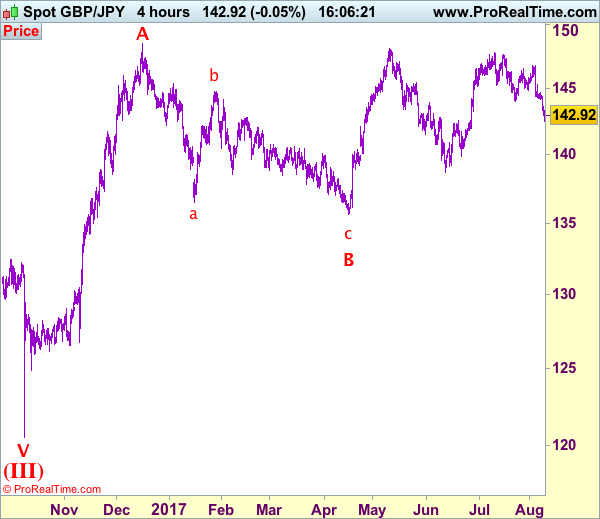
Recent wave: Medium term low formed at 120.50 and (A)-(B)-(C) major correction has commenced with (A) leg ended at 148.45, hence wave (B) is unfolding for retreat to 131.00-10.
Trend: Near term up
Original strategy:
Sell at 145.50, Target: 143.50, Stop: 146.10
Position: -
Target: -
Stop: -
New strategy :
Sell at 143.60, Target: 141.60, Stop: 144.20
Position: -
Target: -
Stop:-
As sterling’s decline has accelerated especially after the break of previous support at 144.05 (now resistance), adding credence to our view that the decline from 147.75 top is still in progress, hence bearishness remains for this decline to extend weakness to 142.00-10, however, near term oversold condition should prevent sharp fall below 141.50 and price should stay above 141.00, bring rebound later.
In view of this, would not chase this fall here and would be prudent to sell sterling on recovery as 143.50-60 should limit upside and bring another decline later. Above previous support at 144.05 would defer and suggest a temporary low is formed instead, risk a stronger rebound to 144.40-50 but price should falter below resistance at 145.30, bring another decline later.
Our preferred count is that larger degree wave V with circle is unfolding from 251.12 with wave (I) 219.34, (II): 241.38 and wave (III) is subdivided into 1: 192.60, 2: 215.89 (23 Jul 2008) and wave 3 ended at 118.87 earlier in 2009. The correction from there to 162.60 is wave 4 which itself is a double three and is labeled as first a-b-c ended at 151.53, followed by wave x at 139.03, 2nd a ended at 162.60, 2nd b at 146.75 and 2nd c leg of wave 4 ended at 163.00. Therefore, the decline from 163.00 to 116.85 is now treated as wave 5 which also marked the end of larger degree wave (III), hence wave (IV) major correction has commenced for retracement of the wave (III) from 241.38 and upside target at 183.95-00 (50% Fibonacci retracement of the wave (II) from 241.38) had been met, a drop below 160.00 would suggest wave (IV) has ended at 195.85, bring decline in wave (V) for initial weakness to 130 (already met) and 120.
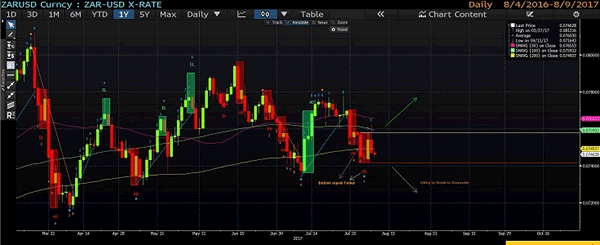
Trump Triggered Text Book Trade | Aussie Under Trouble After Consumer Data
'Fire & Fury' Faces Risk-Off
Aussie Lost Its Momentum
RAND Sell-Off Continues
'Fire & Fury' Faces Risk-Off
The geopolitical tensions have prompted a risk-off trade amid investors. President Trump's comments about North Korea have created nervousness and the fear is if the president really means what he said 'fire and fury'. The typical text book trade is that investors rush for the safe haven hence we have experienced a bounce for the gold price. A couple of days ago, we did mention that the gold price could also stem its losses if the tensions escalate around North Korea.
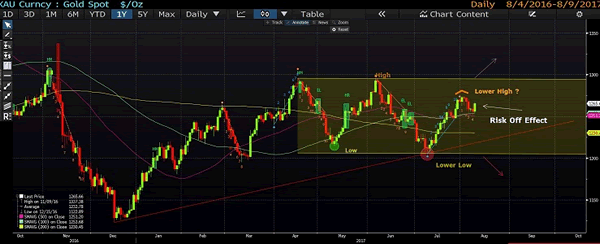
The Chinese inflation data was tucked under the shadow of President Trump's 'fire and fury' phrase. Although it is worth mentioning that the inflation number was a little softer and this means the spill over effect is going to echo the same message in other major economies.
Aussie Lost Its Momentum
The Aussie benefited from the dollar weakness but the rebound in the dollar got the Aussie in trouble. The Australian business confidence was much healthier yesterday which presents a more optimistic scenario for the uptrend to resume. The weak consumer sentiment reading broke the Aussie rally further. But it is the RBNZ which is going to face all the flash lights, and fear of disappointment is always there. Traders are expecting no reaction from the bank. We are expecting the bank to come with their dovish or less hawkish tone because of the deterioration in the economic data but a lot of impact of that is already baked into the Kiwi.
RAND Sell-Off Continues
The South African Rand is punished by investors as president Jacob Zuma narrowly survived a vote of no confidence in the parliament. His victory triggered many stop losses as it was expected that he will not survive. We expect the rand to underperform against the dollar. In other words, the overly optimistic trade is over for now.
Trade Idea: EUR/JPY – Sell at 129.50
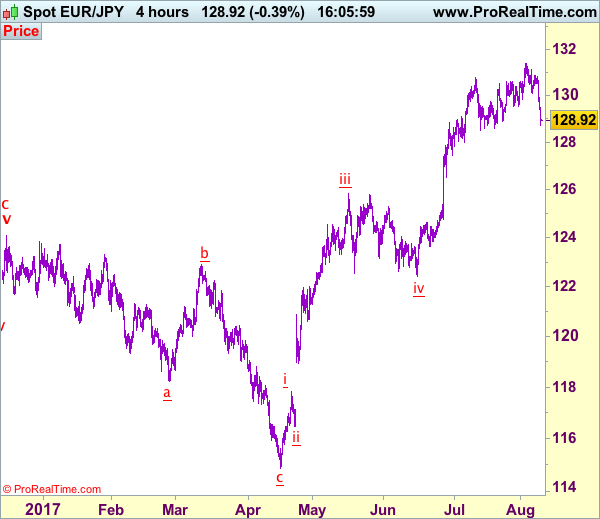
EUR/JPY - 128.73
Recent wave: wave v of (C) ended at 94.12 and major correction in wave A has ended at 149.79
Trend: Near term up
New strategy :
Sell at 129.50, Target: 127.50, Stop: 130.10
Position: -
Target: -
Stop:-
Euro’s decline gathered momentum after breaking support at 130.09 (now resistance), signal top has been formed at 131.40 last week and consolidation with downside bias is seen for this move to extend weakness to previous support at 128.49, break there would add credence to this view and extend this fall from 131.40 for retracement of early upmove to 128.00, then towards previous support at 127.44, however, near term oversold condition should limit downside to 127.00.
In view of this, we are looking to sell euro on recovery as 129.40-50 should limit upside and bring another decline. Only break of said previous support at 130.09 would abort and suggest low is formed instead, bring a stronger rebound to 130.50-60 but price should falter below resistance at 131.12 and bring another decline later.
Our latest preferred count is that wave (ii) is ABC-X-ABC which ended at 123.33 and wave (iii) is unfolding with wave iii ended at 100.77, followed by wave iv at 111.57 and wave v as well as the wave (iii) has ended at 97.04, followed by wave (iv) at 111.43 and wave (v) has ended at 94.12 which is also the end of the larger degree v, this also implied the major wave (C) has also ended there, hence major correction has commenced from there with (A) leg unfolding in its lower degree wave c which has possibly ended at 145.69. Under this count, A-B-C wave (B) has commenced with A leg ended at 136.23, wave B at 143.79 and wave C has possibly ended at 149.79.
Our larger degree count is that the decline from 139.26 is wave (C) and is sub-divided into a diagonal triangle i-ii-iii-iv-v with wave i - 105.44, wave ii- 123.33, wave iii - 97.03, wave iv - 111.43, followed by the final wave v as well as the end of wave (C) at 94.12, this also mark the bottom of larger degree wave B. Under this count, major rise in wave C has commenced as an impulsive wave with minor wave III ended at 145.69, wave V is still in progress for further gain to 150.00. Having said that, this so-called wave V could well be the first leg of larger degree 5-waver wave C and this wave C should bring at least a retest of wave A top at 169.97 (July 2008).
DAX Slips On North Korea Tensions
The DAX index is down considerably in the Wednesday session. Currently, the DAX is trading at 12,787.00, down 0.86% on the day. On the release front, it is a quiet day, with no German or Eurozone events. There are no major indicators until Friday, when Germany and the US release inflation reports.
Global stock markets are down on Wednesday, in response to rising tensions between the US and North Korea. The renegade state has reacted furiously to new sanctions imposed by Washington, and has threatened to attack Guam, which is a major US military base. President Donald Trump is taking a tough line on North Korea, and has promised that any aggression from North Korea will be met with “fire and fury.” With Trump and North Korean President Kim Jong-un on a possible collision course, risk appetite has decreased, as investors have snapped up gold, a traditional safe-haven asset.
German indicators started off the week on a sour note, as Industrial Production recorded a sharp decline of 1.1%. However, there was better news on Tuesday, as the trade surplus rose to EUR 21.2 billion, its highest level in 2017. Last week’s indicators were solid and continue to point to an expanding German economy. Retail Sales jumped 1.1%, its second-highest gain in 2017. Factory Orders gained 1.0%, while unemployment claims dropped 9 thousand – the employment indicator has declined every month in 2017, except one. Although manufacturing and services PMIs dipped in July, both are well over the 50-level, indicative of expansion. Are the strong German numbers too much of a good thing? Some analysts think so, and are cautioning that the German economy is in danger of overheating. Still, there’s no arguing that the eurozone economy has received a boost from the robust German economy. Eurozone GDP gained 0.6% in the second quarter, up from 0.5% in the previous quarter. As well, Eurozone Retail Sales gained 0.5%, marking a 4-month high.
While the euro has posted impressive gains of late, it has been the opposite story for the US dollar. Paralysis in Washington is weighing on the greenback, as Donald Trump’s antics and inability to pass healthcare legislation has increased political risk in the US. As well, the Federal Reserve’s monetary policy remains unclear. Earlier this year the Fed strongly hinted that it planned to raise rates three times in 2017, but has only pressed the rate trigger twice. In June, Fed Chair Janet Yellen shrugged off low inflation, saying that it was due to “transient” factors, leaving the impression that the Fed still planned one final hike. However, inflation has not improved and the Fed has changed its tune. Last week, St. Louis Federal Reserve President James Bullard said he opposed further Fed hikes, warning that another hike would actually delay inflation from hitting the Fed’s target of 2%. The markets have become more skeptical about a rate hike in December, as the odds have fallen to 34%, compared to 43% a week ago.