Sample Category Title
EURUSD Intraday Analysis
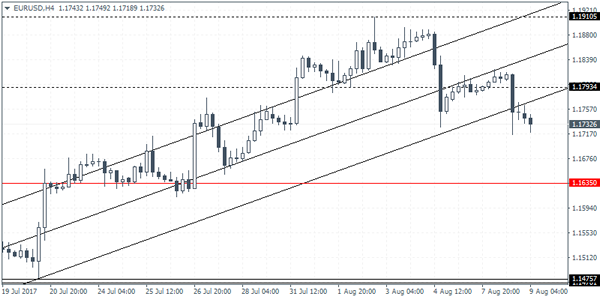
EURUSD (1.1732): The EURUSD closed bearish yesterday after price action formd an outside bar. A continued decline in the currency pair coould see further downside being confirmed. The brief reversal to 1.1793 saw price action break down strongly. Support is seen at 1.1635 currently which remains the strong downside target in prices. To the upside, any reversals will once again be met with the resistance at 1.1793. Any upside in the currency pair will need to see price action break past this resistance level.
RBNZ Monetary Policy Meeting In Focus
The US dollar continued to post some gains yesterday across the board. However, the gains were limited with the Japanese yen staying firm. The gains in the yen came about due to ongoing escalating tensions from North Korea which kept investors appetite in check.
The US President Trump, in response to North Korea's actions, said that the United States would respond with "fire and fury." The economic data released yesterday included the German trade balance data which widened more than expected. Earlier today, inflation data from China showed that consumer prices rose 1.4% on the year. This was less than the forecast of a 1.5% increase. Producer prices index was also seen rising at a softer pace of 5.5%
Looking ahead, the markets will be focusing on the RBNZ's meeting coming up later this evening. No changes are expected to the interest rates at today's meeting. Canada will be releasing the building permits figures.
AUD/JPY Candlesticks and Ichimoku Analysis
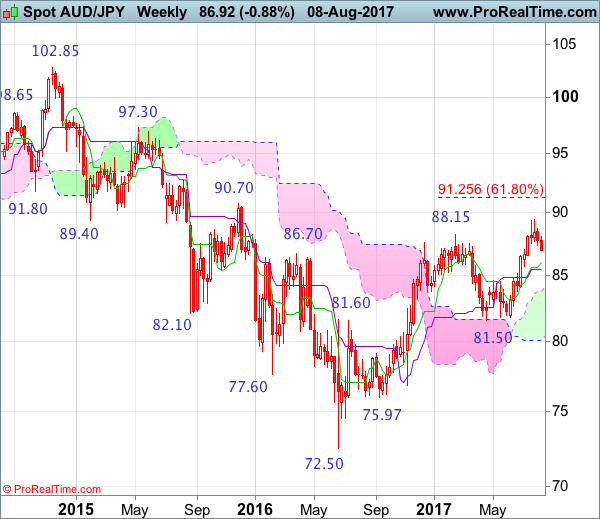
Weekly
• Last Candlesticks pattern: Shooting star
• Time of formation: 13 Mar 2017
• Trend bias: Down
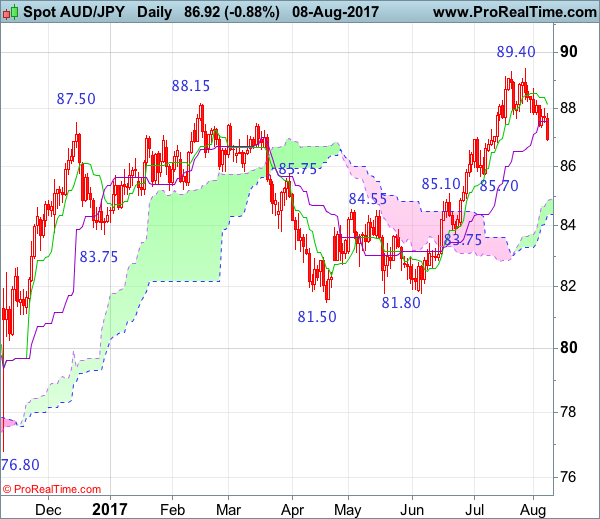
Daily
• Last Candlesticks pattern: Bearish engulfing pattern
• Time of formation: 16 Feb 2017
• Trend bias: Near term down
Although the Australian dollar edged higher to 89.40 late last month, the subsequent retreat suggests consolidation below this level would be seen and pullback to 0.8700 is likely, however, reckon downside would be limited to 86.50-60 and renewed buying interest should emerge around 86.00-10, bring another rise later, above 88.70 would suggest the pullback from 89.40 has ended, bring retest of this level first. Once this recent high is penetrated, this would confirm medium term upmove from 2016 low of 72.50 is still in progress and extend further gain to psychological resistance at 90.00, then towards previous chart resistance at 90.70.
On the downside, whilst initial pullback to 87.00-10 is likely, reckon downside would be limited to 86.60-65 and support at 85.70 should hold, bring another rise later. A daily close below support at 85.70 would suggest top has been formed, brig retracement of recent rise to 85.40-50, then 85.00, however, reckon the upper Kumo (now at 84.85) would limit downside and price should stay above the lower Kumo (now at 84.36), bring rebound later.
Recommendation: Buy at 85.75 for 88.00 with stop below 84.75.
On the weekly chart, aussie’s retreat after rising to 89.40 formed a shooting star and the subsequent black candlestick suggests a minor top is possibly formed, hence consolidation below this level would be seen for correction to 87.00, then 86.50-60, however, reckon downside would be limited to the Tenkan-Sen (now at 86.01) and bring another rise later. Above 88.70 would bring retest of 89.40. A break above there would confirm medium term upmove from 72.50 low (formed back in 2016) is still in progress and extend headway to psychological resistance at 90.00, then test of previous resistance at 90.70, however, overbought condition should limit upside to 91.50-60 and price should falter below another previous chart resistance at 92.70, bring correction later.
On the downside, although initial pullback to 87.00, then 86.50-60 cannot be ruled out, reckon the Tenkan-Sen (now at 86.01) would limit downside and bring another rise later. Below the Kijun-Sen (now at 85.46) would suggest a temporary top is formed instead, bring retracement of recent rise to 85.00, then 84.60-65, however, still reckon the upper Kumo (now at 83.70) would remain intact.
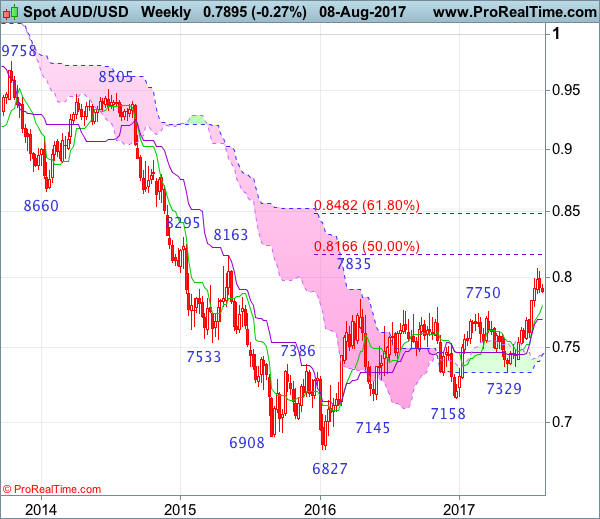
AUD/USD Candlesticks and Ichimoku Analysis
Weekly
• Last Candlesticks pattern: Long white candlestick
• Time of formation: 10 Jul 2017
• Trend bias: Up
Daily
• Last Candlesticks pattern: Long white candlestick
• Time of formation: 18 Jul 2017
• Trend bias: Up
As aussie met resistance again just below 0.8000 level, retaining our view that initial consolidation below recent high of 0.8066 would be seen and near term downside risk remains for retracement to 0.7877-78 (38.2% Fibonacci retracement of 0.7571-0.8066 and previous support), however, reckon 0.7815-20 (50% Fibonacci retracement) would limit downside and bring another rise later, above 0.8000 would bring retest of 0.8066 but break there is needed to confirm upmove has resumed and extend the medium term erratic rise from 0.6827 to 0.8163 resistance, then 0.8200, however, loss of near term upward momentum should limit upside and reckon another previous resistance at 0.8295 would hold.
On the downside, whilst initial pullback to 0.7877-78 cannot be ruled out, reckon 0.7815-20 would limit downside and bring another upmove later. A daily close below support at 0.7786 would bring test of 0.7760 (61.8% Fibonacci retracement of 0.7571-0.8066), however, only break of indicated support at 0.7712 would confirm top has been formed, bring retracement of recent rise to 0.7650-60 first.
Recommendation: Buy at 0.7800 for 0.8000 with stop below 0.7700.

On the weekly chart, aussie’s retreat after rising to 0.8066 suggests consolidation below this level would be seen and initial downside bias is for pullback to 0.7815-20, however, reckon the Tenkan-Sen (now at 0.7794) would limit downside and bring another rise later. above 0.8000 would bring retest of 0.8066, break there would extend recent upmove from 0.6827 low to previous resistance at 0.8163, then 0.8250, however, near term overbought condition should limit upside to another previous resistance at 0.8295 and price should falter below 0.8390-00, bring retreat later.
On the downside, although initial pullback to 0.7875-80 is likely, reckon downside would be limited to previous resistance at 0.7835 (now support) and bring another rise later. Below 0.7750 would bring pullback towards previous resistance at 0.7712, break there would suggest top is possibly formed, bring test of the Kijun-Sen (now at 0.7698) but break there is needed to provide confirmation, bring further fall towards said support at 0.7571 which should remain intact.
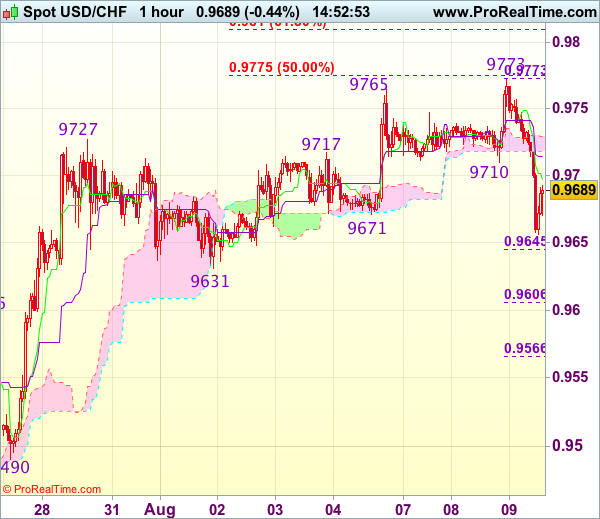
Trade Idea : USD/CHF – Sell at 0.9725
USD/CHF - 0.9683
Most recent candlesticks pattern : N/A
Trend : Near term up
Tenkan-Sen level : 0.9695
Kijun-Sen level : 0.9715
Ichimoku cloud top : 0.9730
Ichimoku cloud bottom : 0.9718
Original strategy :
Bought at 0.9725, stopped at 0.9690
Position : - Long at 0.9725
Target : -
Stop : - 0.9690
New strategy :
Sell at 0.9725, Target: 0.9625, Stop: 0.9760
Position : -
Target : -
Stop : -
Although the greenback extended recent rise from 0.9438 to 0.9772, lack of follow through buying on break of previous resistance at 0.9765 and the subsequent retreat suggest top is possibly formed there and consolidation with mild downside bias is seen for weakness to 0.9645 (38.2% Fibonacci retracement of 0.9438-0.9773), however, break of support at 0.9631 is needed to add credence to this view, bring further fall towards 0.9605-10 (50% Fibonacci retracement).
In view of this, we are looking to sell dollar on recovery as 0.9730-35 should limit upside. Only break of yesterday’s high at 0.9773 would abort and revive bullishness for the rise from 0.9438 to extend gain to 0.9800-10.
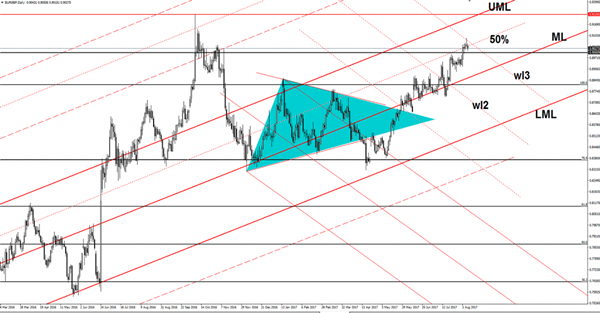
EUR/GBP False Breakout?
EUR/GBP drops after the false breakout above the 50% Fibonacci line (ascending dotted line). Could come down to retest the 0.9000 psychological level before will try to resume the upside movement. We have a bullish bias on the Daily chart, but a drop below the psychological level will open the door for a drop towards the median line (ML) of the major ascending pitchfork. Resistance can be found at the wl3 as well.
NZD/USD Extends The Sell-Off
Price drops like a rock and looks unstoppable on the short term. Is trading near the 0.7320 level and should drop further. NZD/USD is seeking for strong support and could find one at the fourth warning line (wl4). Could be attracted by the confluence area formed at the intersection between the warning line (wl4) and the 38.2% retracement level.
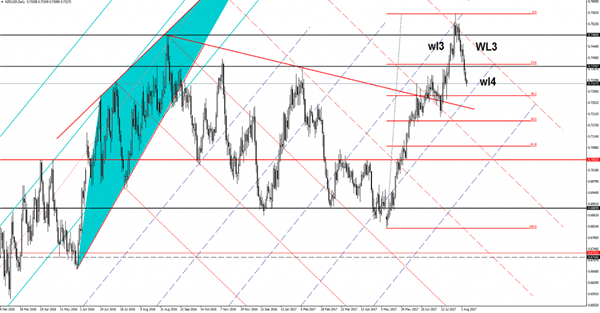
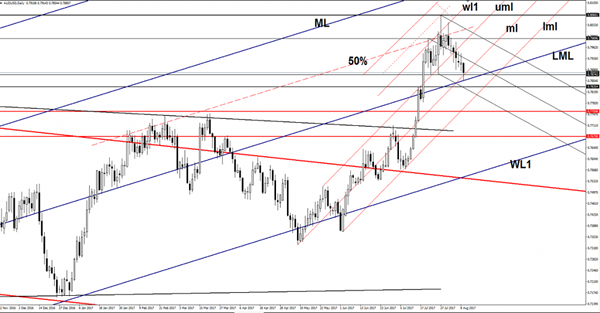
AUD/USD Hit A Critical Support
AUD/USD plunged and resumed the bearish momentum as the USD received a helping hand from the United States data. Price reached a major dynamic obstacle, where has found temporary support again. Is trading in the red as the dollar index stays above the 93.50 psychological level, the index will climb towards new highs if the United States data will come in line with expectations or better. You should keep an eye on the economic calendar in the afternoon to see what will drive the rate.
Aussie dropped on the poor Chinese and Australian numbers, but has squeezed a little in the last hours. The Chinese CPI rose by 1.4% in July, less compared to the 1.5% estimate, while the PPI surged only by 5.5%, despite that the traders have expected to see a 5.6% growth. Moreover, the Australian Home Loans surged by 0.5%, less compared to the 1.5% estimate and versus the 1.1% growth in the former reading period, while the Westpac Consumer Sentiment dropped by 1.2% in August from the 0.4% in July.
Price dropped and touched the lower median line (LML) of the major ascending pitchfork, where has found strong demand. Has broken below the 0.7874 static support, but wasn’t able to stay there as the dollar index looks ready to decrease a little again.
AUD/USD dropped also below the median line (ml) of the minor ascending pitchfork, but right now we have only a false breakdown. The current decrease is natural after the false breakout above the 50% Fibonacci line (ascending dotted line) and above the warning line (wl1) of the minor ascending pitchfork.
You can see that I’ve drawn a minor descending pitchfork to catch a potential downside movement, price retested the median line and now could try to reach the lower median line of the mentioned support levels will cave in.
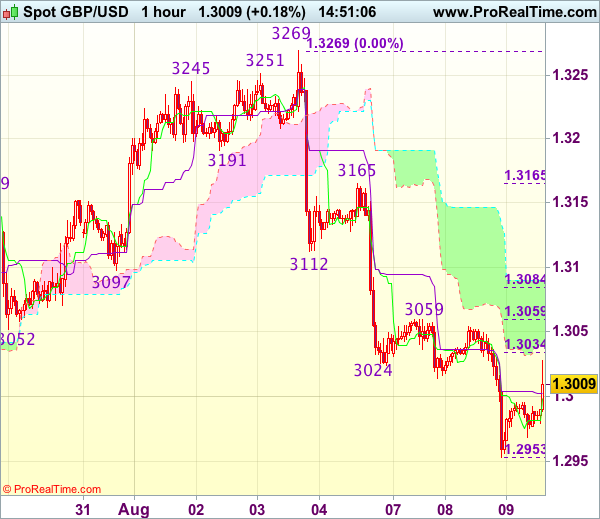
Trade Idea : GBP/USD – Buy at 1.3000
GBP/USD - 1.3020
Most recent candlesticks pattern : N/A
Trend : Near term down
Tenkan-Sen level : 1.2998
Kijun-Sen level : 1.3001
Ichimoku cloud top : 1.3090
Ichimoku cloud bottom : 1.3040
Original strategy :
Sell at 1.3055, Target: 1.2955, Stop: 1.3090
Position : -
Target : -
Stop : -
New strategy :
Buy at 1.3000, Target: 1.3100, Stop: 1.2965
Position : -
Target : -
Stop : -
Although cable slipped to 1.2953 yesterday, the subsequent rebound suggests consolidation above this level would be seen and gain to 1.3059 resistance is likely, however, break there is needed to signal low is possibly formed, bring test of the upper Kumo (now at 1.3090), break there would add credence to this view, bring a stronger rebound to 1.3110-20 but resistance at 1.3165 should remain intact.
In view of this, we are looking to turn long on dips for such rebound. Below 1.2965-70 would signal decline has resumed and extend the fall from 1.3269 top towards previous chart support at 1.2933 but reckon 1.2900 would hold from here, risk from there has increased for a rebound to take place later.
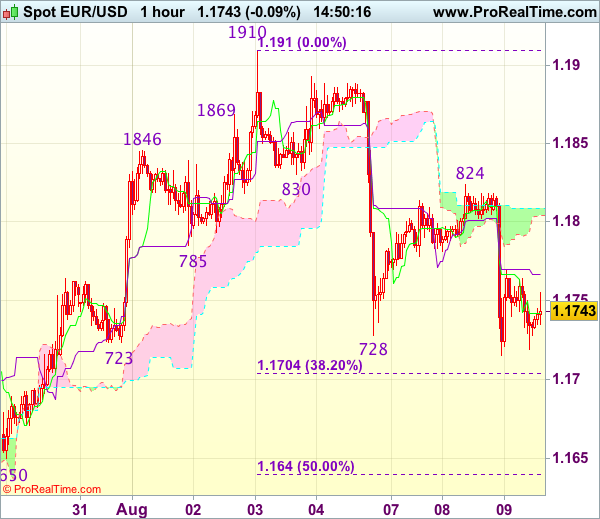
Trade Idea : EUR/USD – Hold short entered at 1.1770
EUR/USD - 1.1748
Most recent candlesticks pattern : N/A
Trend : Near term up
Tenkan-Sen level : 1.1742
Kijun-Sen level : 1.1767
Ichimoku cloud top : 1.1809
Ichimoku cloud bottom : 1.1804
Original strategy :
Sold at 1.1770, Target: 1.1670, Stop: 1.1805
Position : - Short at 1.1770
Target : - 1.1670
Stop : - 1.1805
New strategy :
Hold short entered at 1.1770, Target: 1.1670, Stop: 1.1805
Position : - Short at 1.1770
Target : - 1.1670
Stop : - 1.1805
Although the single currency found support at 1.1715 yesterday and recovered, reckon upside would be limited to 1.1770-80 and bring another decline, below said support would extend the fall from 1.1910 top for retracement of early upmove to 1.1700 and then 1.0670 but reckon support at 1.1650 would remain intact due to oversold condition.
In view of this, we are holding on to our short position entered at 1.1770. Above 1.1800-05 would risk another test of 1.1824-30 resistance but only break there would signal the erratic fall from 1.1910 has ended, bring further gain to 1.1855-60 first.