Sample Category Title
USD/CAD Daily Outlook
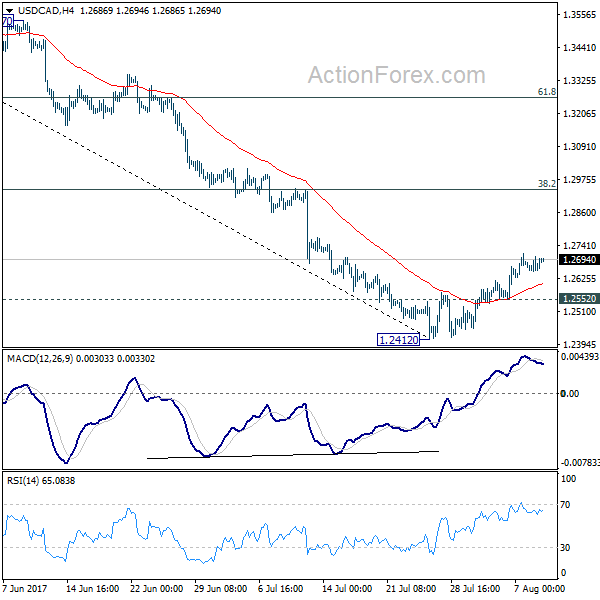
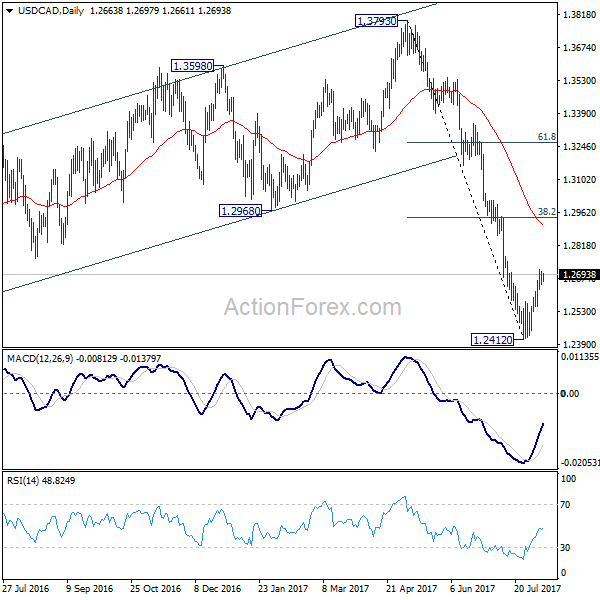
Daily Pivots: (S1) 1.2643; (P) 1.2674; (R1) 1.2698; More....
Intraday bias in USD/CAD remains on the upside as rebound from 1.2412 short term bottom continues. Such rebound should be corrective whole fall from 1.3793. Further rise would be seen back to 38.2% retracement of 1.3793 to 1.2412 at 1.2940. On the downside, break of 1.2552 minor support will indicate completion of the rebound. In such case, intraday bias will be turned back to the downside for 1.2412 low.
In the bigger picture, price actions from 1.4689 medium term top are seen as a correction pattern. A short term bottom is formed at 1.2412 after hitting 61.8% projection of 1.4689 to 1.2460 from 1.3793 at 1.2415. But there is no sign of completion of the correction yet. Break of 1.2412 will target 50% retracement of 0.9406 to 1.4869 at 1.2048. At this point, we'd look for strong support from there to contain downside and bring rebound. Meanwhile, sustained break of 1.2968, 38.2% retracement of 1.3793 to 1.2412 at 1.2940 will be the first sign of completion of the correction and will turn focus back to 1.3793 key resistance.
EUR/USD Daily Outlook
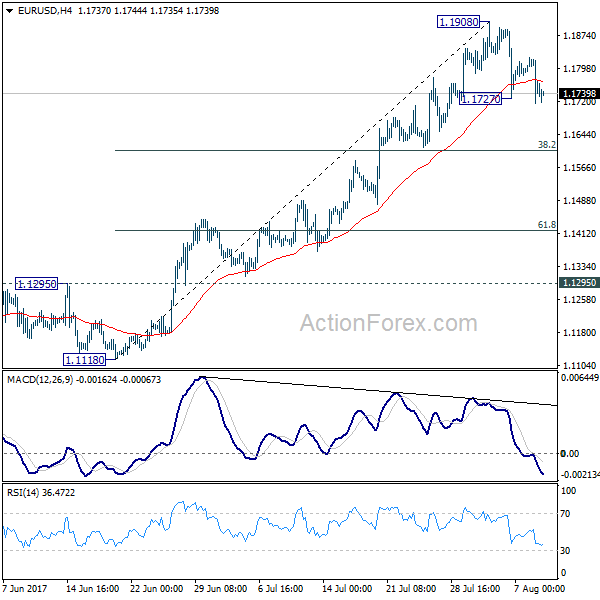
Daily Pivots: (S1) 1.1703; (P) 1.1763 (R1) 1.1813; More...
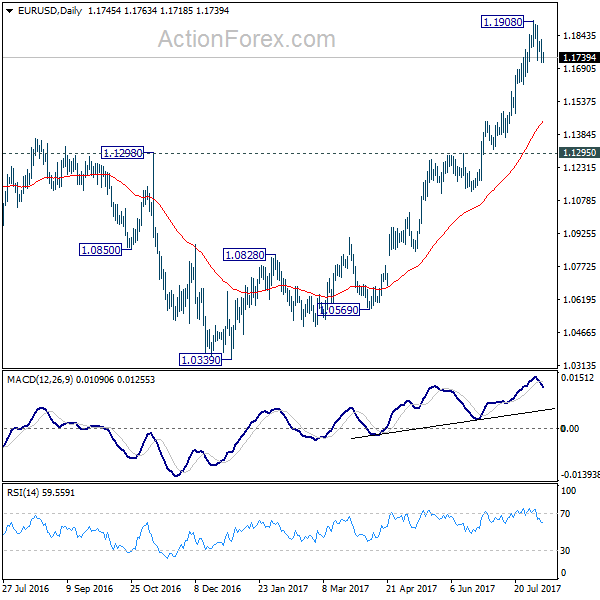
Break of 1.1747 indicates resumption of pull back from 1.1908 short term top. Intraday bias is back on the downside for 38.2% retracement of 1.1119 to 1.1908 at 1.1606. At this point, we'd expect strong support from there to bring rebound. But break of 1.1908 is needed to confirm up trend resumption. Otherwise, more consolidation would be seen in near term. Meanwhile, sustained break of 1.1606 would bring deeper pull back to 61.8% retracement at 1.1420.
In the bigger picture, an important bottom was formed at 1.0339 on bullish convergence condition in weekly MACD. Sustained break of 55 month EMA (now at 1.1760) will pave the way to key fibonacci level at 38.2% retracement of 1.6039 (2008 high) to 1.0339 (2017 low) at 1.2516. While rise from 1.0339 is strong, there is no confirmation that it's developing into a long term up trend yet. Hence, we'll be cautious on strong resistance from 1.2516 to limit upside. But for now, medium term outlook will remain bullish as long as 1.1295 support holds, in case of pull back.
GBP/USD Daily Outlook
Daily Pivots: (S1) 1.2946; (P) 1.2999; (R1) 1.3047; More...
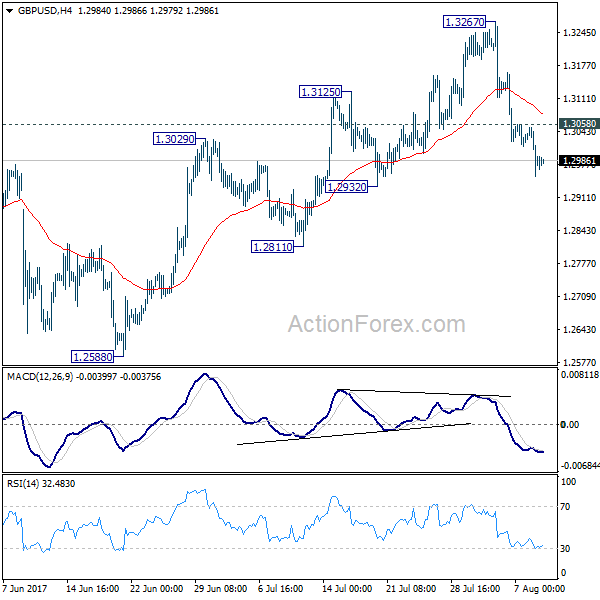
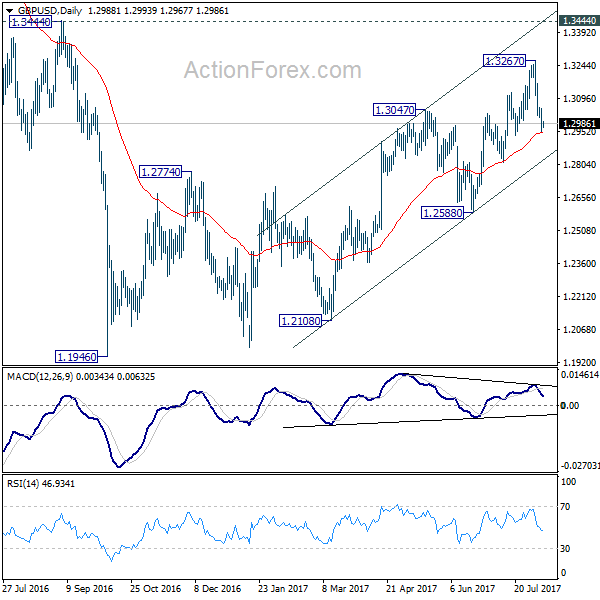
GBP/USD's fall from 1.3267 is still in progress and intraday bias remains on the downside for 1.2932 support first. Price actions from 1.1946 are seen as a corrective pattern, no change is this view. Such correction could have completed at 1.3267 already. Break of 1.2932 will affirm this bearish case and target 1.2588 key near term support for confirmation. On the upside, however, above 1.3058 minor resistance will turn bias neutral first. But deeper fall is expected as long as 1.3267 resistance holds.
In the bigger picture, overall, price actions from 1.1946 medium term low are seen as a corrective pattern that is still in progress. While further upside is expected, larger outlook remains bearish as long as 1.3444 key resistance holds. Down trend from 1.7190 (2014 high) is expected to resume later after the correction completes. And break of 1.2588 will indicate that such down trend is resuming.
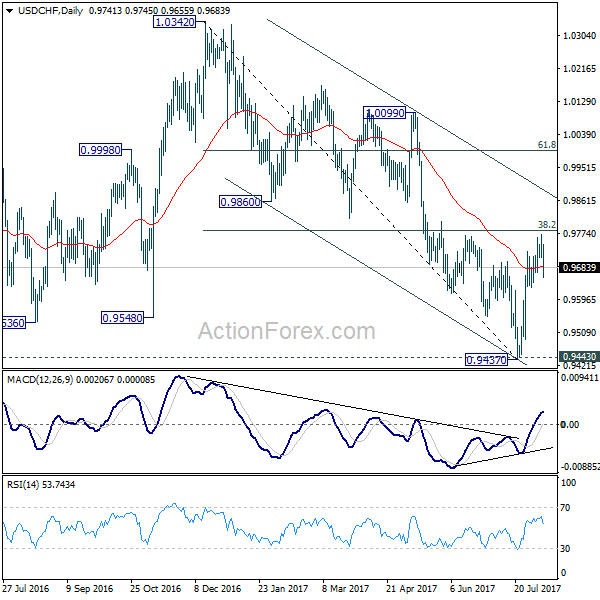
USD/CHF Daily Outlook
Daily Pivots: (S1) 0.9708; (P) 0.9741; (R1) 0.9772; More...
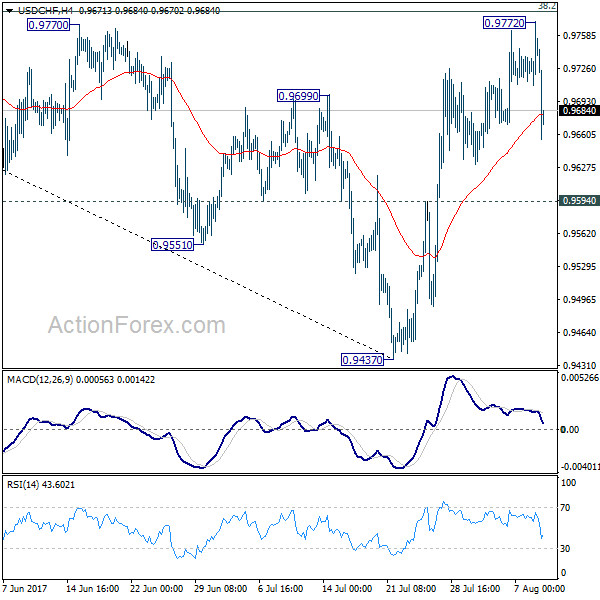
USD/CHF edged higher to 0.9772 but failed to take out 38.2% retracement of 1.0342 to 0.9437 at 0.9783 and retreated. Intraday bias is turned neutral first. Further rise is in favor as long as 0.9594 support holds. As noted before, prior break of 0.9699 resistance suggests near term reversal after defending 0.9443 key support. Break of 0.9783 will target channel resistance (now at 0.9887). However, firm break of 0.9594 will dampen our bullish view and turn bias back to the downside for 0.9437.
In the bigger picture, current development argues that USD/CHF has successfully defended 0.9443 key support level. And long term range trading in 0.9443/1.0342 is extending with another rise. At this point, there is no sign of an up trend yet. Hence, while further rise is expected in USD/CHF, we'll start to be cautious on loss of momentum above 61.8% retracement of 1.0342 to 0.9437 at 0.9996.
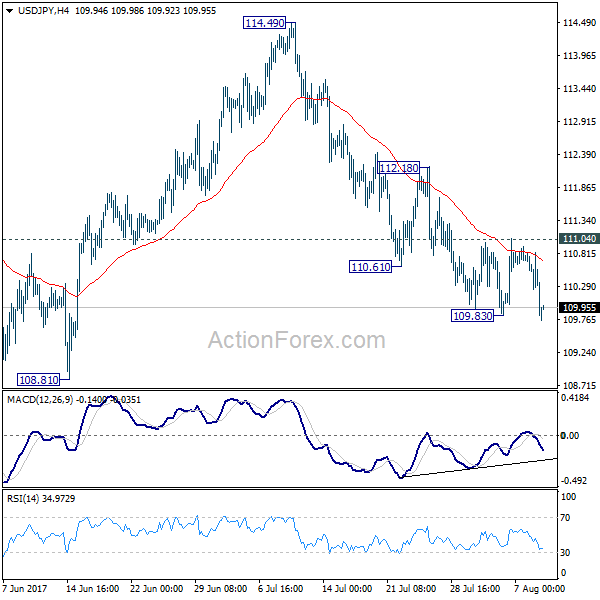
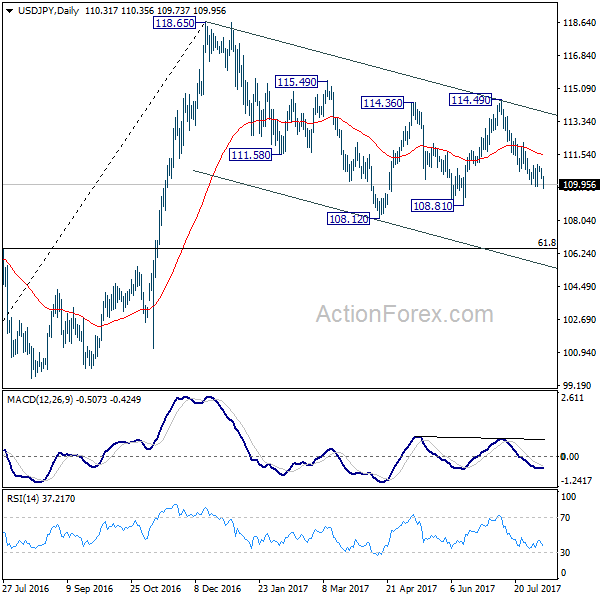
USD/JPY Daily Outlook
Daily Pivots: (S1) 110.11; (P) 110.46; (R1) 110.69; More...
USD/JPY's break of 109.83 suggests resumption of fall from 114.49. Intraday bias is back on the downside for 108.81 support first. Break there will resume whole correction from 118.65 and target 61.8% retracement of 98.97 to 118.65 at 106.48. On the upside, break of 111.04 resistance is needed to indicate short term bottoming. Otherwise, outlook will stay bearish in case of recovery.
In the bigger picture, the corrective structure of the fall from 118.65 suggests that rise from 98.97 is not completed yet. Break of 118.65 will target a test on 125.85 high. At this point, it's uncertain whether rise from 98.97 is resuming the long term up trend from 75.56, or it's a leg in the consolidation from 125.85. Hence, we'll be cautious on topping as it approaches 125.85. If fall from 118.65 extends lower, down side should be contained by 61.8% retracement of 98.97 to 118.65 at 106.48 and bring rebound.
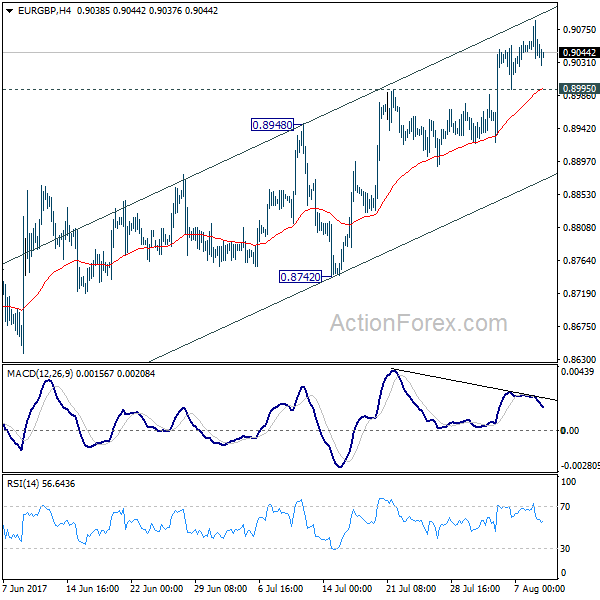
EUR/GBP Daily Outlook
Daily Pivots: (S1) 0.9025; (P) 0.9056; (R1) 0.9076; More
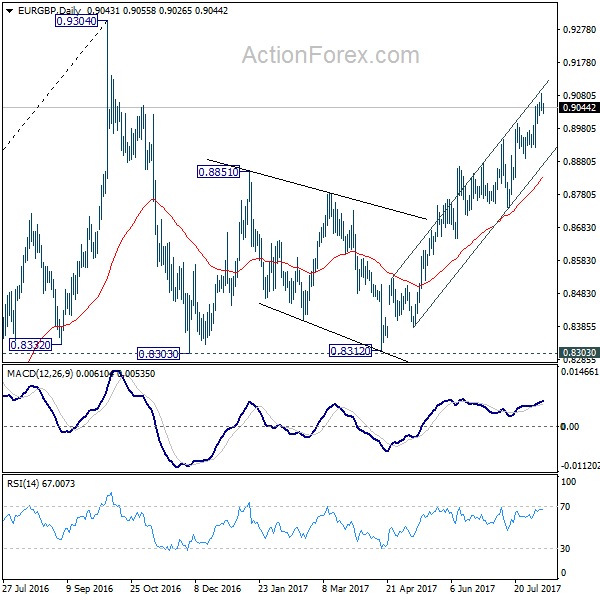
EUR/GBP is losing upside momentum as seen in 4 hour MACD. But with 0.8995 minor support intact, further rise is still expected. Current rise from 0.8312 should extend towards 0.9304 key high. At this point, there is no clear sign of up trend resumption yet. Hence, we'll be cautious on strong resistance from 0.9304 to limit upside and bring another fall. On the downside, below 0.8995 minor support will turn intraday bias neutral and bring consolidation before staging another rise.
In the bigger picture, price actions from 0.9304 are viewed as a medium term corrective pattern. It's uncertain whether it is finished yet. But in case of another fall, we'd expect strong support from 0.8116 cluster support (50% retracement of 0.6935 to 0.9304 at 0.8120) to contain downside and bring rebound. Whole up trend from 0.6935 is expected to resume after consolidation from 0.9304 completes.
EUR/AUD Daily Outlook
Daily Pivots: (S1) 1.4849; (P) 1.4887; (R1) 1.4939; More...
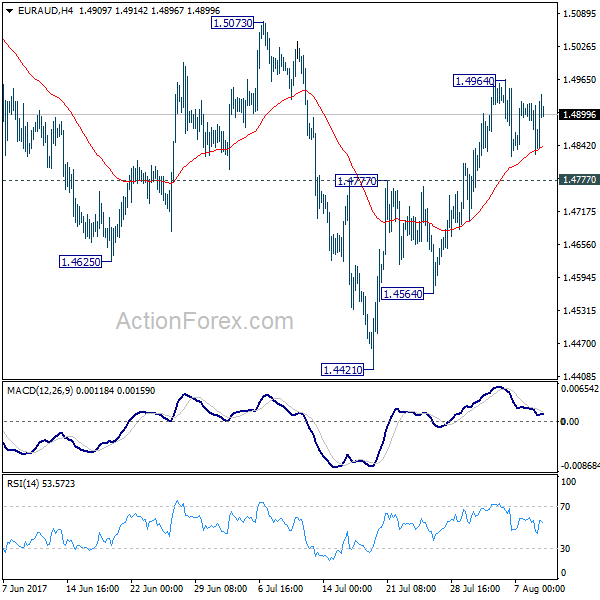
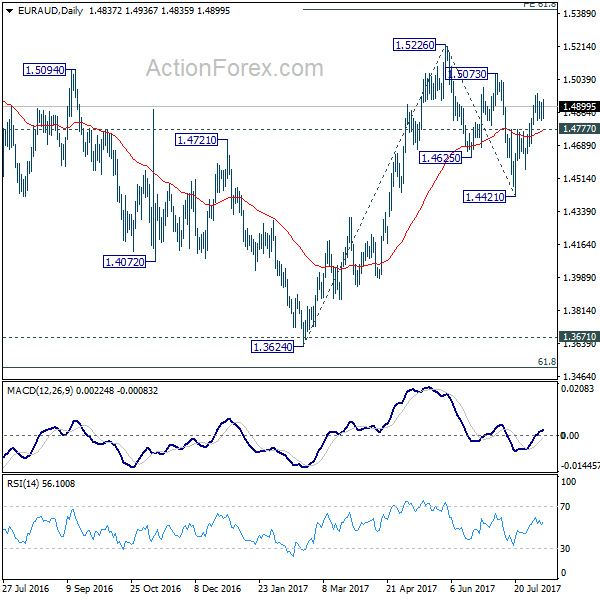
EUR/AUD is staying in consolidation below 1.4964 and intraday bias remains neutral. . Near term outlook remains bullish with 1.4777 support intact and further rally is expected. As noted before, correction from 1.5226 should have completed with three waves down to 1.4421 already. Above 1.4964 will target 1.5073 resistance first. Break of 1.5073 will likely resume the rise from 1.3624 and target 61.8% projection of 1.3624 to 1.5226 from 1.4421 at 1.5411 next. However, firm break of 1.4777 will dampen this bullish view and turn bias to the downside for 1.4564 support. Break will extend the correction from 1.5226 through 1.4421.
In the bigger picture, we're holding on to the view that corrective decline from 1.6587 medium term has completed at 1.3624. Rise from 1.3624 is expected to resume to retest 1.6587. The corrective structure of the fall from 1.5226 is affirming this view. Above 1.5226 will target a test on 1.6587 key resistance. However, another decline will dampen our view and would drag EUR/AUD lower to retest key support zone around 1.3624.
EUR/CHF Daily Outlook
Daily Pivots: (S1) 1.1424; (P) 1.1462; (R1) 1.1486; More...
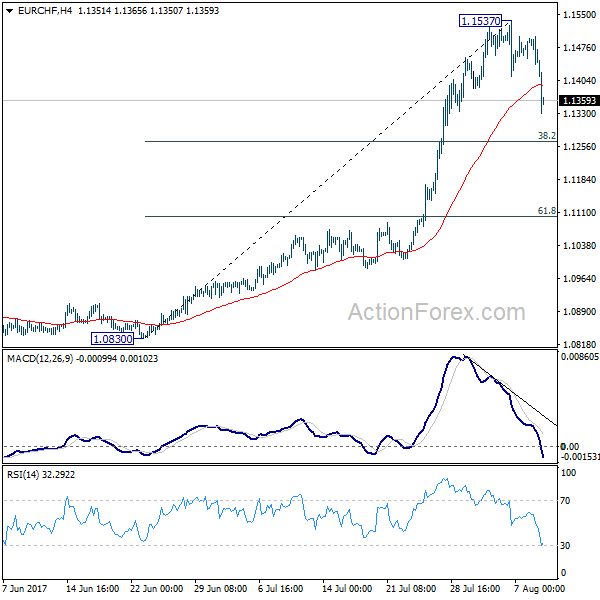
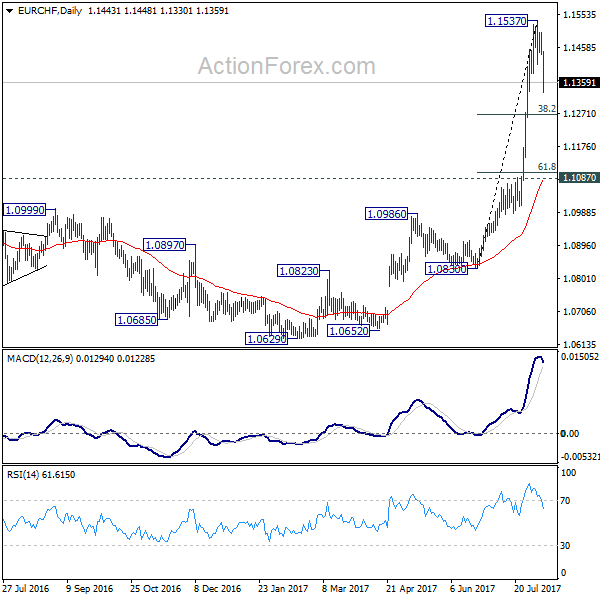
EUR/CHF's correction from 1.1537 short term accelerates to as low as 1.1330 on break of 1.1411. Intraday bias is back on the downside for 38.2% retracement of 1.0830 to 1.1537 at 1.1267. At this point, we'd expect strong support from 1.1267 to bring rebound. But break of 1.1537 is needed to confirm up trend resumption. Otherwise, more consolidative trading would be seen. Meanwhile, firm break of 1.1267 will target 61.8% retracement at 1.1100.
In the bigger picture, firm break of 1.1198 key resistance confirms resumption of the long term rise from SNB spike low back in 2015. In this case, EUR/CHF would eventually head back to prior SNB imposed floor at 1.2000. For now, this will be the favored case as long as 1.1087 resistance turned support holds.
EUR/JPY Daily Outlook
Daily Pivots: (S1) 129.25; (P) 130.03; (R1) 130.47; More...
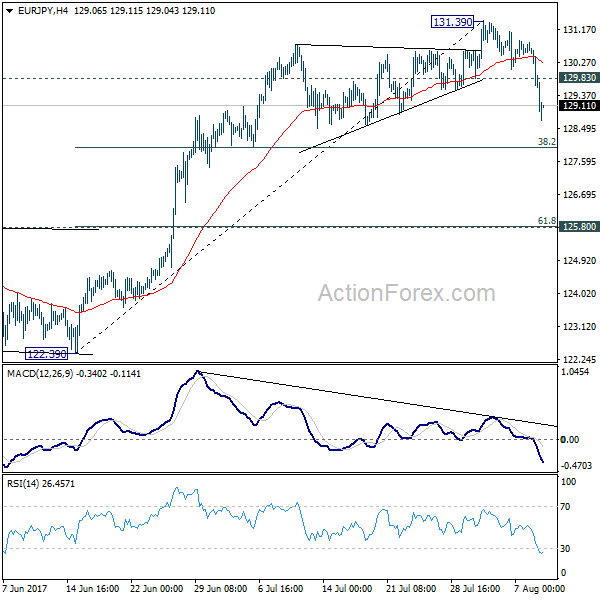
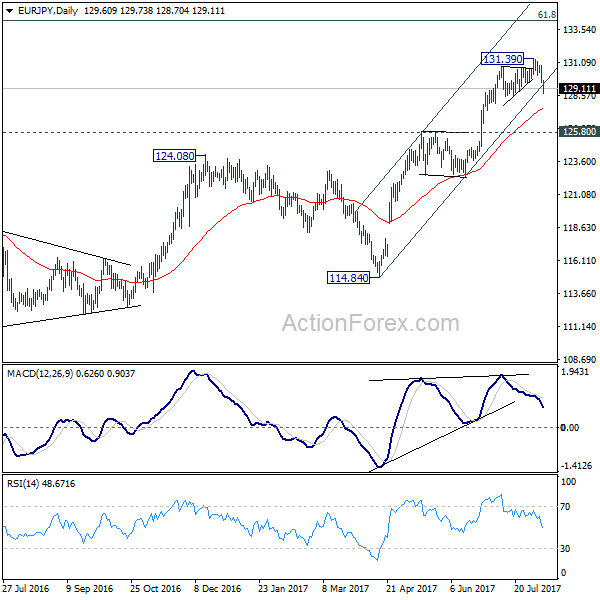
EUR/JPY's sharp fall and break of 129.83 minor support confirms short term topping at 131.39 on bearish divergence condition in 4 hour MACD. Intraday bias is now on the downside for 38.2% retracement of 122.39 to 131.39 at 127.95. At this point, we'd expect strong support from 127.95 to contain downside and bring rebound. But break of 131.39 is needed to confirm up trend resumption. Otherwise, more consolidative trading is expected with risk of another fall. Meanwhile, firm break of 127.5 will bring deeper decline to 125.80 resistance turned support before completing the correction.
In the bigger picture, the down trend from 149.76 (2014 high) is completed at 109.03 (2016 low). Current rally from 109.03 should be at the same degree as the fall from 149.76 to 109.03. Further rise is expected to 61.8% retracement of 149.76 to 109.03 at 134.20. Sustained break there will pave the way to key long term resistance zone at 141.04/149.76. Medium term outlook will remain bullish as long as 124.08 resistance turned support holds.
Elliott Wave View: FTSE 100 Pullback Expected
Short term FTSE 100 ( UKX-FTSE ) Elliott Wave view suggests that Minor wave B ended on 6/30 low 7302.7 and the rally from there is unfolding as a double three Elliott wave structure where wave ((w)) ended at 7515.12 and wave ((x)) pullback ended at 7338.2. Index has reached 100% from 6/30 low so cycle is mature and Minor wave 1 can be complete anytime. Expect the Index to pullback in Minor wave 2 soon to correct cycle from 6/30 low before the rally resumes. As far as pivot at 7302.7 low remains intact, Index should find buyers within Minor wave 2 dips in the sequence of 3, 7, or 11 swing for further upside. If pivot at 7302.7 low fails during later pullback, the Index would be still remain in the same cycle from 6/2 peak. Index should then extend the correction to the downside. We don’t like selling the Index.
FTSE 1 Hour Elliott Wave Chart
7 swings structure is one of the most common patterns in the theory of New Elliott Wave & it is also mainly know as double three Elliott Wave pattern. Market find that very often nowadays in many instruments in almost all time frames. It is a very reliable structure by which we can make a good analysis and what is more important is giving us good business inputs with clearly defined levels invalidation and destination areas.
The image below shows what Elliott wave pattern Double Three looks like. It has (W), (X), (Y) and 3,3,3 internal structure, which means that all these 3 legs are corrective sequences. Each (W), (X) and (Y) are made of three waves, which are having the structure W, X, Y in lesser degree as well. Elliott Wave principle is a form of technical analysis that traders use to analyze the cycles of financial markets and market trends forecast by identifying extremes in investor psychology, high and low prices, and other collective factors. Important to Note that 3 waves could also be labeled ABC (5-3-5) structure as well. How are labeled 3 waves it depends on the internal price structure subdivisions waves i.e. whether the price action is corrective or motive.