Sample Category Title
Trade Idea: EUR/GBP – Hold short entered at 0.9080
EUR/GBP - 0.9061
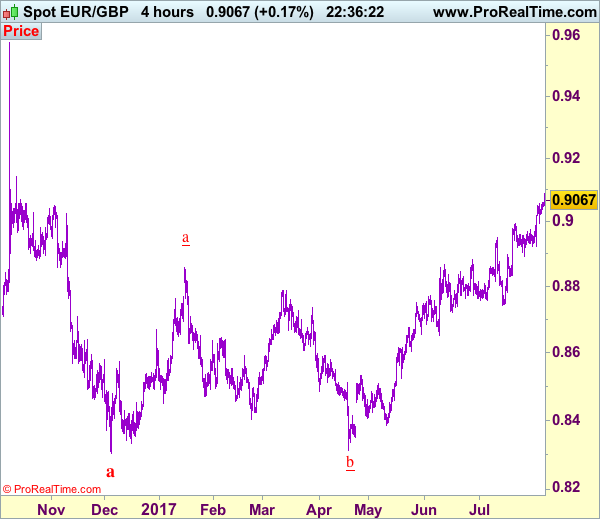
Recent wave: Major double three (A)-(B)-(C)-(X)-(A)-(B)-(C) is unfolding and 2nd (A) has possibly ended at 0.6936.
Trend: Near term up
Original strategy :
Sold at 0.9080, Target: 0.8980, Stop: 0.9120
Position : - Short at 0.9080
Target : - 0.8980
Stop : - 0.9120
New strategy :
Hold short entered at 0.9080, Target: 0.8980, Stop: 0.9100
Position : - Short at 0.9080
Target : - 0.8980
Stop : - 0.9100
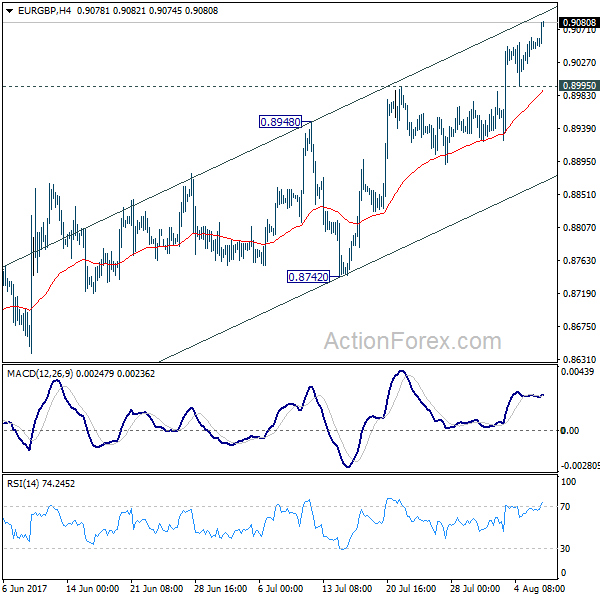
Although the single currency has surged again today, loss of near term upward momentum should prevent sharp move beyond 0.9090-00 and bring retreat later, below 0.9045-50 would bring test of indicated support at 0.8995, break there would suggest top is possibly formed, then weakness to 0.8965-70 would follow but below 0.8945-50 is needed to add credence to this view, bring retracement of recent upmove towards support at 0.8922.
In view of this, we are holding on to our short position entered at 0.9080. Above 0.9110-20 would risk gain to 0.9145-50, however, still reckon sharp move beyond there should not be repeated and upside should be limited to 0.9175-80, price should falter below 0.9100, bring correction later.
Our preferred count is that, after forming a major top at 0.9805 (wave V), (A)-(B)-(C) correction is unfolding with (A) leg ended at 0.8400 (A: 0.8637, B: 0.9491 and 5-waver C ended at 0.8400. Wave (B) has ended at 0.9413 and impulsive wave (C) has either ended at 0.8067 or may extend one more fall to 0.8000 before prospect of another rally. Current breach of indicated resistance at 0.9043 confirms our view that the (C) leg has ended and bring stronger rebound towards 0.9150/54, then towards 0.9240/50.
Brexit Monitor: What to Watch in Coming Months
Divided cabinet complicates Brexit negotiations
The third round of Brexit negotiations is set to take place in Brussels between 28 August and 4 September. Previously, the EU's chief negotiator Michel Barnier had said the negotiations were proceeding too slowly, meaning that negotiations in phase 1 (divorce bill, citizens' rights and Irish border) may not be concluded in October as hoped for. If not, the next possibility is in December, when the next EU summit after the one in October takes place.
Due to the poor election result, PM Theresa May's position has weakened and the minority government is under pressure from both remainers and Brexiters. This is the main reason we have seen very different statements from cabinet members, for example on whether to agree on a transit ional deal or not. The divided cabinet complicates the negotiations, as it is difficult to see what the UK wants to achieve from the negotiations.
The UK government is expected to publish a series of position papers on the divorce bill and the Irish border issue over the coming months - one tranche before the third round of the negotiations and the second before the fourth round. Markets will focus on whether the UK is willing to compromise in order to reach an agreement. The Daily Telegraph reported that the UK is ready to pay a divorce bill of EUR40bn (against the EU's estimates in the range of EUR60-100bn) but only if the EU starts negotiations about the future relationship. A Downing Street source later denied the story. In our view, the divorce bill remains the biggest obstacle to the negotiations, not least given the weak minority government in the UK.
Due to PM May's weak position it is worth keeping an eye on the Conservative Party conference at the beginning of October, where Conservative rebels may try to overthrow her.
Over the coming 1-3M, we expect EUR/GBP to move higher still on the back of a strong EUR, political uncertainty and BoE repricing. We expect the cross to trade within the 0.90-0.92 trading range and specifically forecast it at 0.91 in 1M and 3M. Over 3-12M, we expect EUR/GBP to drift back below 0.90 on the back of potential for some clarification regarding the Brexit negotiations and valuations. However, as relative growth and relative monetary policy are expected to remain EUR/GBP supportive in the medium term, we see only modest downside potential in the year ahead. We target 0.90 in 6M and 0.88 in 12M.
Trade Idea: USD/CAD – Sell at 1.2770
USD/CAD - 1.2692
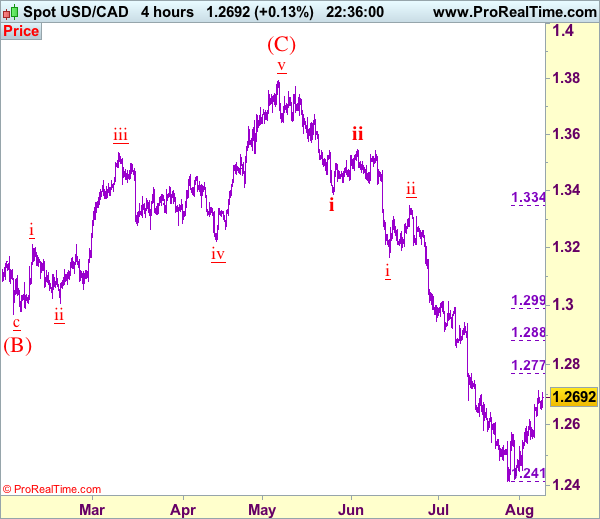
Recent wave: Only wave v of c has ended at 0.9407 and wave C of major A-B-C correction is underway with wave iii ended at 1.4690, wave v of C may bring one more marginal rise probably in 2018
Trend: Down
Original strategy :
Sell at 1.2770, Target: 1.2570, Stop: 1.2830
Position: -
Target: -
Stop: -
New strategy :
Sell at 1.2770, Target: 1.2570, Stop: 1.2830
Position: -
Target: -
Stop:-
As the greenback has maintained a firm undertone after staging a strong rebound from 1.2414, adding credence to our view that wave iii has possibly ended at 1.2414 last month and consolidation with initial upside bias is seen for wave iv correction to extend gain to1.2745-50, however, reckon upside would be limited to 1.2771 (previous resistance as well as 38.2% Fibonacci retracement of wave iii) and bring retreat later, below 1.2625-30 would bring test of 1.2540-50, break there would suggest the rebound from 1.2414 has ended instead, bring further fall to 1.2490-00 but reckon support at 1.2451 would hold on first testing. We are keeping our count that wave v as well as wave (C) ended at 1.3794 and impulsive wave (i ii, i ii) is now unfolding with minor wave iii possibly ended at 1.2414, hence wave iv correction is underway.
In view of this, would be prudent to stand aside for now and look to sell on further subsequent rebound as 1.2771 resistance should limit upside. Above 1.2800-10 would defer and risk a stronger correction to 1.2850, however, still reckon upside would be limited to 1.2880-85 (50% Fibonacci retracement of wave iii) and bring retreat later next week.
To recap, wave B from 1.3066 is unfolding as an a-b-c and is sub-divided as a: 1.2192, b: 1.2716 and wave c is a 5-waver with i: 1.1983, ii: 1.2506, extended wave iii with minor iii at 1.0206, wave iv ended at 1.0781 and wave v as well as wave iii has ended at 0.9931, hence the subsequent choppy trading is the wave iv which is unfolding as (a)-(b)-(c) with (a) leg of iv ended at 1.0854, followed by (b) leg at 1.0108 and (c) leg as well as the wave iv ended at 1.0674. The wave v is sub-divided by minor wave (i): 0.9980, (ii): 1.0374, (iii): 0.9446, (iv): 0.9913 and (v) as well as v has possibly ended at 0.9407, therefore, consolidation with upside bias is seen for major correction, indicated target at 1.3700 and 1.4000 had been met and further gain to 1.4700 would be seen later.
Trade Idea Update: USD/CHF – Buy at 0.9685
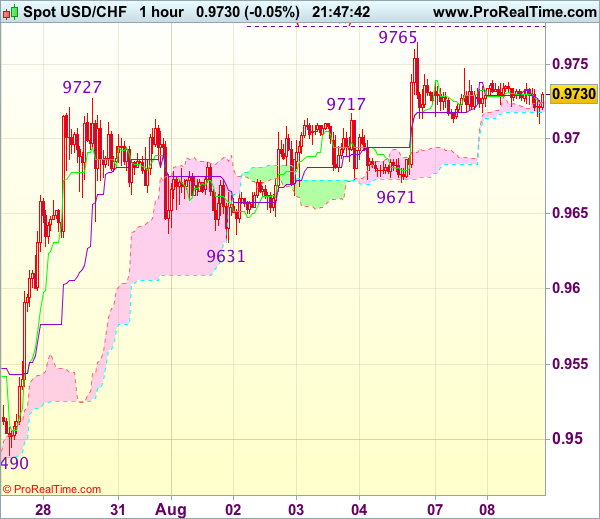
USD/CHF - 0.9733
Original strategy :
Buy at 0.9685, Target: 0.9785, Stop: 0.9650
Position : -
Target : -
Stop : -
New strategy :
Buy at 0.9685, Target: 0.9785, Stop: 0.9650
Position : -
Target : -
Stop : -
The greenback has traded narrowly since yesterday, retaining our view that consolidation below Friday’s high at 0.9765 would be seen, however, reckon downside would be limited to support at 0.9671 and bring another rise later, above said resistance at 0.9765 would signal recent upmove is still in progress, then further gain to 0.9775 (50% projection of 0.9438-0.9727 measuring from 0.9631) and later 0.9800-10 (61.8% projection) would follow but 0.9830-40 would hold from here, bring another retreat later.
In view of this, would not chase this rise here and would be prudent to buy dollar on pullback as 0.9680-85 should limit downside. Below 0.9671 support would defer and suggest top is possibly formed, risk test of support at 0.9631 but break there is needed to add credence to this view, bring retracement of recent rise to 0.9596 (previous resistance turned support).
Gold Awaits US CPI Data
Gold prices recovered somewhat during the European morning Tuesday, after ending the previous week on the back foot. The precious metal underperformed throughout most of the week amid an overall risk-on sentiment in markets, evident by major US stock indices like the Dow Jones breaking multiple all-time highs. Gold then took another hit on Friday following the release of upbeat US employment data for July and some optimistic comments on tax reform from the director of the National Economic Council. Without any risk events on the horizon over the next few days, we think that gold may trade quietly for now. The next major market mover for the precious metal may be on Friday, when we get the US CPI data for July.
XAU/USD traded higher during the European morning Tuesday, after consolidating above the key support of 1256 (S1) for the whole day on Monday. Since the 1st of August, the price has been trading within a downward sloping broadening wedge, and thus, we remain flat for now as the wedge may represent just a corrective phase. We need to see an upside escape before we get confident on the resumption of the prevailing uptrend. A break above the upper bound of the pattern could initially aim for the 1271 (R1) key resistance, while a break above that level will confirm a forthcoming higher high and may set the stage for extensions towards the 1280 (R2) obstacle.
Our short-term oscillators support somewhat our view. The RSI rebounded, broke back above 50, and now appears ready to challenge its own downside resistance line. If the indicator breaks above that line at the same time the metal exits the wedge, we believe that the price will have the necessary momentum to overcome the 1271 (R1) zone. As for the MACD, although negative, it bottomed and crossed above its trigger line.
Zooming out to the daily chart, we see that the metal continues to trade in the sideways range that's been in place since the end of January, between the 1200 and 1300 key barriers. The latest short-term uptrend began from near the lower bound of that range. As such, this increases the likelihood for further near-term advances, perhaps towards upper bound of the range, at 1300.
China Trade Slows in July But Yuan Hits 10-Month High
Chinese exports and imports both moderated in July, though they were still up a solid 7.2% and 11.0% respectively from a year ago. Exports were expected to grow by 10.9% after a 11.3% gain in June, while imports were forecast to rise by 16.6% following a 17.2% jump in the previous month.
The sharper slowdown in imports compared to exports led to the trade surplus increasing for the fifth straight month in July. China's trade surplus with the rest of the world stood at $46.7 billion in July, slightly above expectations of $46.08 billion and up from $42.8 billion in June.
The weaker figures for July have raised some concerns that both external and internal demand may be easing. However, the outlook for global demand remains bullish and China's economy is anyhow forecast to slow in the second half of this year so a further softening in import growth in the coming months is to be expected.
The Australian dollar - often seen as a liquid proxy for China's economy due to its export dependency - fell by about 0.3% after the trade figures to around $0.7912 before resuming its uptrend to rise to $0.7942 in European trade. The aussie was earlier boosted by positive business confidence data out of Australia, while concerns about a 2.4% annual drop in iron ore imports by China in July were short lived.
The yuan also shrugged off the disappointing data, as downside pressure continued to ease on the currency following a larger-than-expected increase in China's foreign currency reserves in July. Foreign exchange reserves rose to a 9-month high, reaching $3.081 trillion in July, beating forecasts of an increase to $3.069 trillion and up from $3.057 trillion in the prior month. The figures indicate the People's Bank of China has been less active in forex markets in defending the yuan due to a weaker US dollar alleviating the pressure on capital outflows. The central bank has also tightened capital controls and taken measures to curb speculators who had pushed the yuan to an 8½-low back in January.
In a dramatic reversal of fortunes for the dollar/yuan cross, the pair has been in a steady decline since January, depreciating by 3.8% over the period and driving the yuan to a near 10-month high of 6.6960 per dollar today.
Euro also Wins the Small Battles
The big battles in FX are the ones that matter--aggressive reversals and one directional +100 pip moves. But the small victories are often telling too. The euro was the top performer on Monday while the New Zealand dollar lagged. Expect a more lively market on Tuesday after holidays in Canada and Australia. The same can be said about USDJPY. China's trade balance rose to $46.8 bn in July, while imports advanced 11% instead of the expected 18%. A new Premium trade was issued yesterday 3 charts, added to the 6 existing trades (2 FX, 2 commodities and 3 indices).
The Monday after July non-farm payrolls is usually one of the quieter days of the year as Wall Street heads on vacation. USD continued its post-NFP momentum higher on a few fronts, but one exception was EUR/USD, which retraced nearly half of of Friday's 140-pip drop. EUR/USD hit a high .3 bn of 1.1814 but couldn't regain the 61.8% retracement of the fall to 1.1735. That comes in at 1.1820 and is a level to watch in the days ahead.
In any case, the way the euro was bid up without any news reflects prevalent optimism from the bulls and a positive sign going forward. Cable meanwhile touched a slightly lower low and floundered along the bottom. USD/CAD also continued higher to touch above 1.27 as oil slipped.
On the news front, Fed doves Kashkari and Bullard didn't offer anything fresh. The President headed away on a 17-day holiday but any thoughts that he might remain low key were erased by a typical tweetstorm attacking the media and touting the record high in the stock market, among other things.
Germany's trade surplus edged up EUR 22 bn, reminding the FX world of the nation's external account situation, which is a vital component in exchange rate determination. The US JOLTS are also due next.
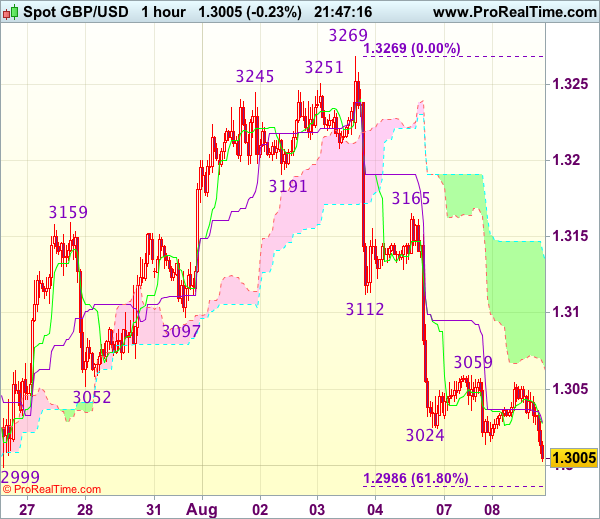
Trade Idea Update: GBP/USD – Sell at 1.3055
GBP/USD - 1.3003
Original strategy :
Sell at 1.3110, Target: 1.3010, Stop: 1.3145
Position : -
Target : -
Stop : -
New strategy :
Sell at 1.3055, Target: 1.2955, Stop: 1.3090
Position : -
Target : -
Stop : -
As cable has fallen again after faltering below resistance at 1.3059, suggesting recent decline from 1.3269 top has resumed and may extend further weakness to 1.2986 (61.8% Fibonacci retracement of 1.2812-1.3269) and possibly 1.2955-60, however, near term oversold condition should precinct sharp fall below previous chart support at 1.2933 and bring rebound later.
In view of this, would not chase this fall here and we are looking to sell cable on recovery as said resistance at 1.3059 should limit upside and bring another decline. Above 1.3090 would risk test of previous support at 1.3112 but only break there would signal low is formed instead.
Can OPEC Revive Oil Bulls?
There was little excitement in the oil markets during Tuesday's trading session; with investors on guard as OPEC and Non-OPEC members discussed compliance levels on their output cut agreement, in Abu Dhabi. Market players seem unfazed by the constant OPEC chatter, with skepticism increasing over the cartel's plans to improve compliance, after OPEC output hit a 2017 record high and exports marked a record. While OPEC remains optimistic that the current supply cut agreement may eventually rebalance the saturated markets, the lagging compliance from Iraq and resurgent production in Libya are threatening to undermine efforts made by the rest of the group to prop up oil prices. With Ecuador already pulling out of the OPEC agreement due to financial pressures, the clock is ticking and it will take more than pledges for the cartel to support oil prices moving forward.
If nothing new is brought to the table in the OPEC meeting and investors are left empty-handed once again, WTI Crude is at risk of depreciating further, as oversupply fears attract sellers. The bearish bias towards oil remains intact amid oversupply concerns and there is a risk of the OPEC deal falling apart before March 2018, if members do not see oil prices recover.
From a technical standpoint, WTI Crude has found comfort in a wide range on the daily charts with $48.50 acting a support and $50.30 a resistance. A breakdown below $48.50 should encourage a further depreciation towards $47.00. In an alternative scenario, a breakout above the $50.30 resistance should encourage a further movement towards $51.00.
Commodity spotlight - Gold
Gold bulls were back in action on Tuesday, with prices spiking towards $1264, as the Dollar lost its post-NFP mojo. With the economic calendar fairly light in the first half of the week, price action is likely to dictate where the yellow metal trades - with intraday bulls eyeing $1270. Much attention will be directed towards the US inflation numbers later this week, which should offer some clues on the pace of monetary tightening by the Federal Reserve.
Concerns over stubbornly low inflation have clouded the prospects of another US interest rate increase this year and investors will closely scrutinize the inflation figures to see if they have picked up. A soft inflation number below market expectations, should punish the Dollar and dent expectations of higher US interest rates - resulting in a boost of Gold prices. From a technical standpoint, Gold bulls were back in control after prices traded above $1260. A daily close above $1260 should encourage a further increase towards $1270. In an alternative scenario, repeated weakness under $1260 should encourage a further depreciation towards $1240.
EUR/GBP Mid-Day Outlook
Daily Pivots: (S1) 0.9027; (P) 0.9043; (R1) 0.9066; More
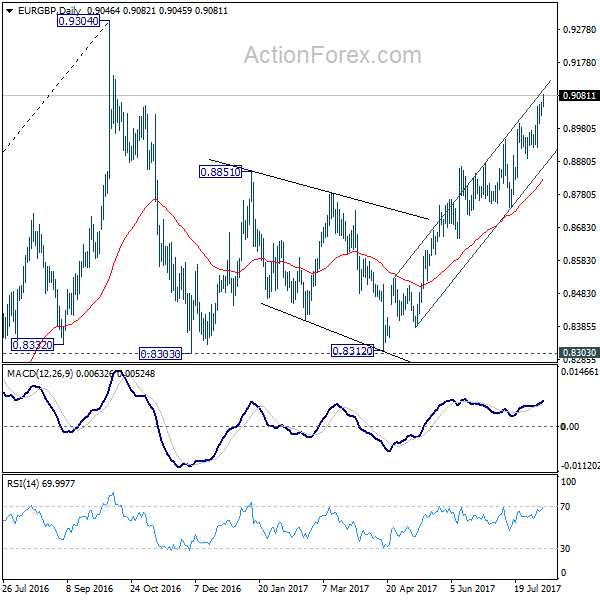
EUR/GBP's rally continues today and reaches as high as 0.9082 so far. Intraday bias remains on the upside. Current rise from 0.8312 should extend towards 0.9304 key high. At this point, there is no clear sign of up trend resumption yet. Hence, we'll be cautious on strong resistance from 0.9304 to limit upside and bring another fall. On the downside, below 0.8995 minor support will turn intraday bias neutral and bring consolidation before staging another rise.
In the bigger picture, price actions from 0.9304 are viewed as a medium term corrective pattern. It's uncertain whether it is finished yet. But in case of another fall, we'd expect strong support from 0.8116 cluster support (50% retracement of 0.6935 to 0.9304 at 0.8120) to contain downside and bring rebound. Whole up trend from 0.6935 is expected to resume after consolidation from 0.9304 completes.