Sample Category Title
Trade Idea Update: EUR/USD – Sell at 1.1840
EUR/USD - 1.1809
Original strategy :
Sell at 1.1840, Target: 1.1740, Stop: 1.1875
Position : -
Target : -
Stop : -
New strategy :
Sell at 1.1840, Target: 1.1740, Stop: 1.1875
Position : -
Target : -
Stop : -
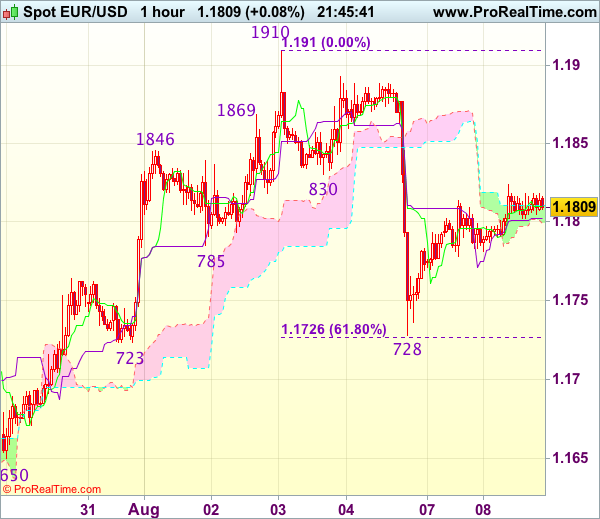
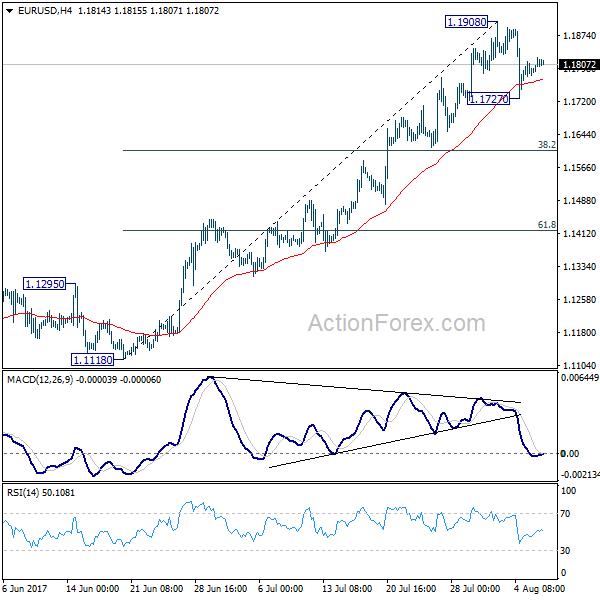
As the single currency edged higher after brief pullback, suggesting near term upside risk remains for the rebound from 1.1728 to extend gain to previous support at 1.1830, however, if our view that top has been formed at 1.1910 is correct, upside should be limited to 1.1850 and bring retreat later, below .1775-0 would suggest an intra-day top is formed, bring weakness to 1.1750, then retest of 1.1723-28 (previous support as well as 61.8% Fibonacci retracement of 1.1613-1.1910), break there would add credence to our view that top has been formed at 1.1910 last week, bring further fall to 1.1700 but reckon support at 1.1650 would remain intact.
In view of this, we are looking to sell euro again on further recovery as 1.1830 previous support should limit upside. Above 1.1855-60 would defer and risk a stronger rebound to 1.1875-80 but price should falter below said last week’s high at 1.1910, bring another decline later.
Trade Idea Update: USD/JPY – Hold long entered at 110.30
USD/JPY - 110.33
Original strategy :
Bought at 110.30, Target: 111.30, Stop: 109.95
Position : - Long at 110.30
Target : - 111.30
Stop : - 109.95
New strategy :
Hold long entered at 110.30, Target: 111.30, Stop: 109.95
Position : - Long at 110.30
Target : - 111.30
Stop : - 109.95
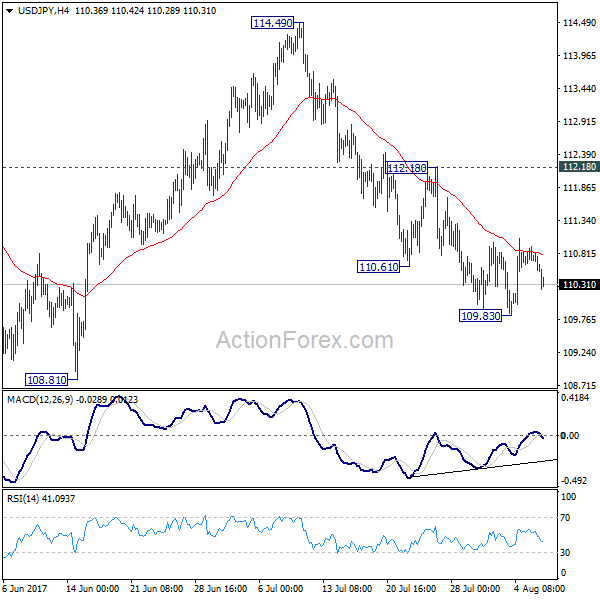
As the greenback has retreated again today, suggesting near term downside risk remains for marginal weakness from here, however, if our view that a temporary low formed at 109.85 last week is correct, downside should be limited and 110.00 should hold, bring another rebound later, above 110.90-95 would extend the rebound from 109.85 for retracement of recent decline towards 111.29-30 (previous resistance and 61.8% Fibonacci retracement of 112.20-109.85), having said that, break there is needed to add credence to this view, bring a stronger rebound to 111.50 but price should falter below another previous resistance at 111.71.
In view of this, we are holding on to our long position entered at 110.30. Below 110.00 would signal the rebound from 109.85 has ended, bring retest of this level, below there would extend recent decline to 109.70 and later towards 109.50.

GBP/USD Mid-Day Outlook
Daily Pivots: (S1) 1.3011; (P) 1.3034; (R1) 1.3056; More...
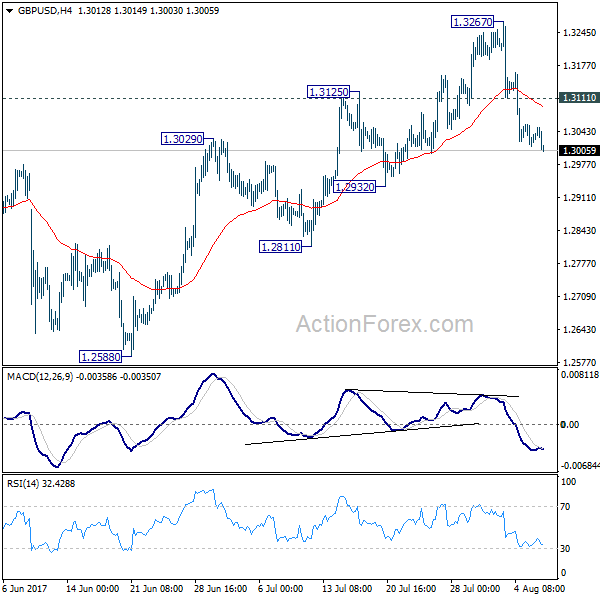
GBP/USD's fall from 1.3267 is still in progress and intraday bias stays on the downside for 1.2932 support first. Price actions from 1.1946 are seen as a corrective pattern, no change is this view. Such correction could have completed at 1.3267 already. Break of 1.2932 will affirm this bearish case and target 1.2588 key near term support for confirmation. On the upside, however, above 1.3111 minor resistance will turn bias back to the upside for 1.3267 instead.
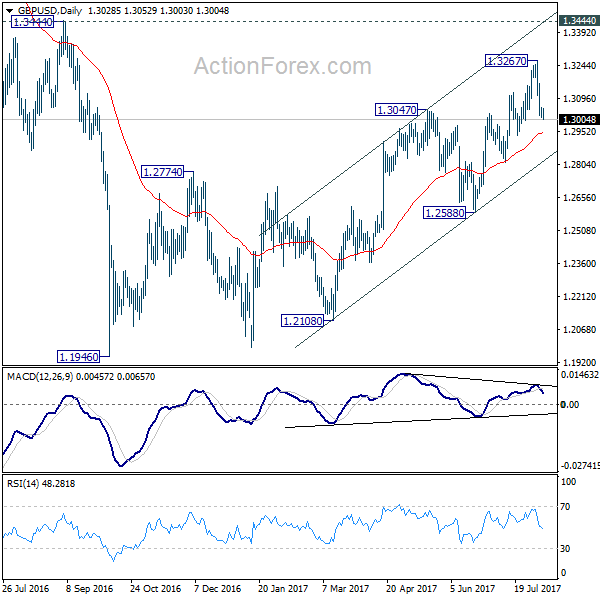
In the bigger picture, overall, price actions from 1.1946 medium term low are seen as a corrective pattern that is still in progress. While further upside is expected, larger outlook remains bearish as long as 1.3444 key resistance holds. Down trend from 1.7190 (2014 high) is expected to resume later after the correction completes. And break of 1.2588 will indicate that such down trend is resuming.
EUR/USD Mid-Day Outlook
Daily Pivots: (S1) 1.1769; (P) 1.1792 (R1) 1.1816; More...
Intraday bias in EUR/USD remains neutral for the moment. As noted before, a short term top is formed at 1.1908 on divergence condition in 4 hour MACD. Deeper correction is expected as long as 1.1908 holds. Below 1.1727 minor support will turn bias to the downside for 38.2% retracement of 1.1119 to 1.1908 at 1.1606. We'd expect strong support there to bring rebound.
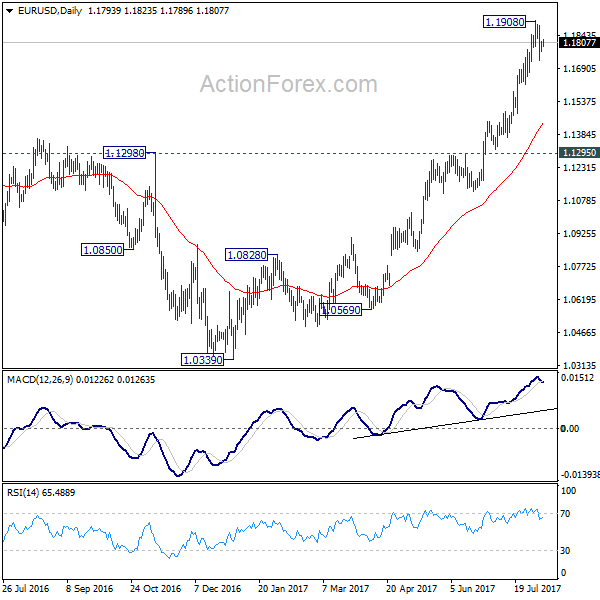
In the bigger picture, an important bottom was formed at 1.0339 on bullish convergence condition in weekly MACD. Sustained break of 55 month EMA (now at 1.1760) will pave the way to key fibonacci level at 38.2% retracement of 1.6039 (2008 high) to 1.0339 (2017 low) at 1.2516. While rise from 1.0339 is strong, there is no confirmation that it's developing into a long term up trend yet. Hence, we'll be cautious on strong resistance from 1.2516 to limit upside. But for now, medium term outlook will remain bullish as long as 1.1295 support holds, in case of pull back.
USD/CHF Mid-Day Outlook
Daily Pivots: (S1) 0.9713; (P) 0.9729; (R1) 0.9748; More...
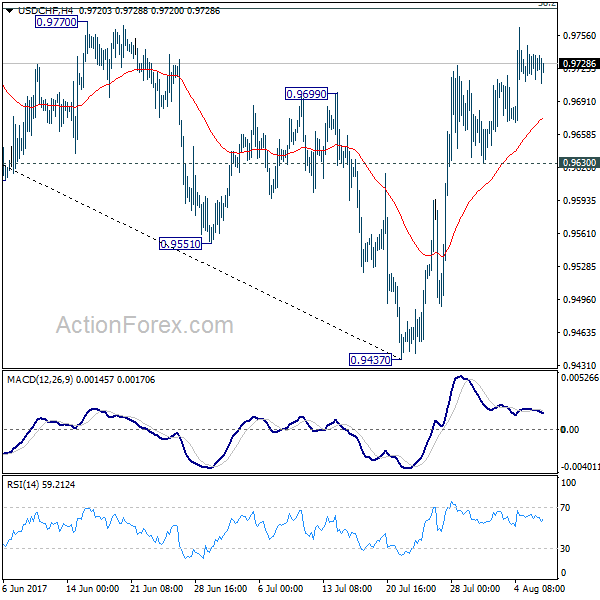
No change in USD/CHF's outlook. With 0.9630 minor support intact, further rise is expected to 38.2% retracement of 1.0342 to 0.9437 at 0.9783 first. As noted before, prior break of 0.9699 resistance suggests near term reversal after defending 0.9443 key support. Break of 0.9783 will target channel resistance (now at 0.9887). On the downside, break of 0.9630, however, will indicate completion of the rebound and turn bias back to the downside for 0.9437.
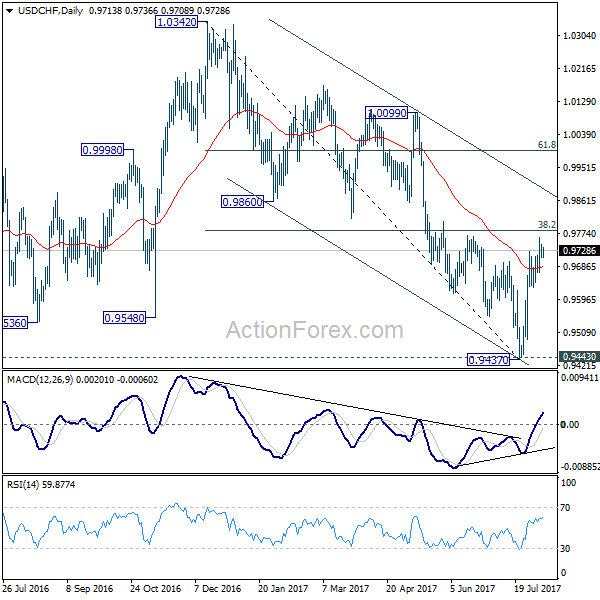
In the bigger picture, current development argues that USD/CHF has successfully defended 0.9443 key support level. And long term range trading in 0.9443/1.0342 is extending with another rise. At this point, there is no sign of an up trend yet. Hence, while further rise is expected in USD/CHF, we'll start to be cautious on loss of momentum above 61.8% retracement of 1.0342 to 0.9437 at 0.9996.
USD/JPY Mid-Day Outlook
Daily Pivots: (S1) 110.60; (P) 110.76; (R1) 110.88; More...
USD/JPY was rejected by 4 hour 55 EMA and continues to weaken today. But at this point, it's still staying above 109.83 temporary low. Intraday bias remains neutral for the moment. The consolidation from 109.83 might extend and another rise cannot be ruled out. But after all, near term outlook stays bearish as long as 112.18 resistance holds and deeper fall is expected. Break of 109.83 will target 108.81 support first. Break there will resume whole correction from 118.65 and target 61.8% retracement of 98.97 to 118.65 at 106.48. Nonetheless, break of 112.18 resistance will dampen our bearish view and turn focus back to 114.49 resistance instead.
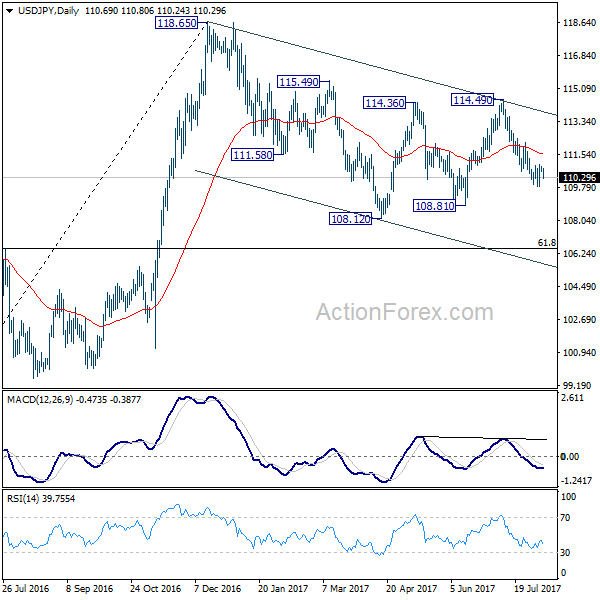
In the bigger picture, the corrective structure of the fall from 118.65 suggests that rise from 98.97 is not completed yet. Break of 118.65 will target a test on 125.85 high. At this point, it's uncertain whether rise from 98.97 is resuming the long term up trend from 75.56, or it's a leg in the consolidation from 125.85. Hence, we'll be cautious on topping as it approaches 125.85. If fall from 118.65 extends lower, down side should be contained by 61.8% retracement of 98.97 to 118.65 at 106.48 and bring rebound.
GBP/JPY Mid-Day Outlook
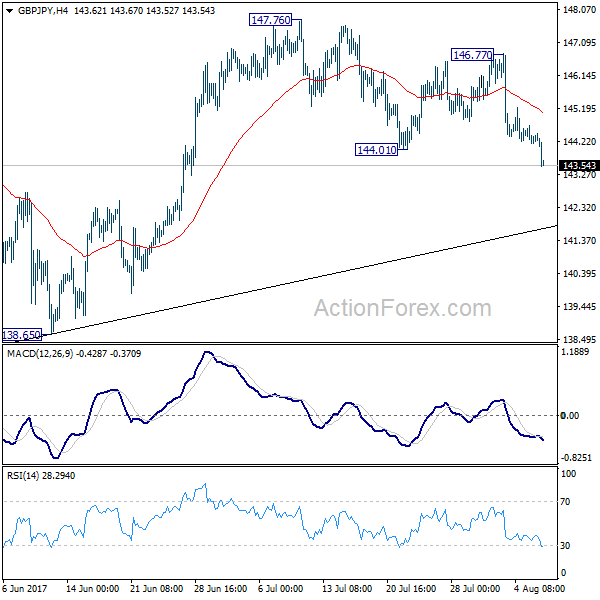
Daily Pivots: (S1) 144.08; (P) 144.40; (R1) 144.62; More
GBP/JPY drops to as low as 143.51 so far today. Break of 144.01 support confirms resumption of fall from 147.76 and intraday bias is now on the downside for trend line support (now at 141.87). Further break there will target 135.58/138.65 support zone. As GBP/JPY is seen as staying in consolidation pattern from 148.42, we'd expect strong support from 135.58 to contain downside. On the upside, break of 146.77 is needed to signal completion of the fall from 147.76. Otherwise, near term outlook will now be cautiously bearish even in case of recovery.
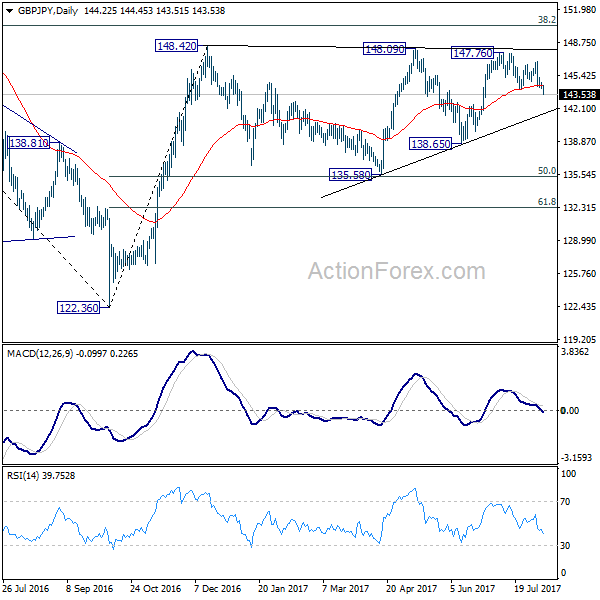
In the bigger picture, rise from medium term bottom at 122.36 is expected to continue to 38.2% retracement of 196.85 to 122.36 at 150.43. Decisive break there will carry long term bullish implications and pave the way to 61.8% retracement at 167.78. In case the sideway pattern from 148.42 extends, we'd be looking for strong support from 135.58 and 50% retracement of 122.36 to 148.42 at 135.39 to contain downside.
Sterling Suffers Renewed Selling as Yen Buying Emerges
Sterling suffers renewed selling in generally quiet markets today. EUR/GBP is extending recent rise to as high as 0.9080 so far. GBP/USD is set to test on 1.3 handle. GBP/JPY is the biggest mover today as also affected by broad based rebound in yen. GBP/JPY's break of 144.01 near term support now opens up deeper fall to trend line support at around 142.00. Staying in the currency markets, New Zealand Dollar remains the weakest one as markets anticipate a dovish RBNZ statement later in the week. Canadian Dollar is the second weakest one as WTI crude oil continues to struggle to regain 50 handle. Euro is maintaining its status as the strongest one for the week while Dollar is mixed.
Distorted ECB bond purchase drove down Italian German spread
According to data from ECB, the central bank snapped up EUR 9.6b of Italian bonds in July, hitting that highest level since the launch of QE back in March 2015. That's also nearly EUR 1.5b above what the composition of the asset purchase dictates. On the other hand, purchase of German bonds stayed below the level on the capital key rules for the fourth straight months. It's see as a trend recently that ECB is deviating from the capital key rules. And that's one of the reasons that drove Italian-German spread down to the lowest level of the year. Released from Eurozone, German trade surplus widened to EUR 21.2b in June.
Swiss weakness more on policy divergence
From Swiss, unemployment rate was unchanged at 3.2% in July, in line with consensus. The Swiss Franc was the biggest loser last month and has only stabilized in past week or two. The broad-based selloff of Swiss franc of late has raised speculations of renewed SNB intervention. Yet, the latest release of FX reserve and sight deposit data suggest that it was unlikely the cause. We believe franc's depreciation, especially against the euro was mainly driven by yield differential as the ECB is approaching tapering of its asset purchase program while the SNB maintained the pledge to fight against deflation. The recent risk-on mode in the financial market has also raised franc's appeal as funding currency, thereby exacerbating its decline. More in CHF Weakness More On Policy Divergence Than Intervention, FX Reserve And Sight Deposit Suggested.
Dollar rebound limited by cautious Fed comments
Dollar's rebound attempt is limited by cautious comments from Fed officials, and lack of economic data as drivers. St. Louis Fed President James Bullard said that he is "ready to get going in September" regarding unwinding Fed's balance sheet". But he emphasized that it is going to be "very slow" and there won't be a lot of impact on the markets. On the other hand, Bullard believes that "the current level of the policy rate is likely to remain appropriate over the near term." Minneapolis Fed President Neel Kashkari said that "inflation has been coming up short, a little low, relative to our two percent target." And, "it actually matters that investors believe the Fed can achieve its goals, because then if there's a future crisis and we really need people to believe in us, we've earned and established that credibility."
Australia business conditions jumped to 9 year high
Australia NAB business confidence jumped to 12 in July, up from 8. Business conditions index rise 1 point to 15, hitting the highest level since early 2008. The business conditions index also sit at three times the long-run average of 5. NAB chief economist Alan Oster noted that "the persistent strength in employment conditions has made us a little more optimistic about the near-term outlook for the labor market." And the result was consistent with annual job growth of around 240k. Nonetheless, "price and wage measures in the survey generally weakened again in the month, partly a reflection of elevated rates of underemployment." For RBA, the "signs of inflation pressures remain elusive."
China trade data point to downward trend
From China, trade surplus widened to USD 46.7b in July. Exports rose 7.2% yoy, slowest pace since February and notably lower than 11.3% yoy rise in the prior month. Exports growth was also well below market expectation of 10.9% yoy. Imports rose 11.0% yoy, slowest since December and sharply lower from 17.2% yoy in the prior month. Import growth was also well below market expectation of 16.6% yoy. Some economists noted that the trade data points to a downward trend in both external and domestic demand.
GBP/JPY Mid-Day Outlook
Daily Pivots: (S1) 144.08; (P) 144.40; (R1) 144.62; More
GBP/JPY drops to as low as 143.51 so far today. Break of 144.01 support confirms resumption of fall from 147.76 and intraday bias is now on the downside for trend line support (now at 141.87). Further break there will target 135.58/138.65 support zone. As GBP/JPY is seen as staying in consolidation pattern from 148.42, we'd expect strong support from 135.58 to contain downside. On the upside, break of 146.77 is needed to signal completion of the fall from 147.76. Otherwise, near term outlook will now be cautiously bearish even in case of recovery.
In the bigger picture, rise from medium term bottom at 122.36 is expected to continue to 38.2% retracement of 196.85 to 122.36 at 150.43. Decisive break there will carry long term bullish implications and pave the way to 61.8% retracement at 167.78. In case the sideway pattern from 148.42 extends, we'd be looking for strong support from 135.58 and 50% retracement of 122.36 to 148.42 at 135.39 to contain downside.
Economic Indicators Update
| GMT | Ccy | Events | Actual | Forecast | Previous | Revised |
|---|---|---|---|---|---|---|
| 23:01 | GBP | BRC Retail Sales Monitor Y/Y Jul | 0.90% | 0.60% | 1.20% | |
| 23:50 | JPY | Current Account (JPY) Jun | 1.52T | 1.51T | 1.40T | |
| 01:30 | AUD | NAB Business Confidence Jul | 12 | 9 | 8 | |
| 02:00 | CNY | Trade Balance (USD) Jul | 46.7B | 45.3B | 42.8B | |
| 02:00 | CNY | Trade Balance (CNY) Jul | 321.2B | 292B | 294B | |
| 05:00 | JPY | Eco Watchers Survey Current Jul | 49.7 | 49.7 | 50 | |
| 05:45 | CHF | Unemployment Rate Jul | 3.20% | 3.20% | 3.20% | |
| 06:00 | EUR | German Trade Balance (EUR) Jun | 21.2B | 22.3B | 20.3B | |
| 14:00 | USD | JOLTS Job Openings Jun | 5.66M | 5.67M |
NZD/USD Breakdown Needs Confirmation
Price managed to break below the 23.6% retracement level and below the 0.7375 static support (support turned into resistance). Has increased today and could come back to retest the broken levels, will drop towards the fourth warning line (wl4) if will stabilize below these obstacles.
GOLD Throwback Underway
Gold bounced back from the warning line (WL1) as expected and should try to reach and retest the first upside target from the 38.2% retracement level ($1282). Will climb towards the mentioned obstacle only if it will close above the 1274.05 previous high.
The minor decrease has confirmed the warning line (WL1) and now tries to approach new peaks on the short term. We have a major resistance near the $1295 per ounce, will reach this area if the USDX will slide further.