Sample Category Title
USD/CHF Valid Breakout?
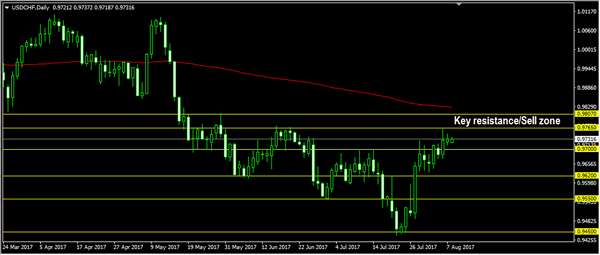
USD/CHF decreased today and maybe you wonder if the rebound is completed and if will start another leg lower on the short term. Price is trading in the red and looks determined to drop much deeper in the upcoming hours as the USD is weakened by the USDX's minor retreat.
Maybe a decrease is natural after the impressive rally and after the USDX's impressive jump. The dollar index could still decrease in the upcoming days, only a failure to drop below the 92.55 and to retest the 92.49 major static support will signal a reversal. We may have a minor accumulation on the dollar index these days because needs to recapture more bullish energy before will really start another upside movement.
The CHF increased a little as the Switzerland Unemployment Rate remains steady at 3.2% in July, matching expectations. The US is to release the JOLTS Job Openings later, the greenback needs a bullish spark to be able to take the lead again.
Price has broken above the median line (ml) of the minor descending pitchfork, has failed to reach and retest the 250% Fibonacci line and now has come back to retest the broken median line (ml). Will increase towards the next upside targets (0.9787, 250% and the upper median line) if the dynamic support will hold.
We may have a buying opportunity if will decrease along the median line (ml) and if it will retest the second warning line (WL2) of the major ascending pitchfork. Is still under some pressure as long as is trading within the descending pitchfork's body.
Canadian Dollar Inches Higher, Markets Eye US Jobs Report
The Canadian dollar has ticked higher on Tuesday. Currently, USD/CAD is trading at 1.2670, down 0.03% on the day. In the US, today's major event is US JOLTS Jobs Openings, which is expected to improve to 5.74 million. On Wednesday, the US releases two employment indicators – Preliminary Nonfarm Productivity and US Preliminary Unit Labor Costs. Canada will release Building Permits.
The Canadian dollar has posted strong gains against the greenback in recent weeks, gaining 6.0% since June 1. Investor appetite for the US dollar, as political risk has been growing and there are doubts if the Fed will raise rates before 2018. President Trump's administration seems rudderless and Trump's inability to pass healthcare legislation has increased political risk in the US. As well, the Federal Reserve's monetary policy remains unclear. Earlier this year the Fed strongly hinted that it planned to raise rates three times in 2017, but has only pressed the rate trigger twice. In June, Fed Chair Janet Yellen shrugged off low inflation, saying that it was due to "transient" factors, leaving the impression that the Fed still planned one final hike. However, inflation has not improved and the Fed has changed its tune. Last week, St. Louis Federal Reserve President James Bullard said he opposed further Fed hikes, warning that another hike would actually delay inflation from hitting the Fed's target of 2%. The markets have become more skeptical about a rate hike in December, as the odds have fallen to 33%, compared to 43% a week ago. In contrast to the Fed, it's full steam ahead for the Bank of Canada. The bank raised interest rates in July and the improving economy could mean that more rate increases lie ahead. In May, annualized GDP was up 4.6%, and the labor market continues to produce jobs. The increase in oil prices has revived the economy has also pushed the Canadian dollar higher.
The US economy continues to grapple with weak inflation, which is also apparent in the labor market. Although the nonfarm payrolls report in July easily beat expectations and the unemployment rate dropped from 4.4% to 4.3%, wage growth remains a sore point. In July, Average Hourly Earnings remained unchanged at 0.3%, and the indicator has failed to break above 0.3% in 2017. The weakness in earnings growth has puzzled economists, as a red-hot labor market should translate into higher wages. In fact, wage growth has actually slowed in 2107, and this could have significant economic repercussions, as consumers are responding by holding tight on the purse strings and reducing spending.
South African Rand Higher On Expectations Zuma Is Removed
Tuesday August 8: Five things the markets are talking about
Capital markets appear to be in a holding pattern, with investors seeking an incentive amid the summer slowdown.
The focal point of this week looks set to be Friday's U.S inflation data (CPI 08:30 am EDT), which could be key to the interest-rate outlook for the U.S.
Note: Two Fed officials (Kashkari and Bullard) indicated yesterday “soft U.S inflation remains a problem,” but played down the risk of market disruption when the Fed begins shrinking its balance sheet.
Last week's stellar U.S jobs report is encouraging a number of renewed bets that U.S reflation is back in vogue.
Despite the odds for further tightening by the Fed remaining under +50%, dollar ‘bulls' continue to search for evidence from Fed speakers this week to the contrary.
1. Stocks mixed results
Yesterday, the Dow posted an all-time high for the ninth consecutive session, touching 22,121, before closing slightly lower.
In Japan overnight, the Nikkei share average slid -0.3% as a stronger yen (¥110.55) hurt exporters, offsetting gains in the steel sector based on a solid earnings outlook. The broader Topix shed -0.2%.
In Hong Kong, shares rallied as strong company earnings and surging prices for steel and other building materials convinced the market that China's economy remains solid despite weaker-than-expected trade data.The Hang Seng index ended up +0.6%, while the China Enterprises Index gained +0.2%.
Note: Trade data showed that China's import and export growth slowed more than expected in July – ¥321.2B vs. ¥297.4Be; exports y/y: +11.2% vs. +15.2%e, imports y/y: +14.7% vs. +22.6%e
In China, stocks edged slightly higher overnight in quiet trading as investors shrugged off the disappointing trade data. The blue-chip CSI300 index rose +0.2%, while the Shanghai Composite Index gained +0.1%.
In Europe, equities opened down, but have since turned around with support from commodities (gold and oil). It seems macro data is having little impact on direction, as too is risk sentiment.
U.S stocks are set to open in the red (-0.1%).
Indices: Stoxx50 flat at 3,503, FTSE -0.2% at 7,520, DAX -0.1% at 12,250, CAC-40 flat at 5,206, IBEX-35 +0.1% at 10,690, FTSE MIB -0.1% at 22,011, SMI -0.1% at 9,146, S&P 500 Futures -0.1%

2. Oil prices steady as Saudi cuts next months supplies, gold higher
Oil prices steadied overnight on news of lower crude supplies from Saudi Arabia offset higher production from other large exporters.
The Saudi's are expected to cut allocations worldwide in September by at least -520k bpd – inline with OPEC's previous pledge to boost oil prices.
However, despite their pledge, global oil production remains relatively high.
Benchmark Brent crude is up +5c at +$52.42 a barrel, while U.S light crude (WTI) is +10c cents higher at +$49.49.
Crude bulls cite a stabilizing U.S rig count, falling domestic inventories and the Saudi cut in exports as support, while the ‘bears' are leaning on robust production growth from the U.S, Libya and Nigeria.
Note: Production from Libya's Sharara field is returning to normal after a disruption caused by protesters.
OPEC output hit a 2017-high in July and its exports were at record levels.
Officials from a joint OPEC and non-OPEC technical committee are meeting in Abu Dhabi today to discuss ways to increase compliance with the deal to cut -1.8m bpd in production.
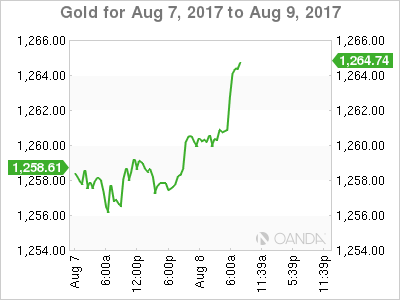
Gold prices (+0.2% at +$1,259.41 per ounce) have edged up overnight as the ‘big' dollar eased slightly, with the market waiting for Friday's U.S inflation numbers for hints on the pace of monetary tightening by the Fed.
3. Yields mixed results
German 10-year Bund yields (-1 bps to +0.46%) continue to trade atop of their one-month low yield, supported by expectations that any withdrawal of ECB stimulus will be gradual. This view is supported by yesterday's data showing industrial output in the eurozone's biggest economy unexpectedly fell -1.1% in June m/m.
In Japan, JGB's prices were mostly steady overnight after an auction of 30-year debt proceeded smoothly and drew ample investor demand. The two-year yield was flat at -0.11% and the 10-year yield inched down to +0.07%. The 30-year yield was flat at -0.875%.
Elsewhere, the yield on U.S 10-years has backed up less than +1 bps to +2.26%, while U.K Gilts are trading at +1.14%.
4. Dollar little changed in slow trading
The USD is trying to hold on to its small gains registered after last week's stellar payrolls report. However, this task is becoming more difficult with the markets pricing in less than a +50% chance that the Fed will hike overnight rates at least one more time this year.
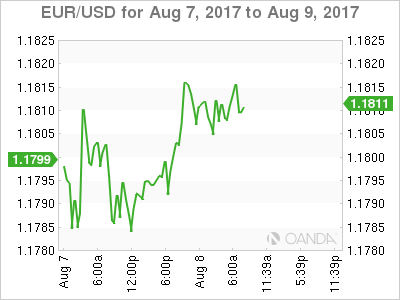
Current price action remains somewhat non-committal as market participants look ahead to Friday's U.S CPI data for more guidance on rates. The EUR/USD (€1.1810) is steady and holding above the psychological €1.18 handle despite some disappoint data out of Germany (see below).
South Africa's secret ‘no confidence vote' against President Zuma is expected to keep ZAR ($13.1482) volatility high. Yesterday, ZAR firmed over +1.5% after the Parliamentary speaker announced the secret ballot. Dealers believe that if the vote does oust President Zuma (he has survived six previous no-confidence votes), then the ZAR could be pushed significantly higher in the short-term. If the ‘no-confidence' fails, expect the rand to come under renewed pressure.
To remove Zuma from office, the opposition needs 201 votes and at least 50 parliament members of the governing party need to vote against him.

5. German exports and imports slump in June
Data this morning showed that German exports fell more than expected in June and imports sank even more sharply, widening the trade surplus in Europe's biggest economy.
Seasonally adjusted, exports dropped by -2.8%, the sharpest fall in 24-months that ended five consecutive months of growth.
German imports were down -4.5%, the biggest drop since January 2009.
Note: Both headline figures confounded expectations that had pointed to exports edging down -0.3% and imports rising by +0.2%.

CHF Weakness More On Policy Divergence Than Intervention, FX Reserve And Sight Deposit Suggested
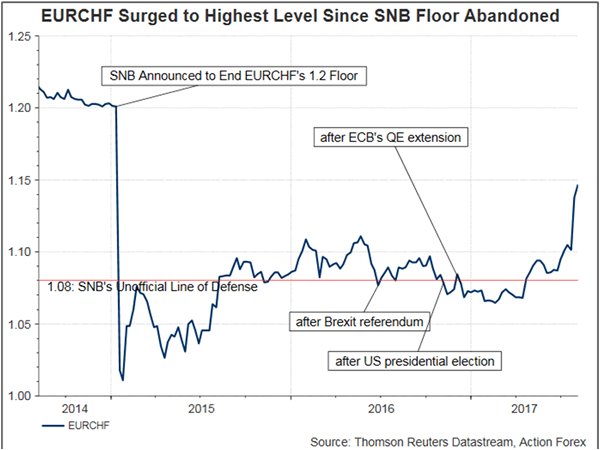
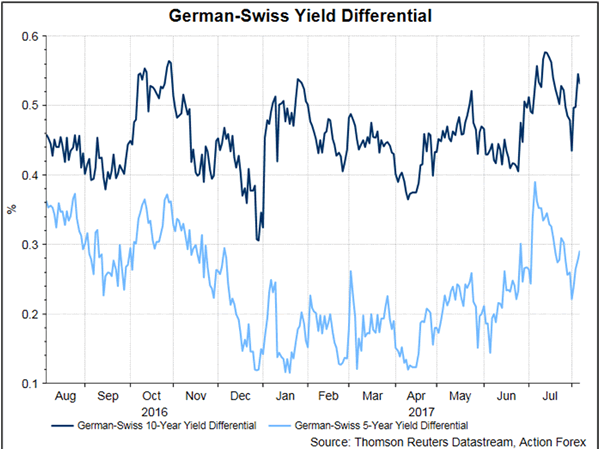
The broad-based selloff of Swiss franc of late has raised speculations of renewed SNB intervention. Yet, the latest release of FX reserve and sight deposit data suggest that it was unlikely the cause. We believe franc's depreciation, especially against the euro was mainly driven by yield differential as the ECB is approaching tapering of its asset purchase program while the SNB maintained the pledge to fight against deflation. EURUSD soared over +4% over the past two weeks while USDCHF gained about +3% during the period. The recent risk-on mode in the financial market has also raised franc's appeal as funding currency, thereby exacerbating its decline.
FX Reserves
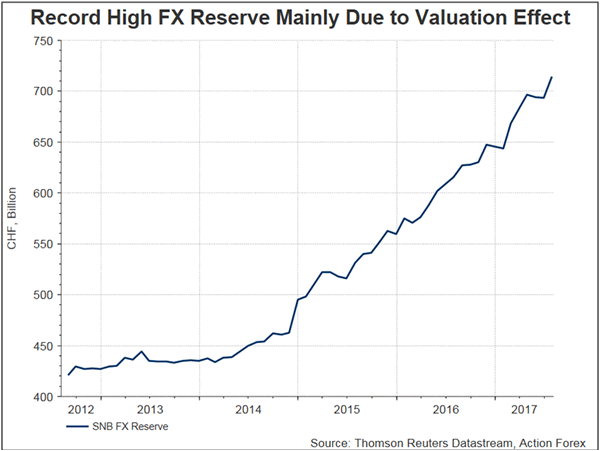
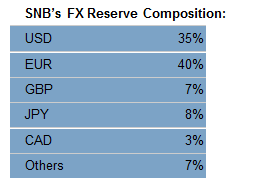
SNB's FX reserves rose to 714.3B franc in July, from 693.7B franc in the prior month. Yet, our estimate suggests that most of the +3% increase was due to valuation effect. Concerning the central bank's allocation of FX reserve, about 40% was in euro while 35% in US dollar. The rest was allocated to British pound (7%), Japanese pound (8%) and Canadian dollar (3%) and others (7%). In July, the euro and US dollar rose +4.15% and +0.75%, respectively, against franc, while pound, yen and Canadian gained against the franc, by +2.25% , +2.79% and +4.63%, respectively. Altogether, valuation effect raised the FX reserve by +2.5% in July, while the remaining +0.5% increase was driven by possible intervention.
Sight Deposits
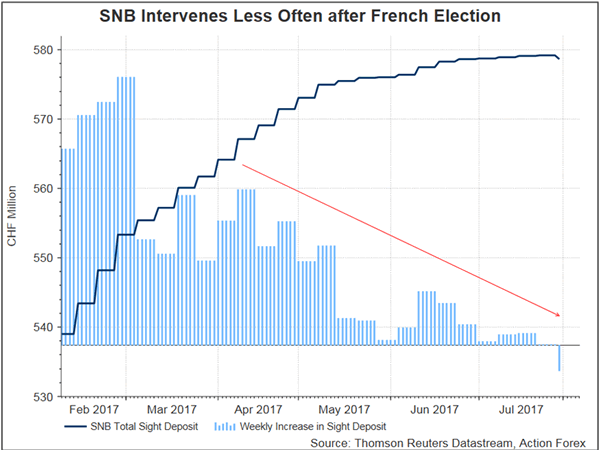
Indeed, the latest sight deposit data also signaled that SNB had not intervened aggressively in July. The SNB can expand the deposit through FX swaps and repurchases of its own debt. It is a usual way that the SNB intervene to depreciate its currency. Sight deposit stayed largely unchanged at 578.6M franc in July
Policy divergence
Although the ECB has maintained its policy rates at record lows and the asset purchase program unchanged at a monthly rate of 60B euro since April. Some moves over the past two months have showed that the central bank has turned more hawkish. Policymakers removed the reference at the June meeting statement that interest rates might be lower from the current levels. President Mario Draghi's speech in Sintra, Portugal in late June indicated that Eurozone's recovery has strengthened and broadened. He also noted that“deflationary forces have been replaced by reflationary ones”. Meanwhile, the June meeting minutes unveiled that policymakers had discussed about adjusting the QE reference stressing the central bank's readiness to increase the pave and /or duration of the asset purchases if necessary, but eventually decided to retain it. Although Draghi attempted the downplay expectations of QE adjustment at the July meeting, his comment that policymakers might begin the discussion in the fall lifted the EURUSD to the highest level in 2 years.
Meanwhile, SNB reiterated the pledge to intervene the exchange rate in June. Chairman Thomas Jordan stressed that the central bank followed “exactly the situation in the foreign exchange market, we look at the pressure, and then we decide what to do in foreign exchange interventions'. At an interview two weeks ago, Jordan insisted that Swiss franc remained “significantly overvalued”. Inflation developments suggest SNB would have to maintain the current stance. SNB downgraded in June its inflation forecast to +0.3% for 2018 (from +0.4%) and to 1% for 2019 (from +1.1%). The outlook for 2017 stayed unchanged at +0.3%. The latest data showed that headline CPI improved modestly to +0.3% y/y in July, from +0.2% a month ago. Yet, from a month ago, inflation contracted -0.3%, worsening from -0.1% in June. Soft inflation suggests that the number one task for the central bank remains the fight against deflation
If the economic developments continue the current trend, we expect the policy divergence between ECB and SNB would remain, thus widening yield differential and prolonging franc's weakness.
U.S. Inflation Key Data Being Eyed This Week
U.S. Dollar Is Holding Onto Friday's Gains. The U.S. dollar steadied on Tuesday, but clung to most of its gains following Friday's robust payrolls report, as investors await inflation data this week that may signal a turnaround in the currency's weakness this year. The dollar index, which tracks the greenback against six major rival currencies, was down 0.1 percent to 93.449. U.S. PPI for July due on Thursday and CPI figures on Friday should confirm whether labor market strength is spilling over into inflation.
Euro Stronger vs Greenback. Meanwhile, the euro shrugged off an unexpected fall in German industrial production in June and was up 0.19 percent against the dollar.
Gold Finding A Bottom. Gold looks directionless moving in tight range at $1,260 level. Eventually it should resume the recent uptrend. An initial move to $1,300 is certainly in reach. The dollar is gaining strength; however, it appears that gold has already priced in a stronger dollar. Expectations of a Fed move at some point towards year-end seem to have resurfaced after the solid July's payrolls report, putting the demand for the safe haven metal under extra downside pressure.
Daily Technical Analysis: EURUSD, GBPUSD, USDJPY, USDCHF
EURUSD
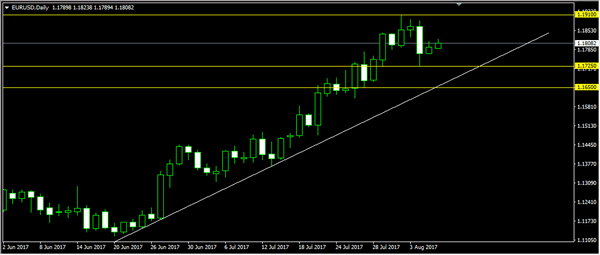
The EURUSD didn't make significant movement yesterday. The bias is neutral in nearest term but overall I remain bullish. Immediate support is seen around 1.1770 (yesterday's low). A clear break below that area could trigger further bearish pressure testing 1.1720 support area which is a good place to buy. Immediate resistance is seen around 1.1850. A clear break above that area could trigger further bullish pressure retesting 1.1910 which need to be clearly broken to the upside to continue the bullish scenario targeting 1.2000 region. On the downside, only a clear break below 1.1650 would interrupt the bullish outlook.
GBPUSD
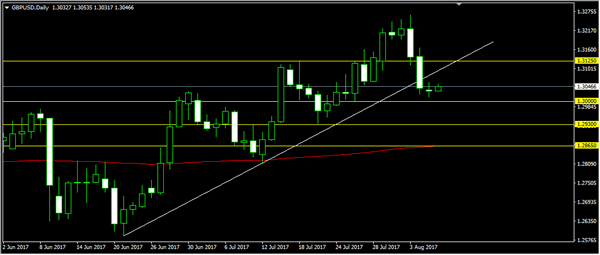
The GBPUSD was indecisive yesterday. The bias is neutral in nearest term probably with a little bearish bias testing 1.3000. A clear break below that area could trigger further bearish pressure testing 1.2930 – 1.2865 area. Immediate resistance is seen around 1.3060. A clear break above that area could trigger further bullish pressure testing 1.3125 area which need to be clearly broken to the upside to reactivate my bullish mode retesting 1.3265 region.
USDJPY
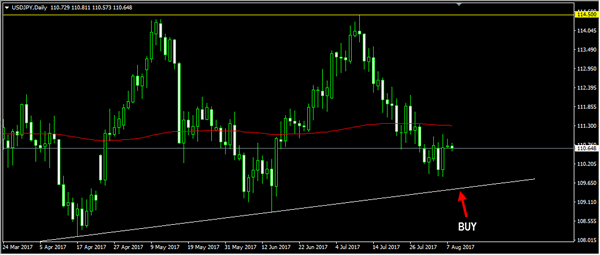
The USDJPY was indecisive yesterday. The bias is neutral in nearest term. Overall price is still in a bearish phase since fell from 114.50 last month testing a trend line support as you can see on my daily chart below, located around 109.50/00 which remains a good place to buy with a tight stop loss. Immediate resistance is seen around 111.25. A clear break and daily close above that area could trigger further bullish pressure testing 112.00 region or higher. On the downside, a clear break below the trend line support and 109.50/00 would activate my bearish mode.
USDCHF
The USDCHF was indecisive yesterday. The bias is neutral in nearest term. Overall price is still in a bullish phase since bounced-off 0.9450 key support two weeks ago but still respects 0.9765 – 0.9807 key resistance which remains a good place to sell. Immediate support is seen around 0.9700. A clear break below that area could trigger further bearish pressure testing 0.9660 or lower. On the upside, a clear break above 0.9807 would expose 0.9900/65 region.
Market Update – European Session: German Trade Components Disappoint, Little Reaction Seen In Price Action
Notes/Observations
German exports and imports slump in Jun. Exports saw their 1st decline in 6 months and largest fall since Aug 2015 while imports saw its biggest decline since January 2009 (Exports M/M: -2.8% v +0.2%e; Imports: M/M: -4.5% v +0.2%e)
Focus on South Africa's secret ballot no confidence vote on President Zuma
Overnight
Asia:
China July Trade Balance higher than expectations ($46.7B v $45.0Be) while components underwhelmed. Exports slowed for the 5th consecutive month (+11.2% v +15.2%e)
Europe:
UK July BRC Sales LFL Y/Y: 0.9% v 0.9%e
Americas:
Fed's Bullard (non-voter, dove): June unemployment data represents a good report; ready to start Fed balance sheet reduction in Sept
Fed's Kashkari (dove, voter): US economy is doing pretty well overall. Did not believe shrinking the balance sheet will disrupt markets
Economic Calendar
(NL) Netherlands July CPI M/M: +0.7% v -0.3% prior; Y/Y: 1.3% v 1.1% prior
(NL) Netherlands July CPI EU Harmonized M/M: +0.8% v -0.3% prior; Y/Y: 1.5% v 1.1%e
(CH) Swiss July Unemployment Rate: 3.0% v 3.0%e; Unemployment Rate (Seasonally Adj): 3.2% v 3.2%e
(DE) Germany Jun Current Account Balance: €23.6B v €24.5Be; Trade Balance: €22.3B v €23.0Be; Exports M/M: -2.8% v +0.2%e; Imports M/M: -4.5% +0.2%e
(NO) Norway Jun Credit Growth Indicator Y/Y: 5.7% v 5.4%e
(CH) Swiss Q2 UBS Real Estate Bubble Index: 1.38 v 1.38 prior
(FR) France Jun Trade Balance: -€4.7B v -€5.1Be
(FR) France Jun Current Account Balance: -€2.1B v -€1.9B prior
(FR) France Jun YTD Budget Balance: -€62.3B v -€66.4B prior
(CZ) Czech July Unemployment Rate: 4.1% v 4.1%e
(HU) Hungary July CPI M/M: 0.0% v 0.0%e; Y/Y: 2.1% v 2.0%e
(TW) Taiwan July CPI Y/Y: 0.8% v 0.9%e; WPI Y/Y: -0.7% v -1.8% prior
Fixed Income Issuance:
(ID) Indonesia sold total IDR22.0T vs. IDR15T indicated in 2-year, 4-year, 7-year and 15-year Project-based Sukuk (PBS)
(AT) Austria Debt Agency (AFFA) sold total €1.1B vs. €1.1B indicated in 2023 and 2047 RAGB bonds (**Note: retained €100M as usual)
Sold €700MM in in 1.75% Oct 2023 RAGB bond; Avg Yield: -0.012% v +0.022% prior; Bid-to-cover: 2.02x v 2.10x prior
Sold €300M in 1.5% Feb 2047 RAGB; Avg Yield: 1.495% v 1.600%% prior; Bid-to-cover: 2.84x v 2.57x prior
SPEAKERS/FIXED INCOME/FX/COMMODITIES/ERRATUM
Equities
Indices [Stoxx50 flat at 3,503, FTSE -0.2% at 7,520, DAX -0.1% at 12,250, CAC-40 flat at 5,206, IBEX-35 +0.1% at 10,690, FTSE MIB -0.1% at 22,011, SMI -0.1% at 9,146, S&P 500 Futures -0.1%]
Market Focal Points/Key Themes: European equities open down but turn around as the morning progressed; commodities, including gold and oil, taking investor interest; macro data had little impact on market direction; risk sentiment remains unmotivated; upcoming US earnings include Sealed Air, TravelCenters and Ralph Lauren
Equities
Consumer discretionary: Air France AF.FR % (July metrics), Intercontinental Hotels IHG.DE % (earnings), Paddy Power Betfair PPB.UK % (earnings), International Workplace IWG.UK % (earnings)
Industrials: Oerlikon OERL.CH % (earnings), Wacker Neuson WAC.DE % (earnings)
Financials: Aegon AGN.NL % (divestment), Standard Life SL.UK % (earnings)
Healthcare: Vifor Pharma VIFN.CH % (earnings), Clinigen CLIN.UK % (receives regulatory approval)
Energy: Uniper UN01.DE % (earnings)
Speakers
EU's Moscovici stated that the region needed work on harmonizing tax base, not rate. Possible that France 2017 Budget Deficit to GDP ratio came in under 3%
Romania Central Bank Gov Isarescu: Inflation to enter target bank in Q3
IMF cuts Philippines 2017 GDP growth forecast from 6.8% to 6.6%. Current monetary policy stance was appropriate
China PBoC adviser said to be calling for implementation of a real estate tax
Iran President Rouhani submitted a list for new Cabinet which reappointed Zanganeh as Oil Minister for another term and Zarif as Foreign Minister
Currencies
USD trying to hold on to its small gains registered after Friday payroll report. However, Markets are pricing in less than a 50 percent chance that another Fed hike will come in 2017. The price action was tepid on Tuesday with market participants looking ahead to the US CPI data on Friday for more guidance on rates.
EUR/USD was steady and holding above the 1.18 level despite some disappoint data out of Germany. Dealers believe that the disappointment of the German export economy could weigh on the Euro.
South Africa's secret ‘no confidence vote' against President Zuma will keep ZAR volatility high. The ZAR firmed over 1,5% on Monday after the Parliamentary speaker announced the secret ballot. If the vote does oust President Zuma, then view South Africa could be the next Brazil and push the ZAR significantly higher in the short term
Fixed Income
Bund futurestrades at 163.39 up 8 ticks in light volume with further upside momentum targeting 163.78. Downside targets 162.67 followed by 162.56.
Gilt futurestrades at 126.98 down 5 ticks in quiet Summer trade, with continuation to the downside eyeing 126.51 then 125.97. A move back above 127 targets 127.20.
Tuesday's liquidity report showed Monday's excess liquidity rose €1.734T down €11B from €1.745T prior. Use of the marginal lending facility fell to €257M from €174M prior.
Corporate issuance saw $14.5B come to market via 13 issuers headlined by UBS $3.25B 2 part offering, Heinz $1.5B 3 part offering and Enterprise Products $1.7B 2 part offering. Monday marked the busiest day so far this year in terms of deal numbers, in what analysts expect to be a busy week. Issuance is expected between $35-40B.
Looking Ahead
OPEC/Non-Opec committee finish a 2-day compliance meeting
(PT) Bank of Portugal Releases Data on Banks
(UR) Ukraine July CPI M/M: -0.3%e v 1.6% prior; Y/Y: 15.1%e v 15.6% prior
05.30 (UK) Weekly John Lewis LFL sales data
05:30 (ZA) South Africa July BER Business Confidence: No est v 94.9 prior
05:30 (EU) ECB allotment in 7-Day Main Refinancing Tender
05:30 (HU) Hungary Debt Agency (AKK) to sell in 3-month Bills
05:30 (UK) DMO to sell £1.0B in 0.125% in Inflation-Linked 2026 Gilts
05:30 (BE) Belgium Debt Agency (BDA) to sell €2.5B in 3-Month and 12-Month Bills
06:00 (US) July NFIB Small Business Optimism: 103.5e v 103.6 prior
06:30 (EU) ESM to sell €1.3B in 3-month Bills; Avg Yield: % v -0.622% prior; Bid-to-cover: x v 5.1x prior (July 4th 2017)
06:45 (US) Daily Libor Fixing
07:00 (BR) Brazil July FGV Inflation IGP-DI M/M: -0.4%e v -1.0% prior; Y/Y: -1.5%e v -1.5% prior
07:45 (US) Weekly (US) Goldman Economist Chain Store Sales data
08:00 (CL) Chile July CPI M/M: 0.1%e v -0.4% prior; Y/Y: 1.6%e v 1.7% prior
08:00 (CL) Chile July CPI (Ex-food&energy) M/M: -0.1%e v -0.4% prior; Y/Y: No est v 1.8% prior
08:00 (UK) Baltic Dry Bulk Index
08:00 (ZA) South Africa parliament 'no confidence' vote on President Zuma via secret ballot
08:15 (CA) Canada July Annualized Housing Starts: 205.0Ke v 213.2K prior (revised from 212.7K)
08:55 (US) Weekly Redbook Sales
09:00 (EU) Weekly ECB Forex Reserves
09:00 (RU) Russia announces weekly OFZ bond auction
10:00 (US) Jun JOLTS Job Openings: 5.77Me v 5.67M prior
10:00 (MX) Mexico weekly International Reserves
11:00 (BR) Brazil to sell 2022, 2026, 2035 and 2055 I/L bonds
11:30 (US) Treasury to sell 4-Week Bills
12:00 (US) DOE Short-Term Crude Outlook
13:00 (US) Treasury to sell $24B in 3-year notes
15:00 (AR) Argentina July National CPI M/M: No est v 1.2% prior
16:30 (US) Weekly API Oil Inventories
Oil Edges Higher As Producers Conclude Meeting
- USD remains soft despite jobs report boost;
- Brent and WTI higher ahead of API data and Abu Dhabi outcome.
The quiet summer period is very much upon us and markets are currently trading relatively flat as a result on Tuesday. Oil continues to be a little lively though as we await inventory numbers later in the session and the conclusion of a two day meeting in Abu Dhabi.
Earnings season has been a key focal point for traders in recent weeks, with the stellar performances in the US providing the catalyst for new record highs in equity markets. But with many of the largest companies having now reported, attention is slowly shifting back towards central banks and what we can expect from them in the coming months.
The jobs report on Friday put the spotlight back on the Federal Reserve but once again, the report ticked every box except on wages, a crucial component of future inflationary pressures. We heard from two policy makers at the Fed over the last 24 hours and, as is to be expected from two of the central banks most dovish policy makers, there was no sign of either putting forward the case for higher interest rates.
The Fed may find raising interest rates again this year more challenging than they did the previous two occasions and that’s what markets are clearly anticipating. The US dollar is trading softer again on Tuesday after having caught a nice bid following Friday’s jobs data, with traders focusing on jobs gains and unemployment over wages. Still, the dollar index continues to language around its lowest levels since the start of 2015 and a move below the 92-93 area could be very bearish for the greenback.
While JOLTS job openings is the only notable US economic release today, we will get some oil inventory data from API later in the session which should be of interest. Oil is trading a little higher in today’s session, with Brent crude pushing the highs of the last week - around $53 – a break of which bring May’s highs around $55 into focus. We should also hear from OPEC and non-OPEC producers later in the day after their meeting in Abu Dhabi, in which compliance with the cuts was discussed having slipped recently. Any signs that the agreement is facing difficulties could be quite bearish from Brent and WTI crude.
GBP/USD Elliott Wave Analysis
GBP/USD – 1.3235
GBP/USD – Wave 4 is unfolding as an (A)-(B)-(C) and could have ended at 1.7192
Although cable extended recent upmove to 1.3269 late last week, the subsequent selloff signals top has been formed there and few weeks of consolidation below this level would be seen with downside bias for test of support at 1.2999, a daily close below this level would add credence to this view, bring further fall towards previous support at 1.2933 which is likely to hold from here. Looking ahead, a drop below 1.2933 support would signal recent upmove has indeed ended at 1.3269, bring further fall to 1.2880-85, then towards support at 1.2812.
Our preferred count on the daily chart is that cable's rebound from 1.3500 (wave (A) trough) is unfolding as a wave (B) with A ended at 1.7043, followed by triangle wave B and wave C as well as wave (B) has possibly ended at 1.7192, below support at 1.4232 would add credence to this count, then further fall to 1.4000 level would follow but reckon downside would be limited to 1.3655 support and price should stay above previous support at 1.3500.
On the upside, whilst initial recovery to 1.3080-85 cannot be ruled out, recon upside would be limited to 1.3110-20 and bring another decline later. Above resistance at 1.3165 would defer and suggest first leg of decline from 1.3269 top has ended, risk a stronger rebound to 1.3200, however, still reckon upside would be limited and price should falter below said resistance at 1.3269, bring another decline later this month.
Recommendation: Sell at 1.3120 for 1.2920 with stop above 1.3220.
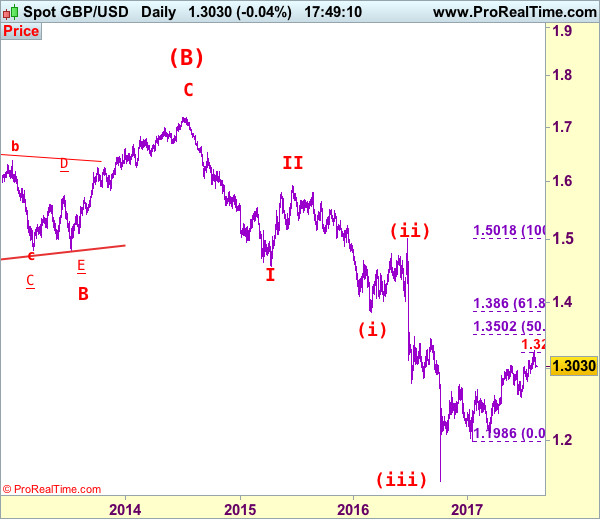
Longer term - Cable's rise from 1.0520 (Feb 1985) to 2.0100 (September 1992) is seen as [A], the decline to 1.3682 is labeled as (B) and (C) wave rally has ended at 2.1162 (9 Nov, 2007) which is also the top of larger degree wave B with circle. The selloff from there is a 5-waver with wave (A) ended at 1.3500 (23 Jan 2009), wave (B) itself is labeled as A: 1.6733, triangle wave B: 1.4813 and wave C as well as top of wave (B) ended at 1.7192 (2014), hence the selloff from there is an impulsive wave (C) with wave I : 1.4566, wave II 1.5930, an extended wave III is unfolding and already exceeded our downside target at 1.3500 and 1.3000, hence weakness to 1.2500 and possibly 1.2000 cannot be ruled out, however, price should stay well above psychological level at 1.0000.

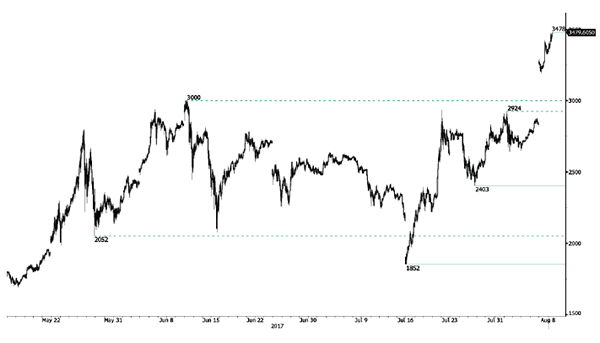
Bitcoin Very Strong Bullish Momentum
Bitcoin keeps on surging. Hourly resistance is given at 3478 (08/08/2017 high) and hourly support lies very far at 2403 (26/07/2017 low). The road is wide open for another bullish move.
In the long-term, the digital currency has had an exponential growth. There are decent likelihood that the asset will consolidate above $1500. Long-term support is given at $1464 (04/05/2017 low).