Sample Category Title
Gold Edges Lower as JOLTS Employment Report Sparkles
Gold has posted slight losses in the Tuesday session. In North American trade, spot gold is trading at $1254.74, down 0.23% on the day. On the release front, there was only one major event. JOLTS Jobs Openings JOLTS Jobs Openings jumped to 6.16 million, well above the estimate of 5.74 million. This marked a record high, and comes on the heels of last week's strong nonfarm payrolls report. On Wednesday, the US releases two employment indicators – Preliminary Nonfarm Productivity and US Preliminary Unit Labor Costs.
Gold prices have risen in recent weeks, taking advantage of a struggling US dollar. Investor appetite for the US dollar has softened, as political risk has been growing and there are doubts if the Fed will raise rates before 2018. President Trump's administration seems rudderless and Trump's inability to pass healthcare legislation has increased political risk in the US. As well, the Federal Reserve's monetary policy remains unclear. Earlier this year the Fed strongly hinted that it planned to raise rates three times in 2017, but has only pressed the rate trigger twice. In June, Fed Chair Janet Yellen shrugged off low inflation, saying that it was due to "transient" factors, leaving the impression that the Fed still planned one final hike. However, inflation has not improved and the Fed has changed its tune. Last week, St. Louis Federal Reserve President James Bullard said he opposed further Fed hikes, warning that another hike would actually delay inflation from hitting the Fed's target of 2%. The markets have become more skeptical about a rate hike in December, as the odds have fallen to 33%, compared to 43% a week ago.
The US economy continues to grapple with weak inflation, which is also apparent in the labor market. Although the nonfarm payrolls report in July easily beat expectations and the unemployment rate dropped from 4.4% to 4.3%, wage growth remains a sore point. In July, Average Hourly Earnings remained unchanged at 0.3%, and the indicator has failed to break above 0.3% in 2017. The weakness in earnings growth has puzzled economists, as a red-hot labor market should translate into higher wages. In fact, wage growth has actually slowed in 2107, and this could have significant economic repercussions, as consumers are responding by holding tight on the purse strings and reducing spending.
Dollar Touches 1½ Week-High as Job Openings Hit a Record High; Oil Pares Gains Amid Ongoing Oversupply
With political uncertainties in the US in the background and tensions between North- Korea and the US increasing, the dollar managed to recover from yesterday's losses as US job vacancies reached a record-high in June and drove the currency to a 1½ week- high. Meanwhile, in the commodity markets, oil could not sustain its gains arising from Saudi Arabia's willingness to cut its oil supplies by more than it pledged, as global oil production does not show any signs of retreating from high levels.
The dollar bounced by 0.36% to 93.68 against a basket of major currencies after the JOLTS Job openings surprised forecasts in the European session. Job vacancies increased by 6.163 million in June instead of 5.775 million expected, exceeding the previous mark of 5.702 million and recording a multi-year high. The greenback surged above the previous week's top of 93.61 when non-farm payrolls came in better than expected. However, questions on whether the Fed will tighten its stimulus monetary program in September persist as the St. Louis and Minneapolis Fed presidents sounded yesterday more certain about rates remaining steady. Specifically, Bullard and Kashkari supported that any further improvements in labor conditions are unlikely to boost inflation toward the target. Yet, they expressed their satisfaction with the current monetary policy given the current macroeconomic picture. Now, markets anticipate the PPI and CPI figures, pending to be published on Thursday and Friday respectively, to throw some light on the direction of inflation.
The euro lost ground in the wake of the stronger JOLTS figures, falling by 0.51% to 1.1749 from $1.1809 prior the data release.
Euro/pound which previously during the European trading had touched a fresh ten-month high of 0.907, sank by 0.26% to 0.9055, despite the pound posting losses for the fourth consecutive day.
The kiwi fell to a fresh three-week low of $0.7332 during the European trading ahead of the RBNZ policy meeting on Thursday, where analysts project policymakers will keep rates flat.
The aussie also plummeted versus the greenback, falling to 0.7902 giving up its gains made earlier when data out of the country showed improvements in Australian business confidence.
Regarding energy markets, oil prices reversed gains made earlier in the day when Saudi Arabia announced its decision to cut supplies by up to 10% towards Asian countries in September to comply with the production cuts deal. Despite the largest crude oil exporter, Saudi Arabia, expressing its willingness to reduce production by 520,000 bdp worldwide in September, more than its pledge of 486,000 bpd, oil could not sustain its gains as overall production remains high. WTI crude and Brent declined to $49.04 and $52.01 per barrel respectively.
Gold price dropped by 0.31% to $1253.51 per ounce, reaching a 1½ week low as the dollar bounced back.
Pound Drops Below 1.30 After Sharp US Jobs Report
The British pound's slide continues this week. In Tuesday's North American session, the pair is trading at 1.2961, down 0.56% on the day. On the release front, there are no major British events. BRC Retail Sales Monitor slowed to 0.9%, down from 1.2% in the previous month. In the US, there was positive news on the employment front, as JOLTS Jobs Openings jumped to 6.16 million, well above the estimate of 5.74 million. On Wednesday, the US releases two employment indicators – Preliminary Nonfarm Productivity and US Preliminary Unit Labor Costs.
The pound continues to lose ground, as GBP/USD has slipped 2.0% since August 3. On Tuesday, the pair has dropped below the 1.30 level, following the strong US JOLTS Jobs Openings release. The indicator improved to 6.16 million, marking a record high. This follows the strong nonfarm payrolls report on Friday, as the US labor market remains red-hot. The British currency has also lost ground as investors are skeptical that the BoE will raise interest rates before 2018. The markets are also concerned about the health of the British economy, with the BoE recently lowering its inflation and growth forecasts.
Investor appetite for the US dollar has softened, as political risk has been growing and there are doubts if the Fed will raise rates before 2018. President Trump's administration seems rudderless and Trump's inability to pass healthcare legislation has increased political risk in the US. As well, the Federal Reserve's monetary policy remains unclear. Earlier this year the Fed strongly hinted that it planned to raise rates three times in 2017, but has only pressed the rate trigger twice. In June, Fed Chair Janet Yellen shrugged off low inflation, saying that it was due to "transient" factors, leaving the impression that the Fed still planned one final hike. However, inflation has not improved and the Fed has changed its tune. Last week, St. Louis Federal Reserve President James Bullard said he opposed further Fed hikes, warning that another hike would actually delay inflation from hitting the Fed's target of 2%. The markets have become more skeptical about a rate hike in December, as the odds have fallen to 33%, compared to 43% a week ago.
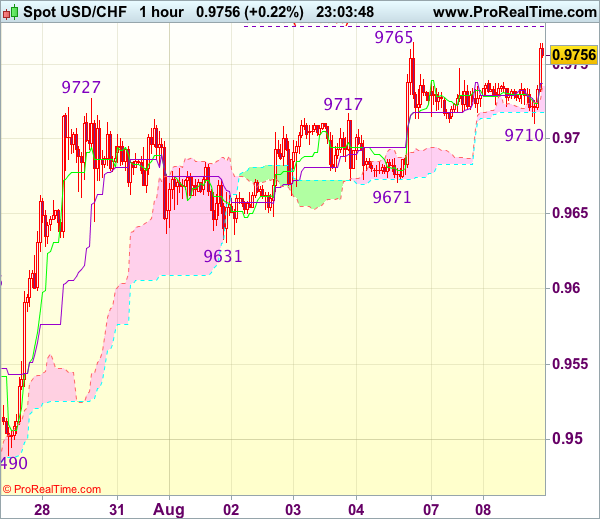
Trade Idea Wrap-up: USD/CHF – Buy at 0.9725
USD/CHF - 0.9763
Most recent candlesticks pattern : N/A
Trend : Near term up
Tenkan-Sen level : 0.9737
Kijun-Sen level : 0.9737
Ichimoku cloud top : 0.9735
Ichimoku cloud bottom : 0.9718
Original strategy :
Buy at 0.9685, Target: 0.9785, Stop: 0.9650
Position : -
Target : -
Stop : -
New strategy :
Buy at 0.9725, Target: 0.9825, Stop: 0.9690
Position : -
Target : -
Stop : -
As the greenback has risen again after finding renewed buying interest at 0.9710, adding credence to our bullish view that recent upmove has resumed and upside bias remains for recent rise from 0.9438 low to extend gain to 0.9775 (50% projection of 0.9438-0.9727 measuring from 0.9631) and later 0.9800-10 (61.8% projection) but near term overbought condition should limit upside to 0.9830-40 and reckon 0.9860-70 would hold from here, bring another retreat later.
In view of this, would not chase this rise here and would be prudent to buy dollar on dips at 0.9715-25 should limit downside. Below said support at 0.9710 would suggest top is possibly formed but only break of 0.9671 support would defer and suggest top is possibly formed, risk correction of recent rise towards support at 0.9631.
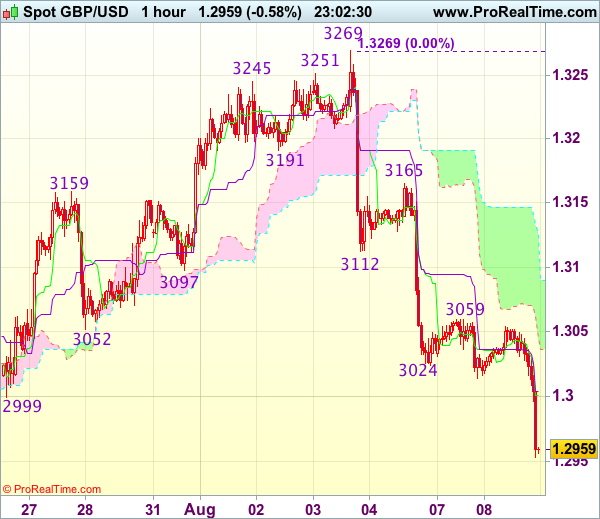
Trade Idea Wrap-up: GBP/USD – Sell at 1.3055
GBP/USD - 1.2980
Most recent candlesticks pattern : N/A
Trend : Near term down
Tenkan-Sen level : 1.3001
Kijun-Sen level : 1.3004
Ichimoku cloud top : 1.3126
Ichimoku cloud bottom : 1.3045
Original strategy :
Sell at 1.3055, Target: 1.2955, Stop: 1.3090
Position : -
Target : -
Stop : -
New strategy :
Sell at 1.3055, Target: 1.2955, Stop: 1.3090
Position : -
Target : -
Stop : -
As cable has fallen again after faltering below resistance at 1.3059, suggesting recent decline from 1.3269 top has resumed and may extend further weakness to 1.2950, however, near term oversold condition should precinct sharp fall below previous chart support at 1.2933 and reckon 1.2900 would hold from here, risk from there has increased for a rebound to take place later.
In view of this, would not chase this fall here and we are looking to sell cable on recovery as said resistance at 1.3059 should limit upside and bring another decline. Above 1.3090 would risk test of previous support at 1.3112 but only break there would signal low is formed instead.
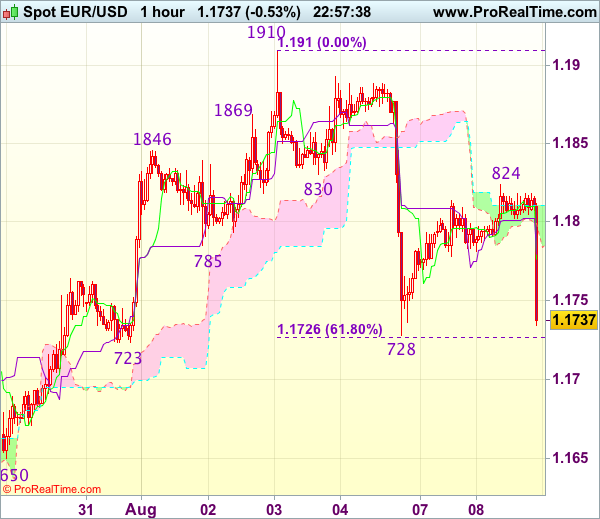
Trade Idea Wrap-up: EUR/USD – Sell at 1.1770
EUR/USD - 1.1749
Most recent candlesticks pattern : N/A
Trend : Near term up
Tenkan-Sen level : 1.1775
Kijun-Sen level : 1.1778
Ichimoku cloud top : 1.1811
Ichimoku cloud bottom : 1.1792
Original strategy :
Sell at 1.1840, Target: 1.1740, Stop: 1.1875
Position : -
Target : -
Stop : -
New strategy :
Sell at 1.1770, Target: 1.1670, Stop: 1.1805
Position : -
Target : -
Stop : -
Current selloff in NY morning on dollar’s broad-based strength suggests the rebound from 1.1728 has ended at 1.1824, hence consolidation with downside bias is seen, break of 1.1723-28 (previous support as well as 61.8% Fibonacci retracement of 1.1613-1.1910) would extend the fall from 1.1910 top for retracement of early upmove to 1.1700 and then 1.0670 but reckon support at 1.1650 would remain intact.
In view of this, we are looking to sell euro again on recovery as 1.1770 should limit upside. Above 1.1800-05 would risk another test of 1.1824-30 resistance but only break there would signal the erratic fall from 1.1910 has ended, bring further gain to 1.1855-60 first.
Yen Unchanged as Japanese Current Surplus Within Expectations
USD/JPY has ticked lower in the Tuesday session. In North American trade, the pair is trading at 110.70, down 0.02% on the day. On the release Japan's current surplus jumped to JPY 1.52 trillion, beating the estimate of JPY of 1.51 trillion. Japanese Economy Watchers Sentiment dipped to 49.7, short of the estimate of 50.1 points. In the US, there was positive news on the employment front, as JOLTS Jobs Openings jumped to 6.16 million, well above the estimate of 5.74 million. On Wednesday, the US releases two employment indicators – Preliminary Nonfarm Productivity and US Preliminary Unit Labor Costs.
The Bank of Japan has stubbornly stuck to its inflation target of 2 percent, and said that it won't ease up on its huge stimulus package before inflation moves higher. However, with inflation mired at just 0.4%, there are growing calls for the BoJ to change its tune. On Tuesday, former BOJ Deputy Governor Kazumasa Iwata warned that the bank's inflation target is unrealistic, adding that even a 1% target could be overly optimistic. There are concerns that the ultra-accommodative policy is hurting the Japanese financial market, and Iwata suggested that the bank taper its bond-buying scheme from JPY 60 billion to 40 billion per year.
Investor appetite for the US dollar has softened, as political risk has been growing and there are doubts if the Fed will raise rates before 2018. President Trump's administration seems rudderless and Trump's inability to pass healthcare legislation has increased political risk in the US. As well, the Federal Reserve's monetary policy remains unclear. Earlier this year the Fed strongly hinted that it planned to raise rates three times in 2017, but has only pressed the rate trigger twice. In June, Fed Chair Janet Yellen shrugged off low inflation, saying that it was due to "transient" factors, leaving the impression that the Fed still planned one final hike. However, inflation has not improved and the Fed has changed its tune. Last week, St. Louis Federal Reserve President James Bullard said he opposed further Fed hikes, warning that another hike would actually delay inflation from hitting the Fed's target of 2%. The markets have become more skeptical about a rate hike in December, as the odds have fallen to 33%, compared to 43% a week ago.
Optimistic News on American Labor Market Pulls Down the EUR/USD
The EUR/USD was moving within the narrow range above the important level of 1.1800 before it started to fall sharply. Investors mostly ignored the strong macro statistics from Germany, where the trade balance surplus in June was 21.2 billion against 20.8 billion euro forecasted. The German economy is the largest in the euro area and its state traditionally has a significant influence on the course of trading. Positive news from the Eurozone was partly offset by the stronger than expected NFIB small business index in the US, which increased to 105.2 in July vs predicted 103.6. The rise in volatility is explained by a surprisingly confident JOLTS job openings report according to which the indicator in June increased to 6.16 million that is much more than 5.74 million forecasted.
Traders are reluctant to open new positions ahead of the important report on consumer price index in the US that will be published on Friday. We recall that considering strong figures of the American labor market, the main attention will be turned to the news on inflation that has the major impact on the FOMC decision about the plans on monetary policy tightening. Growing inflation amid rising oil prices during the last month may lead to the dollar strengthening against other currencies.
The USD/JPY is getting some support from the stronger greenback. Previously the optimistic news for the yen have become the rising surplus of current account balance to 1.52 trillion yen in June vs 1.40 trillion yen in May. The upward impulse may continue due to fixing short positions amid positive US dollar's dynamics.
EUR/USD
After some consolidation above 1.1800 the EUR/USD price demonstrated the confident decline. Despite the RSI on the 15-minute chart being close to the oversold zone, we may see a continued decline to the immediate support near 1.1700. The positive trend of the previous weeks has been broken and there is a chance of a significant price correction to 1.1620 and 1.1500 the pace of which may accelerate due to fixing of long positions.
USD/JPY
The USD/JPY quotes were not able to fix below the local support at 110.30 and are rising at the moment. Overcoming the important level of 111.00 may become a buy signal and in the case of opening long positions, the stop may be set below 110.80 and the targets will be located near 113.00 and 114.70. The closest support levels are near 110.00 and 109.60.
AUD/USD
The aussie price is approaching the strong support level at 0.7900, which has been tested a couple of times during the last trading sessions. Its breaking point may become a trigger for the massive selloff with the potential of decline to 0.7800 and 0.7740. On the other hand, we do not exclude the growth resumption with the goal at 0.8000.
Trade Idea Wrap-up: USD/JPY – Hold long entered at 110.30
USD/JPY - 110.75
Most recent candlesticks pattern : N/A
Trend : Near term down
Tenkan-Sen level : 110.54
Kijun-Sen level : 110.56
Ichimoku cloud top : 110.79
Ichimoku cloud bottom : 110.45
Original strategy :
Bought at 110.30, Target: 111.30, Stop: 109.95
Position : - Long at 110.30
Target : - 111.30
Stop : - 109.95
New strategy :
Hold long entered at 110.30, Target: 111.30, Stop: 110.25
Position : - Long at 110.30
Target : - 111.30
Stop : - 110.25
Although the greenback slipped to 110.25, as dollar did find renewed buying interest there and has staged the anticipated rebound, retaining our bullishness and another test of resistance at 111.05 would be seen, break there would add credence to our view that a temporary low has been formed at 109.85, bring retracement of recent decline to 111.29-30 (previous resistance and 61.8% Fibonacci retracement of 112.20-109.85), having said that, break there is needed to provide confirmation, bring a stronger rebound to 111.50 but price should falter below another previous resistance at 111.71.
In view of this, we are holding on to our long position entered at 110.30. Only below 110.00 would signal the rebound from 109.85 has ended, bring retest of this level, below there would extend recent decline to 109.70 and later towards 109.50.

EURGBP Enters Overbought Ground as it Eyes 0.91 Level
EURGBP hit another fresh high today, climbing to 0.9087 - its loftiest since October 2016. The pair has been ranging in an upward linear regression channel since mid-April and prices are currently in the upper channel, underlining the bullish bias in the near term.
Despite having some way to go before reaching the upper band of the regression channel, EURGBP has met some resistance at the 161.8% Fibonacci retracement level of the downleg from 0.8948 to 0.8742. The 161.8% Fibonacci level around 0.9075 is slightly below today's 10-month peak of 0.9087.
Momentum indicators reinforce the positive bias but suggest a short-term correction may be nearing. The RSI has just crossed the 70-overbought level, while the %K and %D lines of the stochastic oscillator are both above 80. However, the %K and %D lines are still rising and not made a bearish crossover, indicating it's too soon to say that the current uptrend is running out of steam.
A continuation of the current rally should see the pair challenging the key 0.91 level before it finds resistance around the 0.9140 area. A successful break above 0.9040 would bring into scope October's 7-year high of 0.9260.
In the event of a downside reversal, support should come from the middle of the linear regression channel, currently around 0.9025. A drop into the lower channel would signal a weakening of the positive bias with support being provided by the 100% and 78.5% Fibonacci levels at 0.8950 and 0.8900 respectively.
Looking at the medium-term picture, EURGBP has been bullish following the golden cross of the 50- and 200-day moving averages in June after a period of consolidation.