Sample Category Title
German Trade Surplus At A 10-Month High In June
For the 24 hours to 23:00 GMT, the EUR declined 0.26% against the USD and closed at 1.1763.
On the macro front, Germany’s seasonally adjusted trade surplus widened to a ten-month high level of €21.2 billion in June, as a fall in imports outstripped that of exports. The nation registered a trade surplus of €20.3 billion in the prior month, while investors had anticipated it to widen to €21.0 billion.
On the other hand, the nation’s seasonally adjusted exports recorded an unexpected drop of 2.8% MoM in June, rising at its weakest pace in nearly two years. Market participants had expected exports to rise 0.2%, after recording a revised advance of 1.5% in the prior month. Also, the nation’s seasonally adjusted imports surprisingly dropped 4.5% on a monthly basis in June, posting its sharpest decline since January 2009. In the prior month, imports had recorded a revised rise of 1.3%, while markets were anticipating for a gain of 0.2%.
The greenback lost ground against most of its key peers, after the US President, Donald Trump warned North Korea that any threats to the US will be “met with fire and fury.”
Earlier in the session, the US Dollar strengthened, following robust US labour market report.
Data showed that JOLTs job openings in US surged to a record high level of 6163.0K in June, topping market consensus for a rise to a level of 5750.0K. In the prior month, JOLTs job openings had recorded a revised reading of 5702.0K. Moreover, the nation’s NFIB small business optimism index unexpectedly climbed to a level of 105.2 in July, notching a five-month high, thus indicating that small business firms are feeling optimistic about the economy’s growth prospects. The index had registered a reading of 103.6 in the previous month, while markets anticipated it to ease to a level of 103.5.
In the Asian session, at GMT0300, the pair is trading at 1.1734, with the EUR trading 0.25% lower against the USD from yesterday’s close.
The pair is expected to find support at 1.1693, and a fall through could take it to the next support level of 1.1653. The pair is expected to find its first resistance at 1.1796, and a rise through could take it to the next resistance level of 1.1859.
With no major macroeconomic releases in the Euro-zone today, investors will look forward to the US MBA mortgage applications data, slated to release in a few hours.
The currency pair is trading below its 20 Hr and 50 Hr moving averages.

Pound Trading Marginally Lower In The Asian Session
For the 24 hours to 23:00 GMT, the GBP declined 0.31% against the USD and closed at 1.2994.
In the Asian session, at GMT0300, the pair is trading at 1.2987, with the GBP trading a tad lower against the USD from yesterday’s close.
The pair is expected to find support at 1.2943, and a fall through could take it to the next support level of 1.2898. The pair is expected to find its first resistance at 1.3042, and a rise through could take it to the next resistance level of 1.3096.
Moving ahead, traders will keep a close watch on UK’s inflation report hearings, due to release in a few hours.
The currency pair is showing convergence with its 20 Hr moving average and trading below its 50 Hr moving average.

Japanese Yen Trading On A Stronger Footing In The Morning Session
For the 24 hours to 23:00 GMT, the USD declined 0.57% against the JPY and closed at 110.12.
The Japanese Yen gained ground, amid increased risk aversion among investors after the US President, Donald Trump promised a reprisal of fire and fury if North Korea threatens to attack the US.
On the data front, Japan's Eco-Watchers Survey for the current situation unexpectedly dropped to a level of 49.7 in July, defying market expectations for a rise to a level of 50.2. In the previous month, the index had recorded a reading of 50.0. Further, the nation's Eco-Watchers Survey for the future outlook surprisingly eased to a level of 50.3 in July, compared to a reading of 50.5 in the previous month, while market participants expected the index to rise to a level of 51.0.
In the Asian session, at GMT0300, the pair is trading at 109.90, with the USD trading 0.2% lower against the JPY from yesterday's close.
The pair is expected to find support at 109.48, and a fall through could take it to the next support level of 109.07. The pair is expected to find its first resistance at 110.57, and a rise through could take it to the next resistance level of 111.25.
Ahead in the day, traders will closely monitor Japan's flash machine tool orders for July.
The currency pair is trading below its 20 Hr and 50 Hr moving averages.

Switzerland’s Unemployment Rate Remained Steady In July
For the 24 hours to 23:00 GMT, the USD declined 0.07% against the CHF and closed at 0.9727.
Macroeconomic data revealed that Switzerland's seasonally adjusted unemployment rate remained steady at 3.2% in July, at par with market expectations.
In the Asian session, at GMT0300, the pair is trading at 0.97, with the USD trading 0.28% lower against the CHF from yesterday's close.
The pair is expected to find support at 0.9676, and a fall through could take it to the next support level of 0.9651. The pair is expected to find its first resistance at 0.9749, and a rise through could take it to the next resistance level of 0.9797.
With no macroeconomic releases in Switzerland today, investor sentiment will be governed by global macroeconomic events.
The currency pair is trading below its 20 Hr and 50 Hr moving averages.

Loonie Reverses Its Gains In The Asian Session, Ahead Of Canada’s Housing Starts And Building Permits Data
For the 24 hours to 23:00 GMT, the USD declined 0.1% against the CAD and closed at 1.2667.
In the Asian session, at GMT0300, the pair is trading at 1.2689, with the USD trading 0.17% higher against the CAD from yesterday's close.
The pair is expected to find support at 1.2658, and a fall through could take it to the next support level of 1.2628. The pair is expected to find its first resistance at 1.2712, and a rise through could take it to the next resistance level of 1.2736.
Looking ahead, Canada's housing starts for July and building permits for June, set to release later in the day, will garner a lot of market attention.
The currency pair is trading above its 20 Hr and 50 Hr moving averages.

EURUSD Saw A Notable Drop Below The 1.18 Level
Market movers today
Today is set to be another quiet day in terms of data releases.
The Reserve Bank of New Zealand (RBNZ) will announce its Official Cash Rate (OCR) decision today. We expect the rate to remain at 1.75%, in accordance with consensus.
In the US, preliminary unit labour cost figures and crude Oil inventories data are released.
Danish foreign trade data is out today. Imports and exports rose strongly in May and there was some reversal in June but the underlying out look is good, as growth continues to be strong in Europe and it is hoped that business investments are rising in Denmark.
Selected market news
The Washington-Pyongyang confrontation continued yesterday with US president Trump threating the North Korean regime with ‘fire and fury' amid reports the latter is continuing its missile programme unabatedly amid the recently agreed UN sanctions with North Korea's Kim Jung Unasking his military to examine how to do a strike on the US Guam base. The continued rise in tensions drove gains in safe haven assets with USD/JPY breaking below 110 and EUR/CHF below 1.1350. As a result of souring risk sentiment and yenstrength , equities were generally lower in the Asian session with the Nikkei down more than 1.5%. Slightly weaker than- expected Chinese price indices showing growth in producer prices at 5.5% y/y in July (vs 5.6 expected) and consumer prices at 1.4% y/y (vs 1.5% expected) were less of a driver amid growing geopolitical concerns.
Yesterday afternoon EUR/USD saw a notable drop below the 1.18 level following the strong JOLTS job figures out of the US which added another second-tier data contribution to reversing the US economic surprise index. The US CPI data out on Friday will be instrumental for whether there is a repricing of the Fed in a more hawkish direction ahead of the September meeting: we look for core CPI to be unchanged at 1.7% which should keep the Fed on a 'cautious path'.
In South Africa, president Zuma survived the no-confidence vote which was cast in the national assembly last night. The rand fell by about 1.6% against the USD in the immediate aftermath of the results, but has since regained some ground. In our view, ZAR may stay under a bit of pressure in the coming months, but the currency has shown itself to be relatively resilient to adverse political developments before as investors eye possible leadership change at the ANC conference in December, a modest economic recovery and the sharp improvement in the external balance over the past year.
Daily Technical Analysis: EUR/USD Bearish Break Below 1.18 Within Wave 5
.
Currency pair EUR/USD
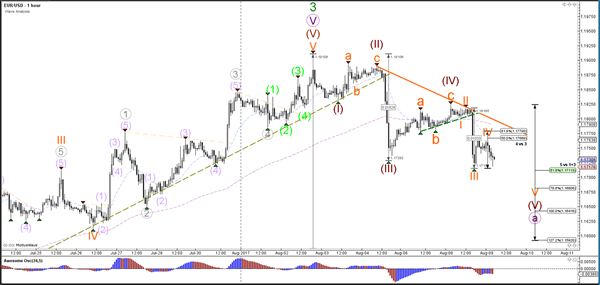
The EUR/USD bearish retracement is indeed continuing lower, as expected in the wave analysis earlier this week. Price is now approaching two strong support trend lines, which could act as a bounce or break zone. A bullish bounce indicates the completion of wave A (purple) whereas a bearish breakout could see price fall towards the 23.6% Fibonacci level of wave 4 (green).
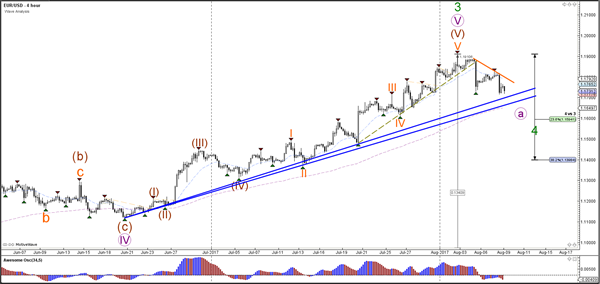
The EUR/USD broke below the support trend line (dotted green) and could be extending the 5th wave (brown) with 5 waves (orange) if price stays below the Fibonacci levels of wave 4 vs 3.
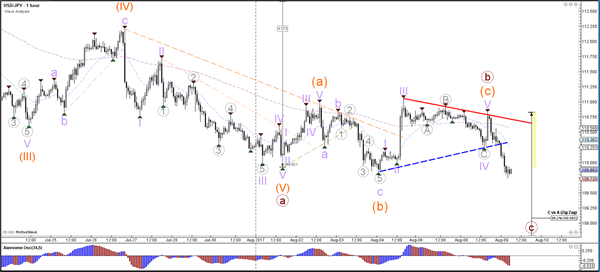
Currency pair USD/JPY
The USD/JPY completed an ABC (orange) zigzag within a larger ABC correction (brown) and seems to be starting a wave C correction now.
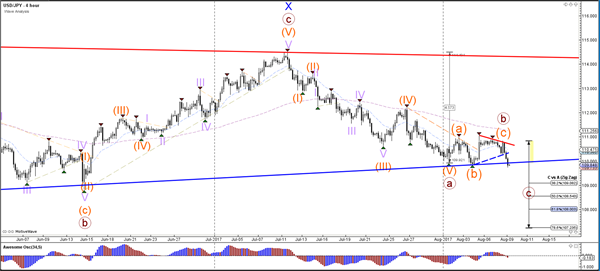
The USD/JPY seems to have completed a potential wave 4 and truncated wave 5 (purple) which does not break the top of wave 3.
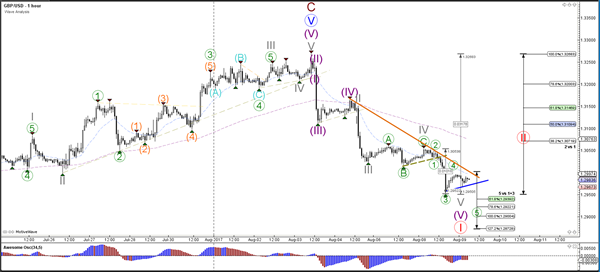
Currency pair GBP/USD
The GBP/USD continued with its downtrend and is building 5 waves (grey) within wave 1 (red).
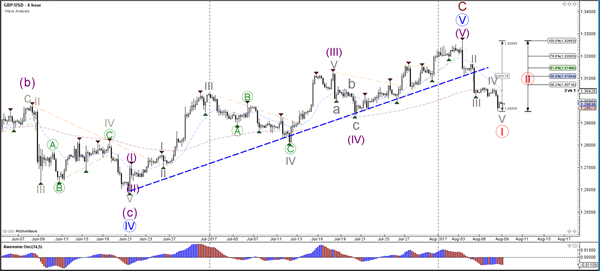
The GBP/USD could be extending the 5th waves with 5 more waves (green), which could see a bearish breakout below the support trend line (blue). The other scenario is that price will bounce and complete wave 1 and start wave 2 (red). In this case price will probably break above the resistance trend line (orange).
European Open Briefing: Asian Stocks And U.S. Equity-Index Futures Dropped
Global Markets:
- Asian stock markets: Nikkei fell 1.43 %, Shanghai Composite down 0.29 %, Hang Seng dropped 0.67 %, ASX 200 rose 0.40 %
- Commodities: Gold at $1270.41 (+0.62 %), Silver at $16.50 (+0.70 %), WTI Oil at $49.01 (-0.33 %), Brent Oil at $51.93 (-0.40 %)
- Rates: US 10 year yield at 2.25, UK 10 year yield at 1.15, German 10 year yield at 0.47
News & Data:
- AUD Home Loans (MoM) 0.5 % vs 1.5 % expected
- CNY CPI y/y 1.4 % vs 1.5 %
- CNY PPI y/y 5.5 % vs 5.6 %
- JOLTS Job Openings 6.16 M vs 5.74 M expected
- U.S. job openings at record high; labor market tightening – RTRS
- Oil falls for third day as doubts over OPEC cuts linger – RTRS
Markets Update:
Asian stocks and U.S. equity-index futures dropped as investors took a risk-off approach and piled into havens such as U.S. Treasuries, gold and the yen as tensions on the Korean peninsula escalated
USD/JPY and all JPY crosses benefited in the Asian session, The yen rose over 0.4 percent to 109.74 per dollar, an eight-week high.
EUR/USD has slipped just a tad lower from its late US levels opening Asia at 1.1750, Buyers are holding the price just above yesterday’s low of 1.1715.
AUD/USD has been hit lower on North Korean tensions reaching lows of 0.78552 against the US dollar. The risk barometer AUD/JPY fell sharply losing over 150 pips.
Upcoming Events:
Wednesday, August 09th
- 12:30 GMT – (CAD) Building Permits m/m
- 14:30 GMT – (USD) Crude Oil Inventories
- 21:00 GMT – (NZD) Official Cash Rate
- 21:00 GMT – (NZD) RBNZ Rate Statement
- 21:00 GMT – (NZD) RBNZ Press Conference
Market Update – Asian Session: North Korea Tensions Rise As Threats Are Made
Asia Summary
Asian markets opened weaker as dollar weakness, flipped into some strength as risk off sentiment took hold of the markets with increasing tensions in the Korea peninsula. RBA’s Kent reiterated the RBA’s prior statement that A$ strength is more a symptom of USD weakness. AUD/USD fell 0.5% to 0.7867 after Westpac consumer confidence for August fell 1.2% m/m to 95.5.Several large earthquakes reported in China over the course of the last 12 hours, so far 9 have been reported dead. PBOC strengthened yuan fixing to highest in a week, sending onshore yuan higher for a ninth straight day against trade-weighted basket, longest streak since index was started late last year.
USD/KRW rose 0.6% to 1,135.20 after US intelligence officials find that North Korea has successfully produced a miniaturized nuclear warhead, President Trump issued a warning that if North Korea escalates the nuclear threat, “they will be met with fire and fury like the world has never seen.” North Korean state-run media issued statement saying, US war hysteria will bring a miserable end; North Korea could strike before any preemptive attack by the US, could strike Guam with mid-to-long range missiles. South Korea government places focus on defense readiness.
Key economic data
(CN) CHINA JULY CPI Y/Y: 1.4% V 1.5%E; PPI Y/Y: 5.5% V 5.6%E; Food prices -1.1% y/y; Non-food prices +2.0% y/y
(KR) SOUTH KOREA JULY UNEMPLOYMENT RATE: 3.6% V 3.8%E
(AU) Australia Aug Westpac Consumer Confidence Index: 95.5 v 96.6 prior; m/m: -1.2% v 0.4% prior
(AU) AUSTRALIA JUN HOME LOANS M/M: 0.5% V 1.5%E
Speakers and Press
China
(CN) US President Trump appears to be giving China banks dealing with North Korea temporary pass from threatened US sanctions after China supported UN deal against North Korea - press
Australia
(AU) Australia RBA Assistant Gov Kent: No initial comments on monetary policy; Reiterates further rise in A$ would result in slightly lower domestic growth, that's a statement of fact
Korea
(KR) North Korea state media: US war hysteria will bring a miserable end; North Korea could strike before any preemptive attack by the US, could strike Guam with mid-to-long range missiles
(KR) South Korea Fin Min Kim: Sees limited risk impact on markets from North Korea
Japan
(JP) Former BoJ Official Kiuchi: Yield target may change to 3-5 years; Japan govt not insisting on achieving 2% CPI – press
(JP) Japan Econ Min Motegi: Must looks at several indicators not just CPI to determine if Japan is out of deflation
Asian Equity Indices/Futures (00:00ET)
Nikkei -1.5%, Hang Seng -0.8%, Shanghai Composite -0.2%, ASX200 +0.5%, Kospi -0.9%
Equity Futures: S&P500 -0.3%; Nasdaq100 -0.4%, Dax -0.2%, FTSE100 -0.1%
FX ranges/Commodities/Fixed Income (00:00ET)
EUR 1.1764-1.1718; JPY 110.32-109.74; AUD 0.7915-0.7855; NZD 0.7335-0.7309
Dec Gold +0.7% at 1,270/oz; Sept Crude Oil -0.3% at $49.02/brl; Sept Copper -0.1% at $2.94/lb
USD/CNY *(CN) PBOC SETS YUAN REFERENCE RATE AT: 6.7075 V 6.7184 PRIOR
(CN) China PBOC OMO injects CNY140B in 7 and 14-day reverse repos v CNY140B prior; Drains net CNY0B v CNY0B prior
(CN) China MoF sells 2-yr bonds at 3.423%, bid-to-cover 2.36x; Sells 5-yr bonds at 3.6005%, bid-to-cover 3.16x
Equities notable movers
Hong Kong/China
Esprit, 330.HK Guides FY16/17 Net HK$50-80M v HK$21M y/y; +7.3%
Japan
Toshiba, 6502.JP Confirms to disclose Q1 earnings and FY16 securities report tomorrow; Has not received audit review from auditor PwC; +4.3%
Rohto Pharmaceutical,4527.JP Reports Q1 Net ¥2.3B v ¥1.4B y/y, Op ¥3.4B v ¥2.2B Rev ¥35.8B v ¥32.9B y/y; +12.7%\
Sumco, 3436.JP Reports H1 Net ¥9.6B v ¥2.3B y/y, Op ¥17.3B v ¥6.2B Rev ¥123.9B v ¥103.2B y/y; -10.8%
Australia
Bellamy’s, BAL.AU Camperdown's CNCA registration suspension lifted; +6.9%
CBA.AU Reports FY17 Cash profit A$9.88B v A$9.79Be; Net interest income A$17.6B v A$16.9B y/y; +0.7%
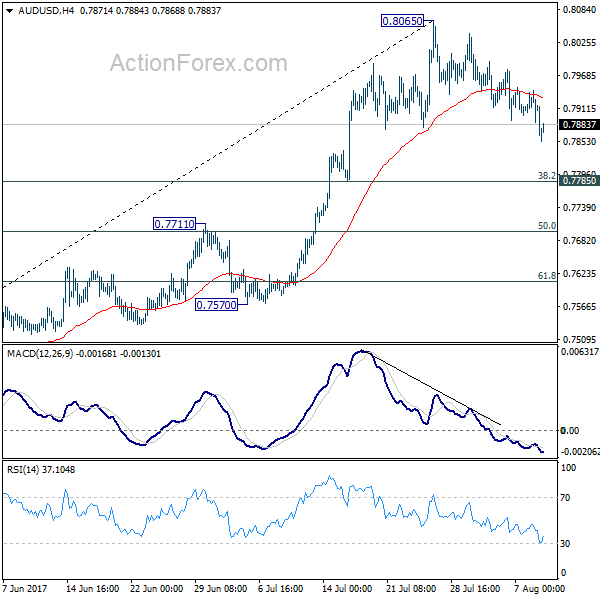
AUD/USD Daily Outlook
Daily Pivots: (S1) 0.7885; (P) 0.7914; (R1) 0.7941; More...
AUD/USD's break of 0.7877 support confirms short term topping at 0.8065. Intraday bias is back on the downside for pull back to 0.7785 cluster support (38.2% retracement of 0.7328 to 0.8065 at 0.7783) to bring rebound. But break 0.8065 is needed to confirm rally resumption. Otherwise, we'd expect more consolidative trading in near term.
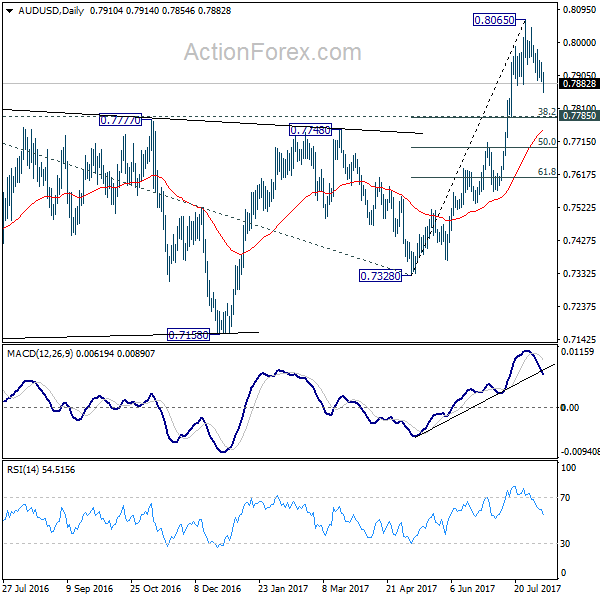
In the bigger picture, current development suggests that rebound from 0.6826 is developing into a medium term rise. There is no confirmation of trend reversal yet and we'll continue to treat such rebound as a corrective pattern. But in any case, break of 55 month EMA (now at 0.8100) will target 38.2% retracement of 1.1079 to 0.6826 at 0.8451. Break of 0.7328 support is needed to confirm completion of the rebound. Otherwise, further rise is now expected.