
Sample Category Title
Daily Technical Outlook And Review: EUR/USD, GBP/USD, AUD/USD, USD/JPY, USD/CAD, USD/CHF, DOW 30, GOLD
A note on lower timeframe confirming price action...
Waiting for lower timeframe confirmation is our main tool to confirm strength within higher timeframe zones, and has really been the key to our trading success. It takes a little time to understand the subtle nuances, however, as each trade is never the same, but once you master the rhythm so to speak, you will be saved from countless unnecessary losing trades. The following is a list of what we look for:
- A break/retest of supply or demand dependent on which way you're trading.
- A trendline break/retest.
- Buying/selling tails ... essentially we look for a cluster of very obvious spikes off of lower timeframe support and resistance levels within the higher timeframe zone.
- Candlestick patterns. We tend to only stick with pin bars and engulfing bars as these have proven to be the most effective.
We typically search for lower-timeframe confirmation between the M15 and H1 timeframes, since most of our higher-timeframe areas begin with the H4. Stops are usually placed 1-3 pips beyond confirming structures.
EUR/USD
During the course of Tuesday's sessions, the H4 candles briefly rose above the 1.18 handle and touched a high of 1.1823. As you can see though, price failed to generate much follow through beyond this point thanks largely to a strong US JOLTS report.
The unit ended the day aggressively whipsawing through both the mid-level support at 1.1750 and neighboring demand coming in at 1.1723-1.1744, likely triggering a truckload of sell stops in the process and potentially opening up the path south to the 1.17 neighborhood.
What yesterday's move also accomplished was a marginal break below weekly resistance at 1.1759. Considering that last week's action printed a strong-looking weekly selling wick, this move has likely sparked interest among the candlestick community. At the same time, however, one may want to take into account that daily flow recently reconnected with demand pegged at 1.1650-1.1733.
Our suggestions: With H4 price yet to close below 1.1750 and the daily candles seen trading from demand, we're reluctant to sell this market at this time. Unfortunately, buying is also a challenge at the moment, given the nearby daily supply at 1.1870-1.1786.
With that in mind, our team has concluded that remaining flat is the better path to take for now.
Data points to consider: No high-impacting news events scheduled on the docket today.
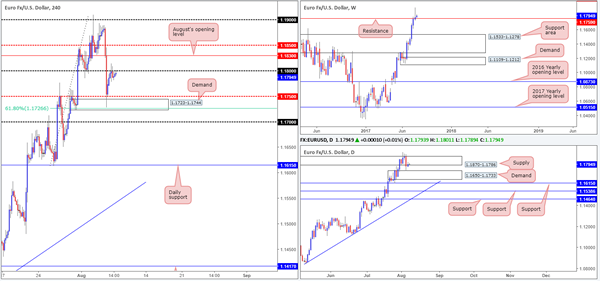
Levels to watch/live orders:
- Buys: Flat (stop loss: N/A).
- Sells: Flat (stop loss: N/A).
GBP/USD:
In recent trading, we saw the GBP/USD cross below the large psychological band 1.30 and come within touching distance of connecting with the H4 mid-level support at 1.2950. Right now, however, the H4 candles look poised to retest 1.30 as resistance. There are several features about this number that deserves mention. Fusing closely with this number is July's opening level at 1.3003 and a H4 broken Quasimodo line at 1.3007. Also of particular interest is the recent break below the daily support area marked at 1.3058-1.2979, and weekly price seen trading from supply coming in at 1.3120-1.2957.
Our suggestions: If you're thinking of selling from the 1.30 neighborhood today, stops can be placed around the 1.3015ish range, above a small M30 supply (1.3012-1.3003) that is positioned closely around the above noted H4 resistances. Should the trade come to fruition, the initial area of concern would be 1.2950, which if achieved would already provide over three times one's risk.
Data points to consider: No high-impacting news events scheduled on the docket today.
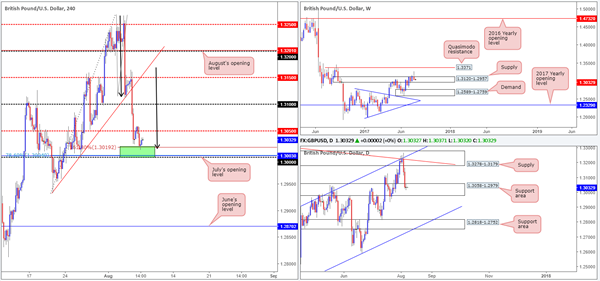
Levels to watch/live orders:
- Buys: Flat (stop loss: N/A).
- Sells: 1.30 region (stop loss: 1.3015).
AUD/USD
The 0.79 handle, as you can see, continues to provide a floor of support in this market, managing to withstand several bearish attacks over the past few weeks. Despite 0.79 fusing with two H4 trendline supports (0.7874/0.7635) and being positioned within daily demand at 0.7874-0.7922, the reactions from this psychological band appear to be weakening. This – coupled with weekly price showing space for the market to trade as far down as a support area coming in at 0.7849-0.7752, we believe that 0.79 is vulnerable.
Our suggestions: On account of the above notes, our team is now watching for H4 price to close below 0.79. A close lower followed by a retest and a H4 bearish candle, preferably in the shape of a full, or near-full-bodied candle, would, in our humble opinion, be enough evidence to suggest a short. The first take-profit zone would be the H4 mid-level support at 0.7850 (largely because this denotes the top edge of the noted weekly support area), followed closely by a daily broken Quasimodo line at 0.7819.
Data points to consider: Chinese inflation figures at 2.30am GMT+1.
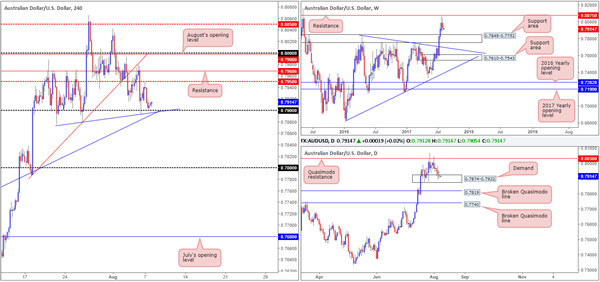
Levels to watch/live orders:
- Buys: Flat (stop loss: N/A).
- Sells: Watch for H4 price to engulf 0.79 and then look to trade any retest seen thereafter ([waiting for a H4 bearish candle (preferably a full, or near-full-bodied candle) to form following the retest is advised] stop loss: ideally beyond the candle's wick).
USD/JPY
Using a top-down approach this morning, we can see that weekly price continues to trade towards a small demand pegged at 108.13-108.95. In conjunction with the weekly timeframe, daily price recently drove lower from a resistance level penciled in at 110.76. This level, as you can see, has a strong history and therefore could continue to hold the unit lower and clear the pathway south down to a Quasimodo support at 109.11 (converges closely with a trendline support taken from the low 108.13).
Across on the H4 chart, August's opening level at 110.30 was recently engulfed, with price now seen trading within striking distance of the 110 handle. While this number fuses with a H4 trendline support etched from the low 108.80, we're reluctant to buy here due our notes on higher-timeframe structure.
Our suggestions: At the time of writing, we do not see a lot to hang our hat on at the moment. Buying would place one against potential higher-timeframe sellers, and selling would involve shorting into 110 and its converging trendline!
Data points to consider: No high-impacting news events scheduled on the docket today.
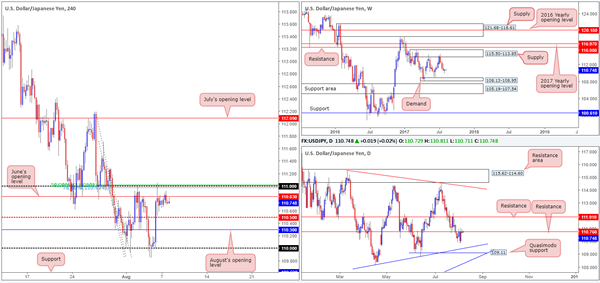
Levels to watch/live orders:
- Buys: Flat (stop loss: N/A).
- Sells: Flat (stop loss: N/A).
USD/CAD
Near term, H4 price is seen trading from a somewhat neutral standpoint amid the 1.27 handle and the mid-level support band at 1.2650. Loitering directly above 1.27 is a strong-looking supply area coming in at 1.2747-1.2722, whereas below 1.2650 the 1.26 handle is likely going to be the next hurdle in the firing range.
With daily price seen trading within the walls of a resistance area at 1.2654-1.2734, shorting this market would, on the face of it, likely be the better move. The H4 supply, in our opinion, would be a tasty zone to sell from since not only is located within the said daily resistance area, but also the stops placed above 1.27 would likely provide enough liquidity for the big boys to sell in to. There's one cautionary point to consider here, however, and that is weekly price seen trading strongly from a support area at 1.2433-1.2569.
Our suggestions: To become buyers in this market, we would still prefer to see a clear break (close) above the current daily resistance area. Despite what the weekly timeframe suggests, buying into the current daily structure is a risk we're just not willing to take here. We would, however, consider selling this market from the current H4 supply following a close back below 1.27, given the current trend and daily resistance area. A move below 1.27 from the H4 supply, for us, would confirm lower prices down to at least the 1.26 neighborhood.
Data points to consider: Crude oil inventories at 3.30pm GMT+1.
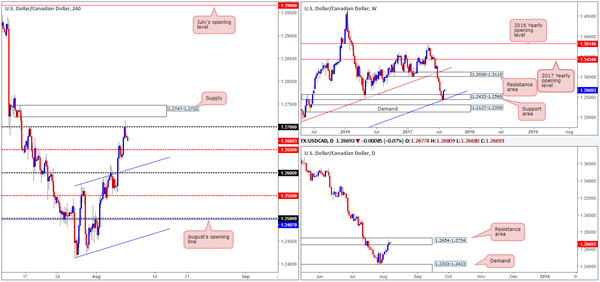
Levels to watch/live orders:
- Buys: Flat (stop loss: N/A).
- Sells: 1.2747-1.2722 ([tradable following a close below 1.27] stop loss: ideally beyond the H4 candle's wick).
USD/CHF:
Overnight in the US session, the US dollar rallied to a high of 0.9772 fueled by an upbeat US JOLTS report. However, it was not long after this did we see the bears make an appearance. Technically speaking, the move lower should have not really come as much of a surprise. On the H4 chart, we were dealing with a Quasimodo resistance level at 0.9762 and also an AB=CD (black arrows) 161.8% Fib ext. at 0.9763. Also noteworthy is weekly price trading from a major weekly trendline resistance extended from the low 0.9257, and the recent near-touch of a daily Quasimodo resistance at 0.9776 that has sent price back into the walls of a daily supply at 0.9738-0.9691.
Our suggestions: To our way of seeing things, H4 action is likely going to continue pressing lower today until we reach the 0.97 handle. As of current price, we do not see any logical setup to take advantage of this move unless the unit retests the 0.9763/0.9750 region before challenging 0.97.
Data points to consider: No high-impacting news events scheduled on the docket today.
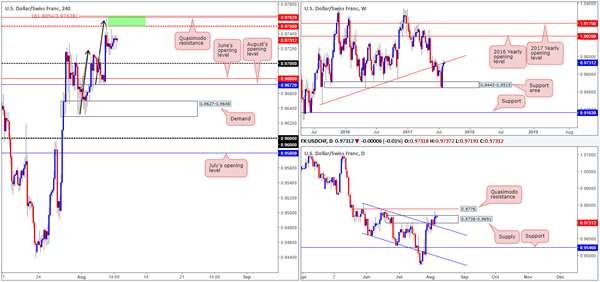
Levels to watch/live orders:
- Buys: Flat (stop loss: N/A).
- Sells: 0.9763/0.9750 ([waiting for a H4 bearish candle to form, preferably either a full, or near-full-bodied candle, is advised] stop loss: ideally beyond the candle's wick).
DOW 30
During the early hours of yesterday's US segment, H4 action once again challenged the ascending channel resistance drawn from a high of 21556. Currently, we do not see much in the way of support until August's opening level at 21913, so further selling could be on the cards today. As 21913 fuses almost perfectly with a H4 38.2% Fib support at 21911 (taken from the low 21484), we feel a bounce from this neighborhood could be seen.
Our suggestions: With this market currently entrenched within an incredibly strong uptrend which shows little sign of decelerating, a buy from the 21913 vicinity is of interest to our desk.
Just to be clear though, we would only consider a buy if one of the following two things happened:
H4 price tests 21913 once the market is in line with the neighboring channel support extended from the low 21273 (green circle).
The unit chalks up a H4 AB=CD approach.
To avoid any fakeout through 21913, nonetheless, we would also strongly recommend waiting for H4 price to chalk up a bullish candle in the shape of a full, or near-full-bodied candle. This, of course, will not guarantee a winning trade, but what it will do is show buyer intent from a high-probability buy zone.
Data points to consider: No high-impacting news events scheduled on the docket today.
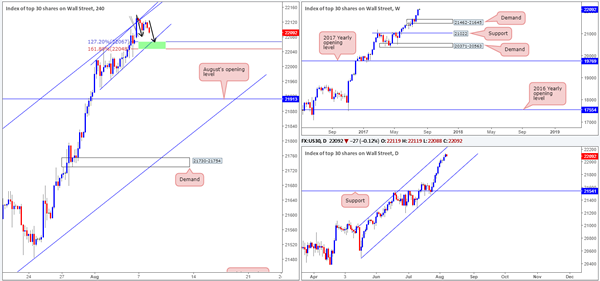
Levels to watch/live orders:
- Buys: 21913 region ([waiting for a H4 bullish candle to form, preferably either a full, or near-full-bodied candle, is advised] stop loss: ideally beyond the candle's tail).
- Sells: Flat (stop loss: N/A).
GOLD
As can be seen from looking at the H4 chart this morning, price remains trading within a descending channel (1274.1/1256.5). The support at 1254.3, which unties with a 61.8% Fib support at 1255.3 drawn from the low 1243.6 and a 50.0% support value at 1254.9 extended from the low 1235.1, along with daily support at 1258.9, likely helped lift the metal north yesterday.
With the H4 candles now seen testing the upper edge of the current descending channel, is shorting this unit the way to go? Personally, we don't have a lot of faith in the sell side of this market right now, mainly due to August's opening level sited just above current price at 1269.8 (as well as a H4 resistance at 1269.3), and the fact that weekly price shows room for the metal to extend up to the green weekly resistance zone comprised of two Fibonacci extensions 161.8/127.2% at 1312.2/1284.3 taken from the low 1188.1.
Our suggestions: Unfortunately, neither a long nor short seems attractive at the moment. Selling is not an option for us given the reasons stated above, and buying into the H4 channel resistance line and nearby H4 resistances (even though we believe they will eventually give way) is not something our team would feel comfortable participating in.
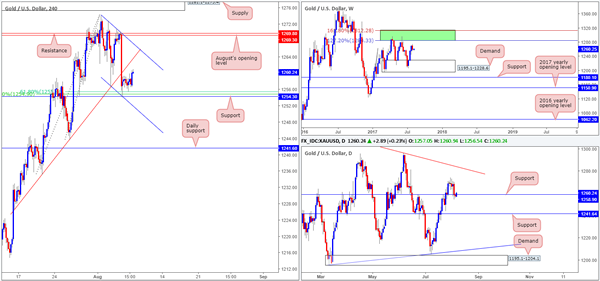
Levels to watch/live orders:
- Buys: Flat (stop loss: N/A).
- Sells: Flat (stop loss: N/A).
GBP/JPY Daily Outlook
Daily Pivots: (S1) 142.87; (P) 143.66; (R1) 144.16; More
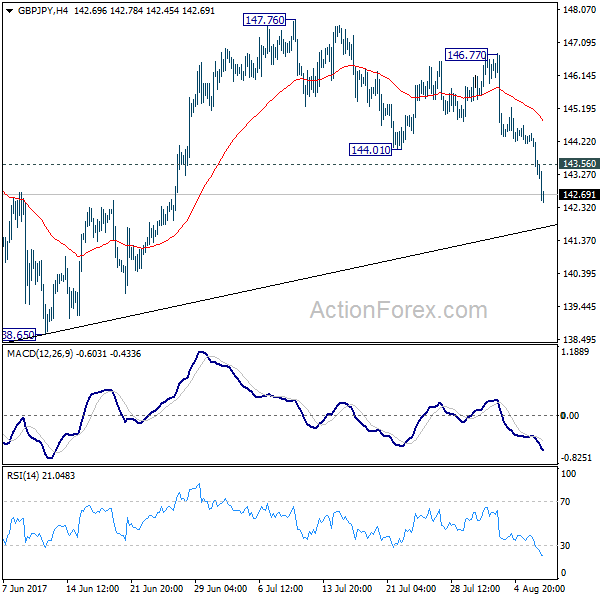
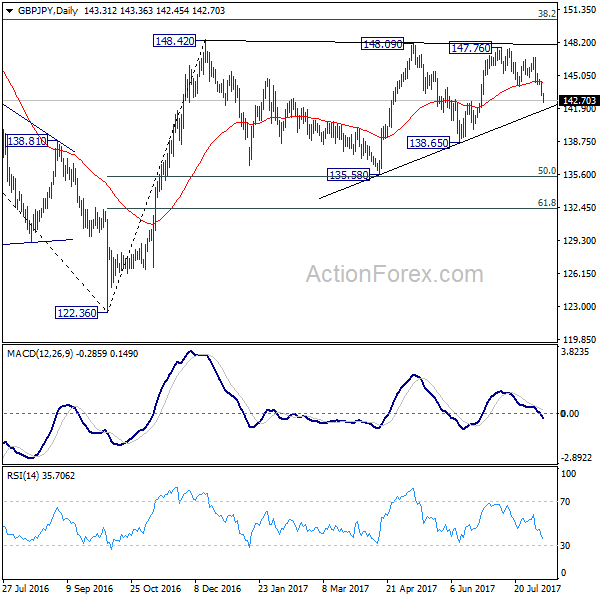
GBP/JPY's decline accelerates after breaking 144.01 and reaches as low as 142.51 so far. Intraday bias remains on the downside for trend line support (now at 141.87). Further break there will target 135.58/138.65 support zone. As GBP/JPY is seen as staying in consolidation pattern from 148.42, we'd expect strong support from 135.58 to contain downside. On the upside, above 143.56 minor resistance will turn intraday bias neutral first. But break of 146.77 is needed to signal completion of the fall from 147.76. Otherwise, near term outlook will now be cautiously bearish.
In the bigger picture, rise from medium term bottom at 122.36 is expected to continue to 38.2% retracement of 196.85 to 122.36 at 150.43. Decisive break there will carry long term bullish implications and pave the way to 61.8% retracement at 167.78. In case the sideway pattern from 148.42 extends, we'd be looking for strong support from 135.58 and 50% retracement of 122.36 to 148.42 at 135.39 to contain downside.
Yen Surges on Trump’s “Fire and Fury” Warning to North Korea
Yen surges broadly together with Swiss Franc as there are renewed focus on the tension between US and North Korea. US President warned overnight that North Korea "best not make any more threats to the United States". And, Trump said that "they will be met with fire, fury and, frankly, power the likes of which this world has never seen before." That's in response to North Korea's claim that it's ready to give US a "severe lesson". And North Korea claim that it's examining plans to strike US territory Guam. Analysts perceived Trump's response as aggressive. The comments sent DOW down to closed -0.15% lower at 22085.34, comparing to intraday high at 22179.11. USD/JPY breached 109.83 and is resuming recent decline from 114.49.
Professionals less optimistic on Trump's tax reforms
Politics aside, there is little news about Trump's economic policies. And businesses are getting less optimistic on the tax reform that Trump has yet to start to push through legislation. According to a survey by Deloitte Tax LLP, 3100 tax, finance and business professionals were surveyed. Under half of the respondents saw the tax reform as a main economic driver ahead. And nearly 40% predicted corporate income tax rate to end up at 25%, much higher that the 15% that Trump targets to drive to. 74% were doubtful or not confident that a comprehensive tax reform bill would be enacted within 2017. And, less that 19% were confidence or somewhat confident that it's going to happen this year.
Dollar lifted by JOLTS temporarily
Dollar rebounded overnight as latest data showed further tightening in the labor market. The Labor Department said that job openings rose 461k to 6.2m in June. That's a record high since the series began back in 2000. Growth in job market has been healthy for a while as indicated be job related data this year. The key to determine whether Fed would hike again by the end of lies on inflation data. CPI to be released on Friday will be a more important event to watch. The Dollar index hit as high as 93.87 as rebound from 92.54 resumed. But it's still limited well below 94.28 near term resistance. Nonetheless, Dollar was clearly firm against Sterling and Canadian. EUR/USD also breached last week low at 1.1727 while AUD/USD broke 0.7877 support. The greenback is only weaker against Yen and Swiss Franc.
On the data front, Japan M2 rose 4.0% yoy in July. China CPI slowed to 1.4% yoy in July, PPI was unchanged at 5.5% yoy. Australia Westpac consumer confidence dropped -1.2% in August, home loans rose 0.5% in June. Looking ahead, US non-farm productivity and and unit labor costs are the main feature for the rest of the day.
GBP/JPY Daily Outlook
Daily Pivots: (S1) 142.87; (P) 143.66; (R1) 144.16; More
GBP/JPY's decline accelerates after breaking 144.01 and reaches as low as 142.51 so far. Intraday bias remains on the downside for trend line support (now at 141.87). Further break there will target 135.58/138.65 support zone. As GBP/JPY is seen as staying in consolidation pattern from 148.42, we'd expect strong support from 135.58 to contain downside. On the upside, above 143.56 minor resistance will turn intraday bias neutral first. But break of 146.77 is needed to signal completion of the fall from 147.76. Otherwise, near term outlook will now be cautiously bearish.
In the bigger picture, rise from medium term bottom at 122.36 is expected to continue to 38.2% retracement of 196.85 to 122.36 at 150.43. Decisive break there will carry long term bullish implications and pave the way to 61.8% retracement at 167.78. In case the sideway pattern from 148.42 extends, we'd be looking for strong support from 135.58 and 50% retracement of 122.36 to 148.42 at 135.39 to contain downside.
Economic Indicators Update
| GMT | Ccy | Events | Actual | Forecast | Previous | Revised |
|---|---|---|---|---|---|---|
| 23:50 | JPY | Japan Money Stock M2+CD Y/Y Jul | 4.00% | 3.90% | 3.90% | |
| 0:30 | AUD | Westpac Consumer Confidence Aug | -1.20% | 0.40% | ||
| 1:30 | CNY | CPI Y/Y Jul | 1.40% | 1.50% | 1.50% | |
| 1:30 | CNY | PPI Y/Y Jul | 5.50% | 5.60% | 5.50% | |
| 1:30 | AUD | Home Loans Jun | 0.50% | 1.50% | 1.00% | 1.10% |
| 6:00 | JPY | Machine Tool Orders Y/Y Jul P | 31.10% | |||
| 12:30 | CAD | Building Permits M/M Jun | -1.90% | 8.90% | ||
| 12:30 | USD | Non-Farm Productivity Q2 P | 0.80% | 0.00% | ||
| 12:30 | USD | Unit Labor Costs Q2 P | 1.10% | 2.20% | ||
| 14:00 | USD | Wholesale Inventories Jun F | 0.60% | 0.60% | ||
| 14:30 | USD | Crude Oil Inventories | -1.5M | |||
| 21:00 | NZD | RBNZ Rate Decision | 1.75% | 1.75% |
Gold Rallies In The Face Of Increased Geopolitical Risk
Key Points:
- U.S. Red Book signals slipping Retail Sales data.
- RSI Oscillator remains on an upward trajectory in neutral territory.
- The U.S. Core CPI result is likely to determine the near term fundamental trend
Gold prices firmed overnight to close around the $1260.75 an ounce mark as the precious metal reacted to a range of increased risk emanating from renewed tension on the Korean Peninsula. However, there is more than just the ongoing North Korean situation fuelling the drive with the latest U.S. Red Book figures showing Retail Sales slipping fractionally to 2.6% y/y. Subsequently, it's prudent to take a cursory review of the technical and fundamental outlook for the precious metal.
From the technical perspective, Gold has continued to trade within a relatively narrow range with yesterday's session bringing further consolidation with the top at $1274, from early August, dominating proceedings. In addition, the RSI Oscillator is still exhibiting a longer term bullish trend, on the daily timeframe, whilst it presently remains within neutral territory. At this stage, Gold's near term support is at $1255, which also represents the Ichimoku cloud bottom, whilst the upside presents a hurdle at $1275 of which a break above could see the metal trading around the $1295 mark. Subsequently, declines back towards the cloud bottom represent key buying areas of which the market is cognizant of.
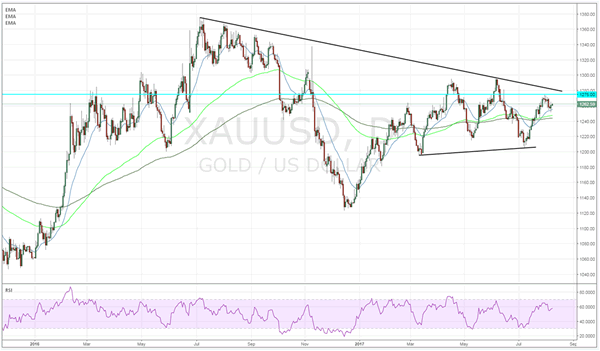
Fundamentally, Gold has experienced a small pullback following Friday's stronger U.S. Jobs Numbers and renewed capital flows into the greenback. However, at this stage everything is likely to remain relatively quiet ahead of the inflation data which is due out late in the week. The broad market consensus is for Core CPI to rise to 0.2% m/m (0.1% prev) but expect some variability given the recent slip in retail sales as well as instability within oil markets. Subsequently, the risks are largely on the downside for the result which would send Gold rallying higher to challenge the $1275 resistance point.
Additionally, as perverse as it armed conflict is, Gold typically benefits from its status as a safe haven asset in times of political and economic turmoil. If indeed the present crisis with North Korea turns to armed conflict then Gold will rise strongly as capital clamours for a safe haven amongst the carnage that is sure to come. Subsequently, it would be worthwhile keeping abreast of the crisis because, if/when action occurs, Gold prices will move rapidly.
Ultimately, the forward risks for Gold are weighted to the upside in both the technical and fundamental cases. A likely scenario for the metal would be the release of a less than stellar U.S. Core CPI result which results in some sharp gains for the metal above the $1275 an ounce mark. If this was to occur we could see a renewed bullish leg for the precious metal in the weeks ahead.
Market Morning Briefing: Contrary To Expectations
STOCKS
Major stock indices are in a corrective mode which is likely to continue for a couple of more sessions before we see a recovery.
Dow (22085.34, -0.15%) moved up straight to 22180 yesterday before coming off sharply to close below 22100. Some corrective dip is possible in the next few sessions before the price index again starts to move up. The current fall could extend towards 22000 in the near term.
Dax (12292.05, +0.28%) is almost stable and is possibly in a sideways consolidation mode. There is scope of a rise towards 12400-12500 while above 12200. Near term looks bullish.
Shanghai (3269.08, -0.40%) has dipped slightly but while above 3240, near term looks bullish towards 3300.
Nikkei (19739.88, -1.28%) fell off sharply from levels near 20000 to re-test earlier support of 19700. In case the price index breaks below 19700, we could see the fall extend towards 19450; else a bounce back from current levels looks more likley.
Nifty (9978.55, -0.78%) made an intra-day low of 9947 (also an immediate support) yesterday in line with our expectation. While the support near 9950/30 holds, we could see a bounce back towards 10100-10200 in the near term. A break below 9930-9900 if seen could bring in lower levels but we need to wait for some price confirmation. For now near term is likely to be bullish.
COMMODITIES
Minor appreciation is seen in Gold (1264.87) as it holds above the support of 1245. Only on a break below 1245, lower levels of 123-10 may come into consideration.
Silver (16.51), contrary to expectations rose above the resistance of 16.50, making the trend neutral. It may oscillate in the range of 16.00-17.00 for a few session now.
Copper (2.94) is rising towards our immediate target of 3.00 in line with expectations, above which comes the target of 3.12. Support comes up at 2.86.
Absence of any fresh trigger has kept Brent (51.90) and WTI (49.00) very quiet for the last two sessions. Repeat - the bullish stance remains unchanged as long as Brent is trading above 48.70 and WTI above 45.50 levels on a weekly closing basis.
FOREX
Geopolitical tensions between US and North Korea has tempered the risk appetite a bit, driving Dollar-Yen (109.90)to the lower end of the near term range of 109.30-111.10. If the support of 109.50-30 holds, then a recovery to 111.00 levels can be expected in the coming sessions.
The strength in Yen and weakness in Euro (1.1735) has pushed EURJPY (128.95) below the trendline support and towards the 5-week low around 128.55, which must hold to keep the upside possibilities intact. On the other hand, a break below 128.50 for EURJPY may imply extended weakness for Euro, which in that case may decline to 1.16 levels.
Dollar Index (93.66) may test the resistance of 94.10-40 if Euro keeps going down towards 1.16 before the Dollar bears return.
Pound (1.2983) has met our immediate downside target of 1.2950 but the decline may not be over yet. A corrective bounce from 1.2950-30 can’t be ruled out but the larger downtrend may drive it down to 1.2850 levels in the coming days.
Contrary to expectations, Aussie (0.7873) extended its correction beyond 0.7875 despite a rise in Copper (See Commodities section).While the correction remains shallow considering the sharp rally from the May low of 0.7325 to the July high of 0.8065 and the broader trend remains firmly up, a break above 0.7950 is required to resume the larger uptrend.
Major downtrend may have resumed for Dollar Rupee (63.80) and fresh lows below 63.55 can be expected as long as 63.80-85 holds. The major support of 63.25 may be tested by the end of the week.
INTEREST RATES
The US yields have risen slightly. The 10YR (2.28%) is up from 2.26% seen yesterday and could test immediate resistance near 2.30% from where another dip towards 2.25% is possible.
The UK yields are falling sharply and could continue to fall in the coming sessions. The 10YR (1.15%) could be headed towards 1.10% in the near term.
The UK 10-5 YR yield differential (0.6150%) may come off in the near term as it has faced rejection from important resistance levels.
The Japan yields could fall in the next few sessions. The 10Yr (0.07%) and the 30YR (0.86%) could come down towards 0.05% and 0.84% in the near term.
Brent Oil Setting Up For Another Momentum
Brent moves in range on the short term, right below the 53.03 static resistance, remains to see if this will be an accumulation or a distribution movement. A minor drop was expected after the failure to close above the 53.03 level. Is trading within a minor ascending channel, so he could come to retest the downside lie of this pattern before will decide where to go.
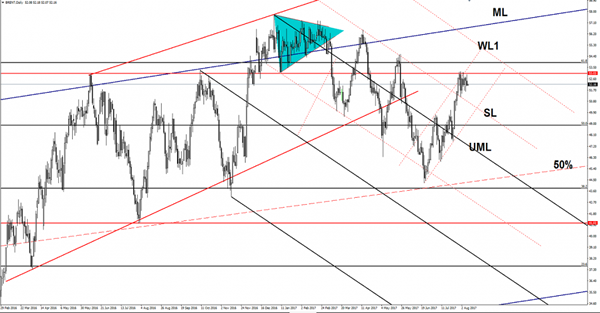
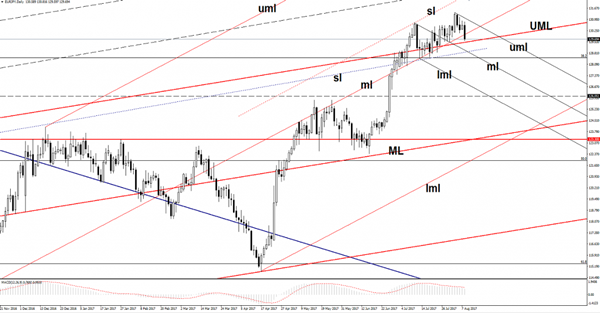
EUR/JPY Another Leg Lower?
Price is very heavy on the Daily chart and looks unstoppable. You can see that has resumed the bearish movement and dropped below the median line (ml) of the black ascending pitchfork. Right now is approaching the upper median line (UML) of the red ascending pitchfork. A valid breakdown below this level will signal a potential leg lower. I want to remind you that support can be found at the sliding line (SL) and at the 38.2% retracement level as well, but a larger drop could come after the failure to approach and reach the sliding line (sl) of the black ascending pitchfork.
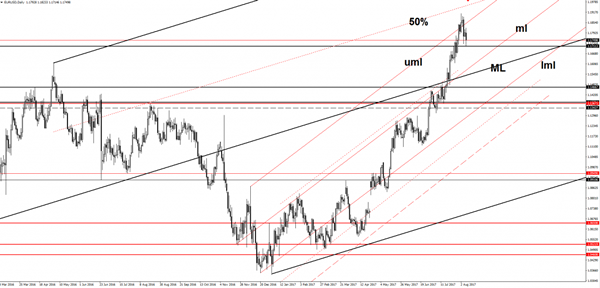
EUR/USD Losing Altitude
Price dropped aggressively after the United States data were released, the greenback received a helping hand from the positive numbers. EUR/USD is in a corrective phase, but this will be temporary if the US will fail to jump and to stabilize somewhere above the 94.00 psychological level.
USDX rebounded on the short term and now is very close to hit a dynamic resistance. The dollar index rallied and erased the morning losses, but has found temporary resistance at the 93.91 level.
Is premature to say that we’ll have a larger rebound on the USDX, only further positive US data will help the greenback to dominate the currency again. USD was boosted by the US numbers in the afternoon, the JOLTS Job Openings increased from 5.70M to 6.16M in June, beating the 5.74M estimate, while the NFIB Small Business Index increased from 103.6 to 105.2 points, exceeding the 103.6 estimate, moreover the IBD/TIPP Economic Optimism increased from 50.2 to 52.2 points, beating the 50.6 estimate.
Price extended the sell-off, but was stopped by the 1.1711 static support, only a valid breakdown below this level will confirm a further drop. I’ve said in the previous days that the rate could start a minor consolidation above the 1.1711 downside obstacle till will reach and retest the median line (ml) of the minor ascending pitchfork. The minor correction is natural after the false breakout above the upper median line (uml) and after the failure to reach and retest the 50% Fibonacci line (ascending dotted line). A reversal could be confirmed only if will drop and will stabilize below the median line (ML) of the major ascending pitchfork.
JOLTS Jolted The Dollar
JOLTS jolted the dollar
The market bounced back to life Tuesday as the Greenback was jolted by the JOLTS data
The JOLTS jobs data was through the roof printing an all time record high and ignited a USD rally. But that was only half the positive storyline as a boisterous NFIB small business survey painted a much better picture for the US economy than most believed
Two-way dollar risk is creeping back into the market calculus as chatter builds that the Fed curve is underpriced
Speaking of Fed curves, the market is very keen to hear Fed Bill Dudley on Thursday – he's been off the wires for a while.When the president of the powerful Federal Reserve Bank of New York speaks, the market listens. Given the recent run of solid employment data and a glint of inflation hitting the US economy, it's possible he could provide a more sanguine view of the US economy while confirming the Fed is on track for a December rate hike.
But of course the Washington DC bedlam and North Korea's sabre -rattling is muddying the broader landscape.
Japanese Yen
The North Korean headlines will be in focus after the Washington Post reported North Korea has successfully produced a miniaturised nuclear warhead that can fit inside its missiles, crossing a key threshold on the path to becoming a full-fledged nuclear power, US intelligence officials have concluded in a confidential assessment.'
USDJPY has predictably come under pressure on YEN haven demand
Headlines are in full churn as reports are circulating North Korea is 'carefully examining' a plan to strike the U.S. Pacific territory of Guam with missiles, after U.S. President Donald Trump told the North that any threat to the United States would be met with 'fire and fury'.
Euro
Another washout on EURO longs after the sturdy JOLTS jobs report. While by no means a return to US dollar glory days, the Euro is feeling a bit of pressure from the strong US economic data prints. Although the Euro has been trading poorly the past few days, the dips remain relatively shallow and not overly encouraging for the US dollar bulls, as few as they may be.
Australian Dollar
The Australian dollar is trading in line with the broader USD strength.
Yesterday saw another solid NAB business conditions number keeping the Aud supported well above the key 0.7875 level. But the rally petered out at .7939 as we are starting to get lower highs on the shorter duration suggesting the .7875 could prove a magnetic level over the near term.But this is all about the USD and if we see a further extension on the US dollar correction that possibility could materialize.But in the meantime, traders look to keep powder dry until Friday, where all roads lead to the US CPI
On a side note, given Australia's vital role in the APAC supply chain, it worth keeping an eye on the escalation of regional geopolitical risk as this could dampen sentiment quickly.
Gold Edges Lower as JOLTS Employment Report Sparkles
Gold has posted slight losses in the Tuesday session. In North American trade, spot gold is trading at $1254.74, down 0.23% on the day. On the release front, there was only one major event. JOLTS Jobs Openings JOLTS Jobs Openings jumped to 6.16 million, well above the estimate of 5.74 million. This marked a record high, and comes on the heels of last week's strong nonfarm payrolls report. On Wednesday, the US releases two employment indicators – Preliminary Nonfarm Productivity and US Preliminary Unit Labor Costs.
Gold prices have risen in recent weeks, taking advantage of a struggling US dollar. Investor appetite for the US dollar has softened, as political risk has been growing and there are doubts if the Fed will raise rates before 2018. President Trump's administration seems rudderless and Trump's inability to pass healthcare legislation has increased political risk in the US. As well, the Federal Reserve's monetary policy remains unclear. Earlier this year the Fed strongly hinted that it planned to raise rates three times in 2017, but has only pressed the rate trigger twice. In June, Fed Chair Janet Yellen shrugged off low inflation, saying that it was due to "transient" factors, leaving the impression that the Fed still planned one final hike. However, inflation has not improved and the Fed has changed its tune. Last week, St. Louis Federal Reserve President James Bullard said he opposed further Fed hikes, warning that another hike would actually delay inflation from hitting the Fed's target of 2%. The markets have become more skeptical about a rate hike in December, as the odds have fallen to 33%, compared to 43% a week ago.
The US economy continues to grapple with weak inflation, which is also apparent in the labor market. Although the nonfarm payrolls report in July easily beat expectations and the unemployment rate dropped from 4.4% to 4.3%, wage growth remains a sore point. In July, Average Hourly Earnings remained unchanged at 0.3%, and the indicator has failed to break above 0.3% in 2017. The weakness in earnings growth has puzzled economists, as a red-hot labor market should translate into higher wages. In fact, wage growth has actually slowed in 2107, and this could have significant economic repercussions, as consumers are responding by holding tight on the purse strings and reducing spending.