Sample Category Title
Euro Weakens: EUR/USD Faces Growing Downside Risks
Key Highlights
- EUR/USD failed to recover above 1.0450 and declined again.
- A short-term bearish trend line is forming with resistance at 1.0300 on the 4-hour chart.
- GBP/USD accelerated losses below the 1.2250 support.
- Crude oil prices surged above the $75.00 and $76.00 levels.
EUR/USD Technical Analysis
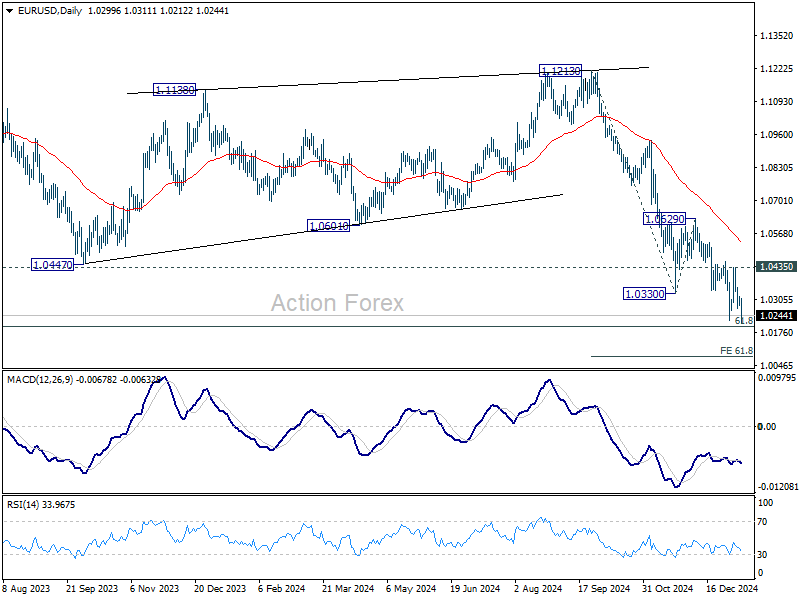
The Euro remained in a bearish zone below 1.0450 against the US Dollar. EUR/USD started another decline below the 1.0400 and 1.0350 levels.
Looking at the 4-hour chart, the pair settled below the 1.0320 level, the 100 simple moving average (red, 4-hour), and the 200 simple moving average (green, 4-hour). The pair tested the 1.0215 zone and is currently consolidating losses.
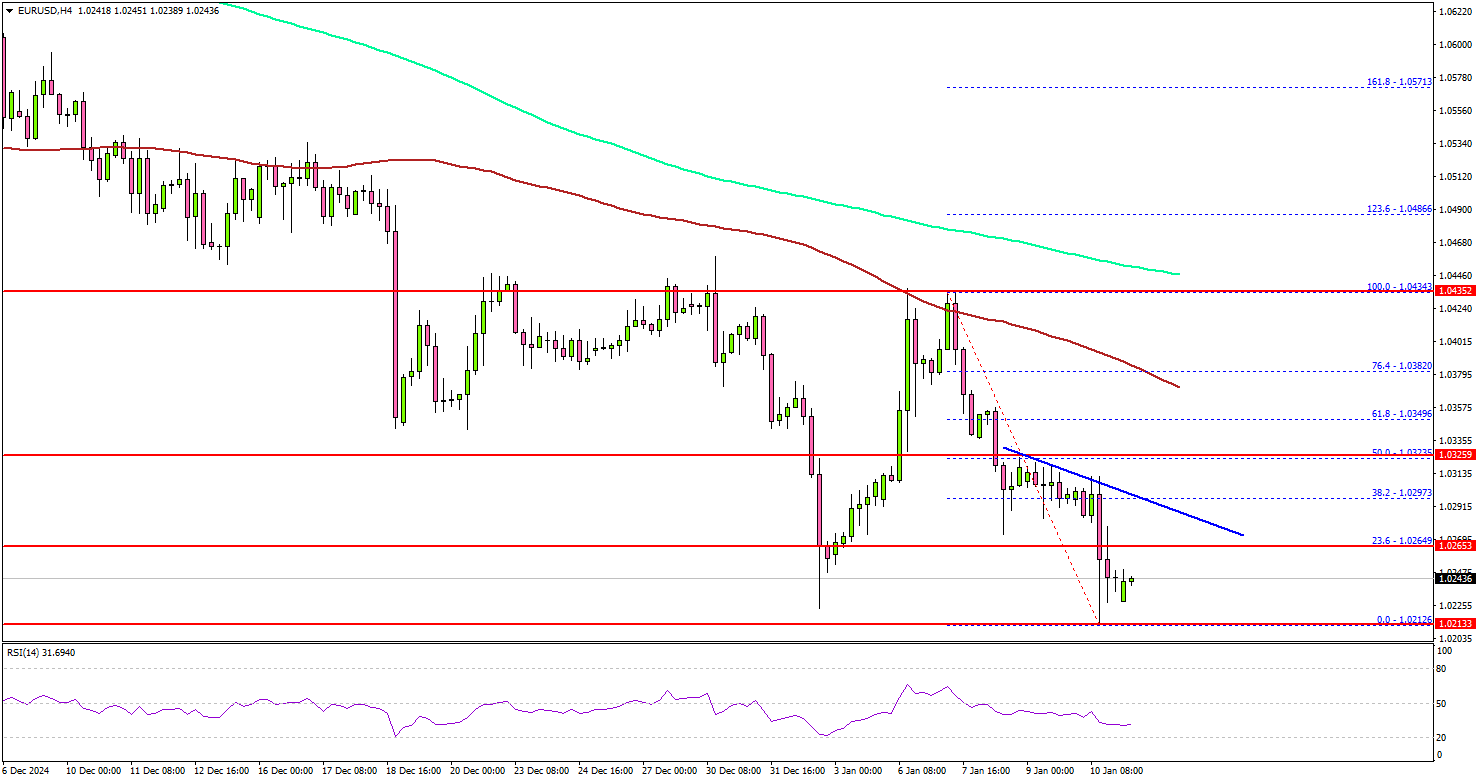
On the upside, the pair is facing hurdles near the 1.0300 level. There is also a short-term bearish trend line forming with resistance at 1.0300 on the same chart.
The first major resistance is near the 1.0335 level. The next major resistance is near the 1.0350 level. A close above the 1.0350 level could set the tone for another increase. In the stated case, the pair could rise toward the 1.0450 resistance.
On the downside, immediate support sits near the 1.0215 level. The next key support sits near the 1.0200 level. Any more losses could send the pair toward the 1.01120 level.
Looking at GBP/USD, the pair started another decline and the bears were able to push the pair below the 1.2250 support.
Upcoming Economic Events:
- US Producer Price Index for Dec 2024 (MoM) – Forecast +0.3%, versus +0.4% previous.
- US Producer Price Index for Dec 2024 (YoY) – Forecast +3.0%, versus +3.0% previous.
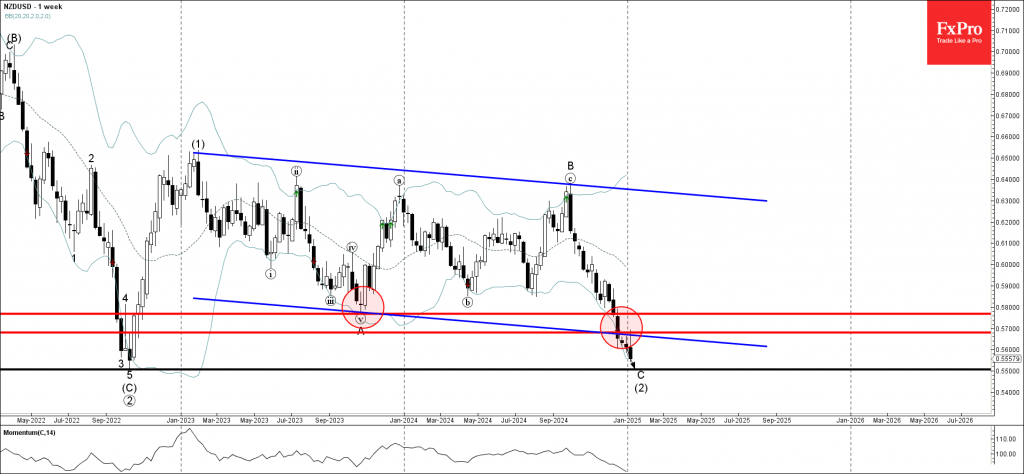
NZDUSD Wave Analysis
- NZDUSD falling inside weekly impulse wave C
- Likely to fall to support level 0.5500
NZDUSD currency pair recently reversed down from the lower trendline of the wide weekly down channel from the start of 2023 (which is acting as the resistance after it was broken in December).
The downward reversal from this down channel accelerated the active impulse C-wave of the weekly downward ABC correction (2) from the start of last year.
Given the strong downtrend on the weekly charts, NZDUSD currency pair can be expected to fall toward the next long-term support level 0.5500 (which stopped the sharp weekly downtrend at the end of 2022).
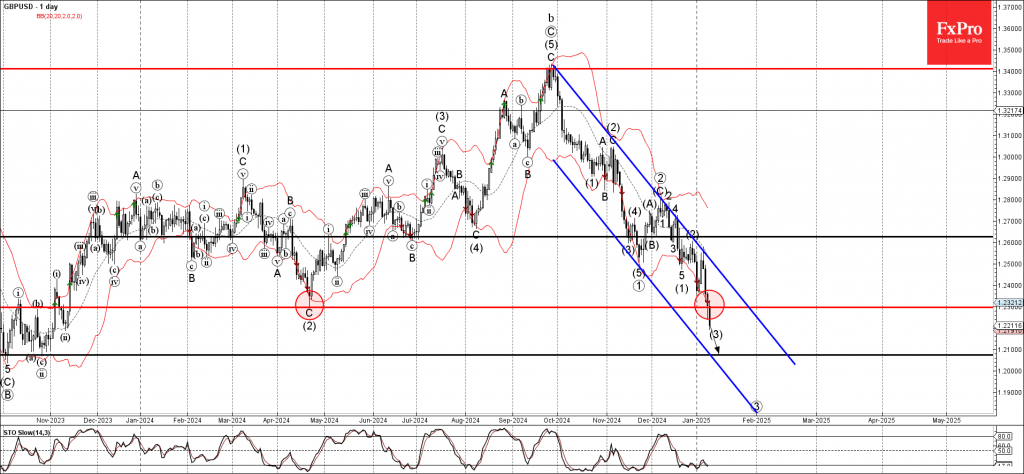
GBPUSD Wave Analysis
- GBPUSD broke key support level 1.2300
- Likely to fall to support level 1.2100
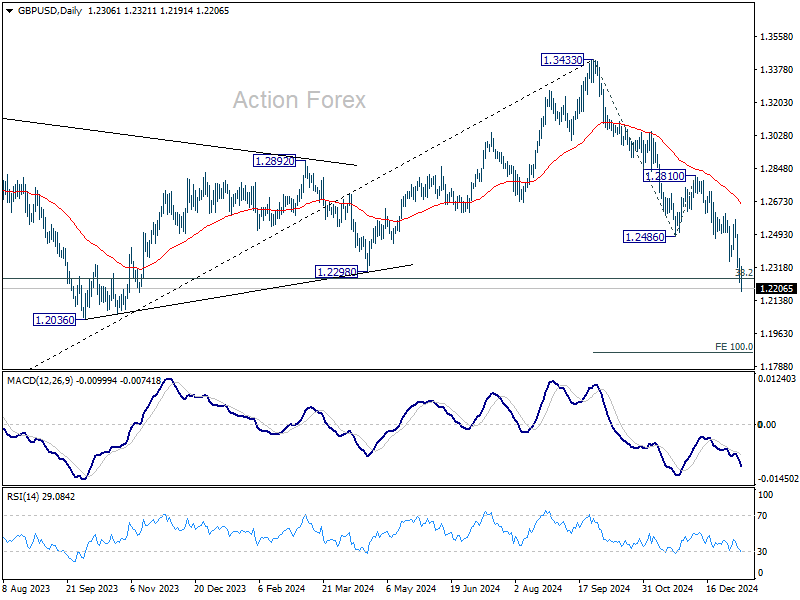
GBPUSD currency pair recently broke the key support level 1.2300 (former multi-month low from April of 2024, as can be seen below from the daily GBPUSD chart below).
The breakout of the support level 1.2300 accelerated the active medium-term impulse wave (3).
Given the medium-term downtrend on the daily charts, GBPUSD currency pair can be expected to fall toward the next support level 1.2100 (former major support from the end of 2023).
EUR/USD Weekly Outlook
EUR/USD's decline continued to stall above 1.0199 fibonacci level last week. Initial bias stays neutral this week first. But outlook will remain bearish as long as 1.0435 resistance holds. Decisive break of 1.0199 will resume the whole fall from 1.1213 to 61.8% projection of 1.1213 to 1.0330 from 1.0629 at 1.0083.

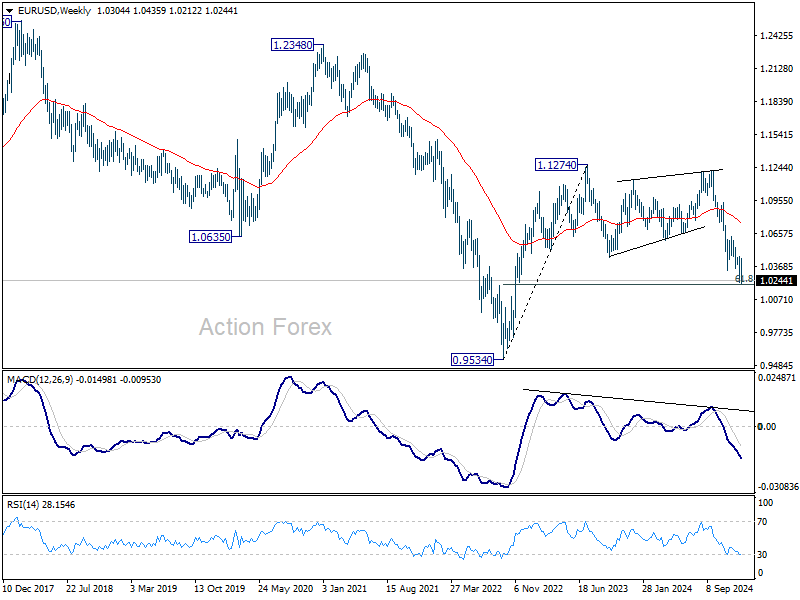
In the bigger picture, fall from 1.1274 (2023 high) should either be the second leg of the corrective pattern from 0.9534 (2022 low), or another down leg of the long term down trend. In both cases, sustained break of 61.8 retracement of 0.9534 to 1.1274 at 1.0199 will pave the way back to 0.9534. For now, outlook will stay bearish as long as 1.0629 resistance holds, even in case of strong rebound.
In the long term picture, down trend from 1.6039 remains in force with EUR/USD staying well inside falling channel, and upside of rebound capped by 55 M EMA (now at 1.0973). Consolidation from 0.9534 could extend further and another rising leg might be seem. But as long as 1.1274 resistance holds, eventual downside breakout would be mildly in favor.

USD/JPY Weekly Outlook
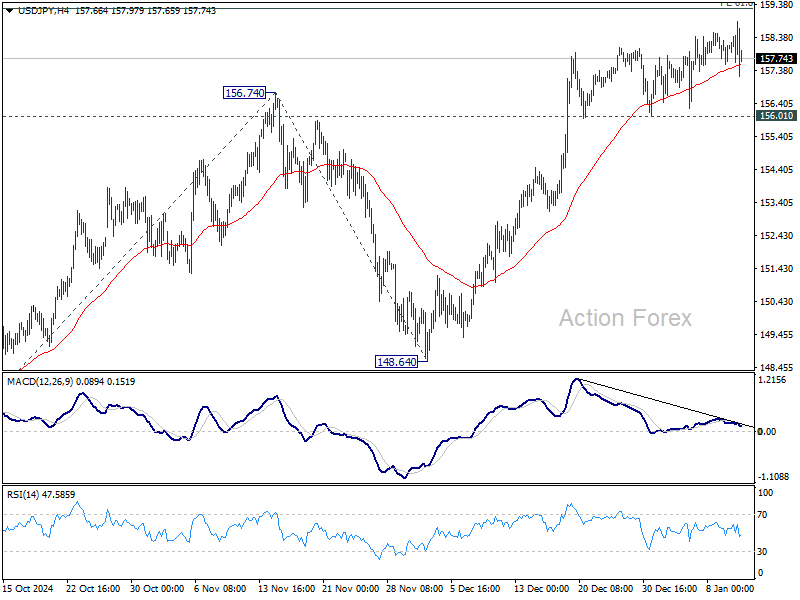
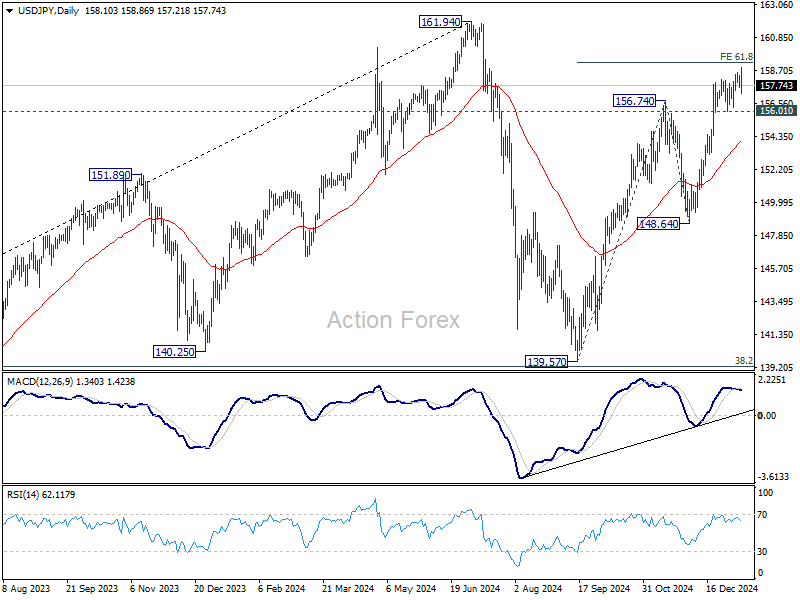
USD/JPY edged higher last week but upside momentum diminished, as seen in 4H MACD, as it approached 61.8% projection of 139.57 to 156.74 from 148.64 at 159.25. Initial bias is turned neutral this week first. On the upside, decisive break of 159.25 will extend the rally from 139.57 to retest 161.94 high. However, considering bearish divergence condition in 4H MACD, firm break of 156.01 support will indicate short term topping. Intraday bias will then be back on the downside for 55 D EMA (now at 154.13) instead.
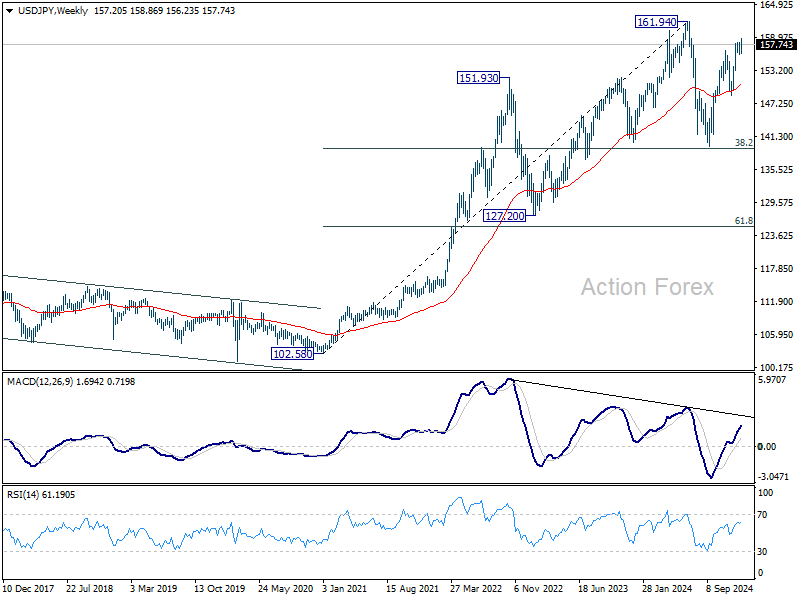
In the bigger picture, price actions from 161.94 are seen as a corrective pattern to rise from 102.58 (2021 low). The range of medium term consolidation should be set between 38.2% retracement of 102.58 to 161.94 at 139.26 and 161.94. Nevertheless, sustained break of 139.26 would open up deeper medium term decline to 61.8% retracement at 125.25.
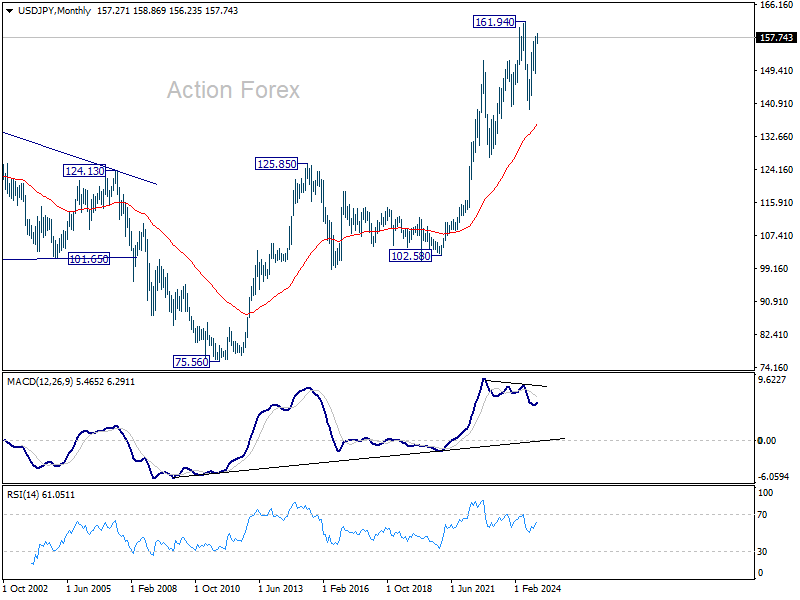
In the long term picture, it's still early to conclude that up trend from 75.56 (2011 low) has completed. A medium term corrective phase should have commenced, with risk of deep correction towards 55 M EMA (now at 136.02).
GBP/USD Weekly Outlook
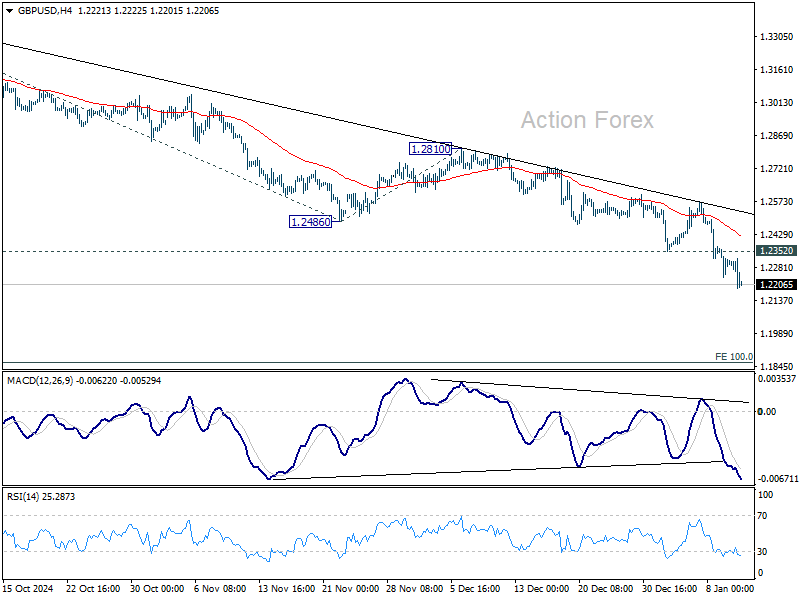
GBP/USD's downside acceleration last week and break of 1.2256 fibonacci level suggest larger bearish trend reversal. Initial bias stays on the downside this week. Next near term target is 100% projection of 1.3433 to 1.2486 from 1.2810 at 1.1863. On the upside, break of 1.2532 minor resistance will turn intraday bias neutral first. But risk will stay on the downside as long as 1.2486 support turned resistance holds.
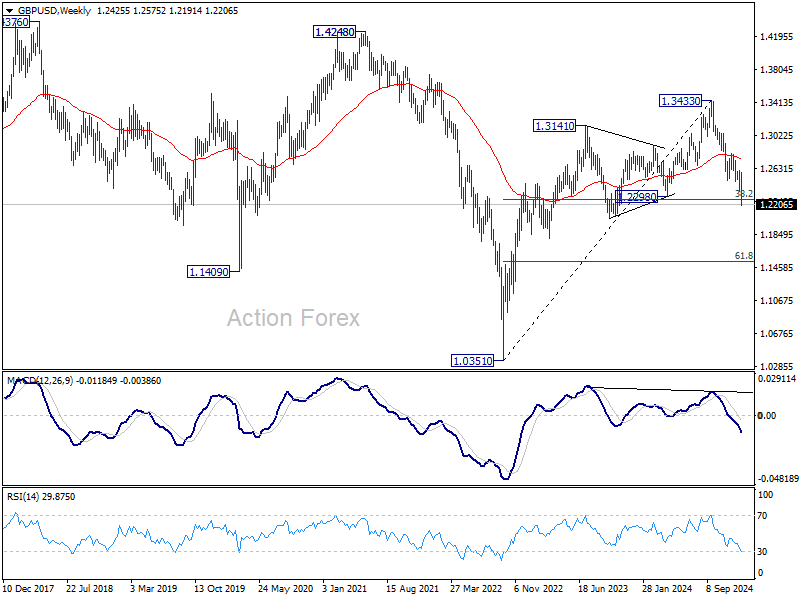
In the bigger picture, the close below 38.2% retracement of 1.0351 to 1.3433 at 1.2256 argues that rise from 1.0351 (2022 low) has already completed at 1.3433, and the trend has reversed. Further fall is now expected as long as 1.2810 resistance holds. Deeper decline should be seen to 61.8% retracement at 1.1528, even as a corrective move.
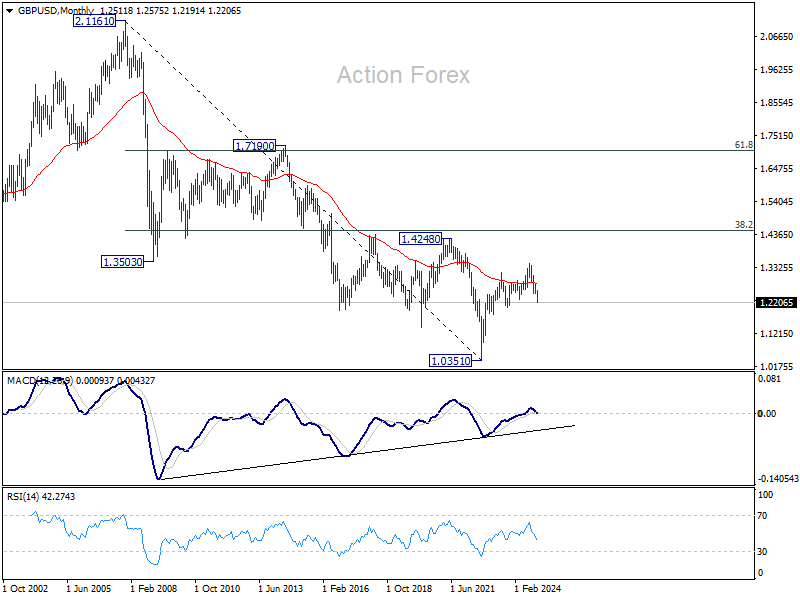
In the long term picture, price actions from 1.0351 (2022 low) are seen as a corrective pattern to the long term down trend from 2.1161 (2007 high) only. Outlook will be neutral at best as long as 1.4248 structural resistance holds, even in case of strong rebound.
USD/CHF Weekly Outlook
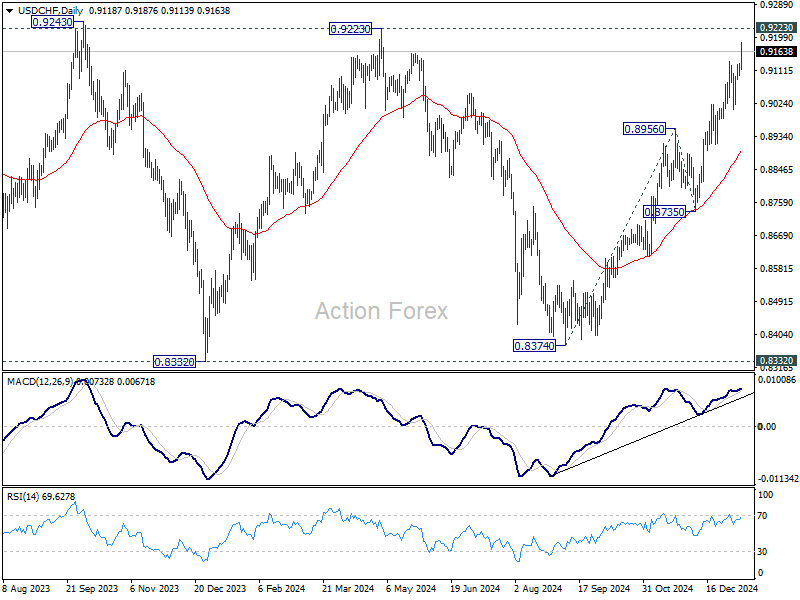
USD/CHF's rally from 0.8374 resumed last week and initial bias remains on the upside this week for 0.9223 key resistance next. Decisive break there will carry larger bullish implications. For now, near term outlook will stay bullish as long as 0.9007 support holds, in case of retreat.
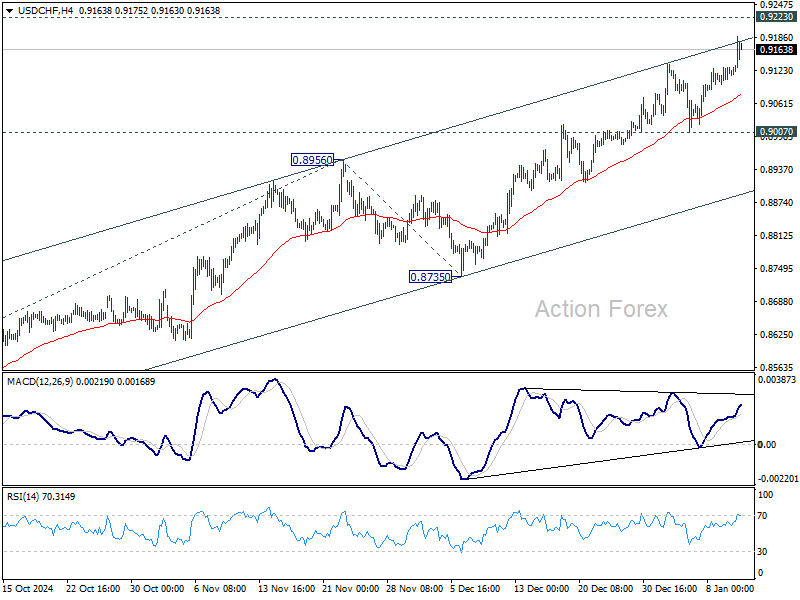
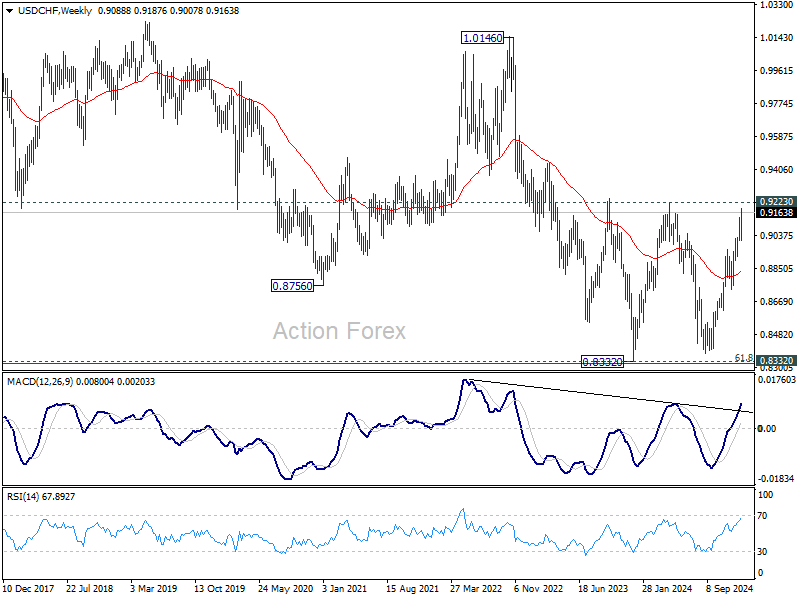
In the bigger picture, price actions from 0.8332 (2023 low) are currently seen as a medium term corrective pattern, with rise from 0.8374 as the third leg. Overall outlook will continue to stay bearish as long as 0.9223 resistance holds. Break of 0.8332 low is in favor at a later stage when the consolidation completes. However, decisive break of 0.9223 will be an important sign of bullish trend reversal.
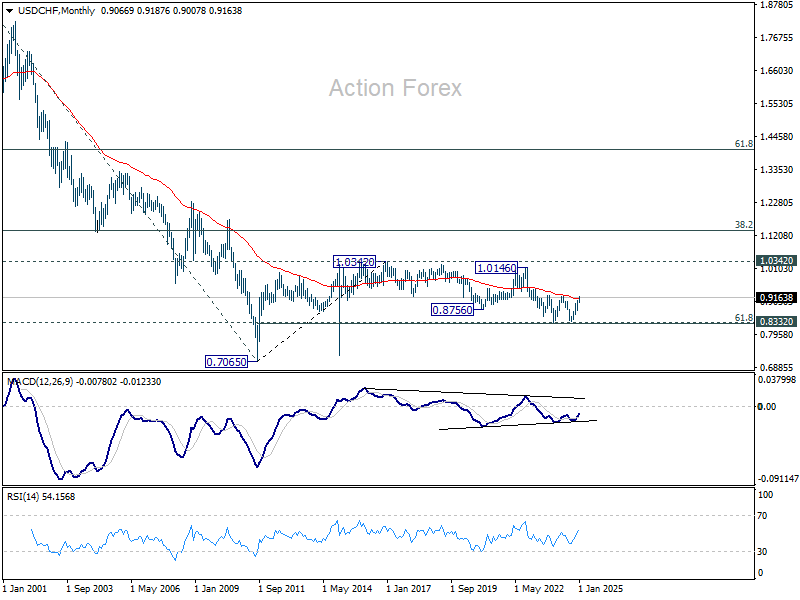
In the long term picture, price action from 0.7065 (2011 low ) are seen as a corrective pattern to the multi-decade down trend from 1.8305 (2000 high). Fall from 1.0342 (2016 high) is seen as the second leg. Sustained break of 55 M EMA (now at 0.9131) will indicate that the third leg has already started. However, rejection by 55 M EMA again, followed by break of 61.8% retracement of 0.7065 to 1.0342 at 0.8317, will pave the way back to 0.7065.
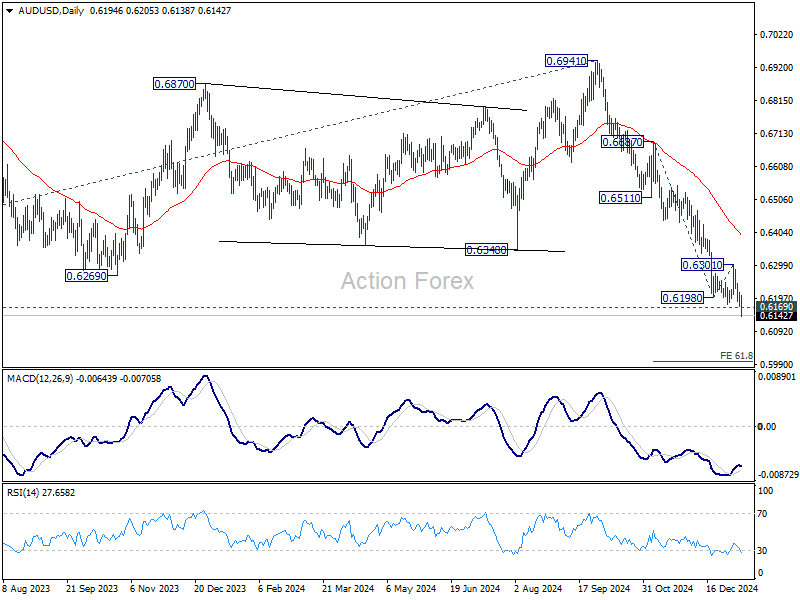
AUD/USD Weekly Report
AUD/USD's break of 0.6169 key support level last week confirms larger down trend resumption. Initial bias stays on the downside this week for 61.8% projection of 0.6687 to 0.6198 from 0.6301 at 0.5999. For now, outlook will stay bearish as long as 0.6301 resistance holds, in case of recovery.
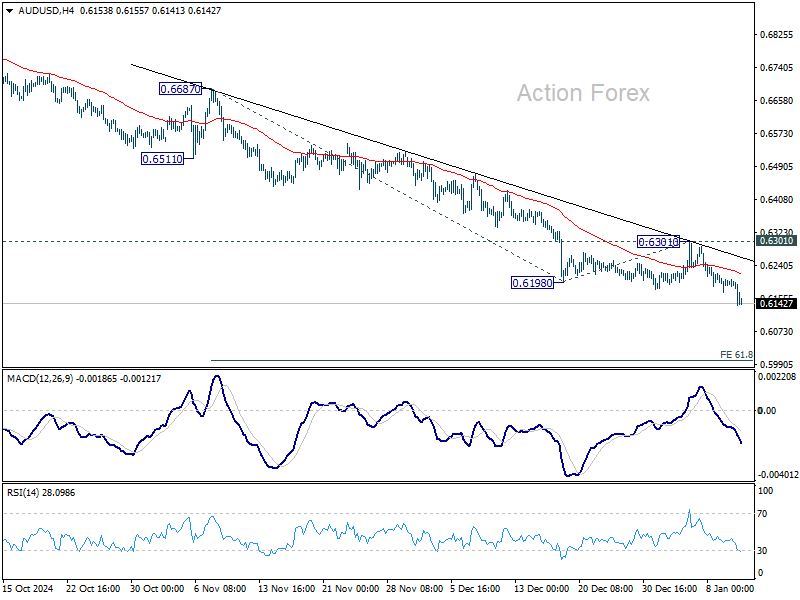
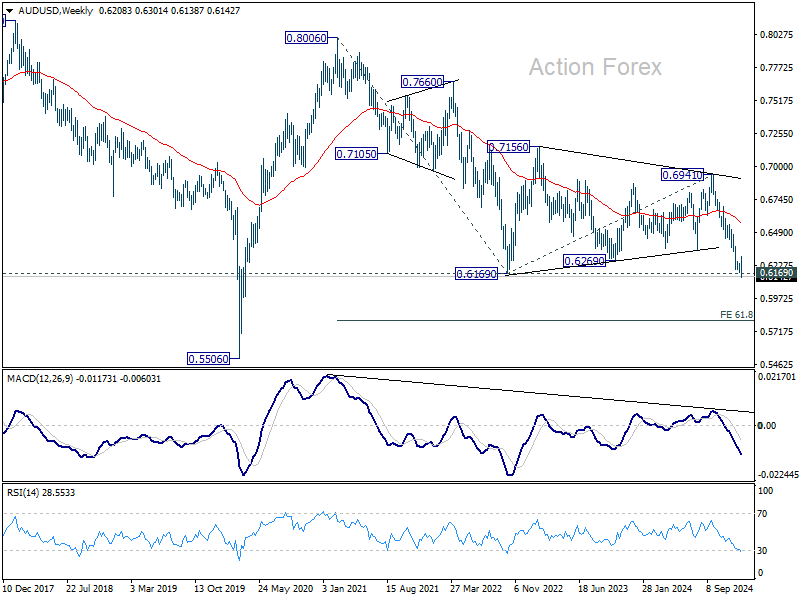
In the bigger picture, down trend from 0.8006 (2021 high) is resuming with break of 0.6169 (2022 low). Next medium term target is 61.8% projection of 0.8006 to 0.6169 from 0.6941 at 0.5806, In any case, outlook will stay bearish as long as 55 W EMA (now at 0.6587) holds.
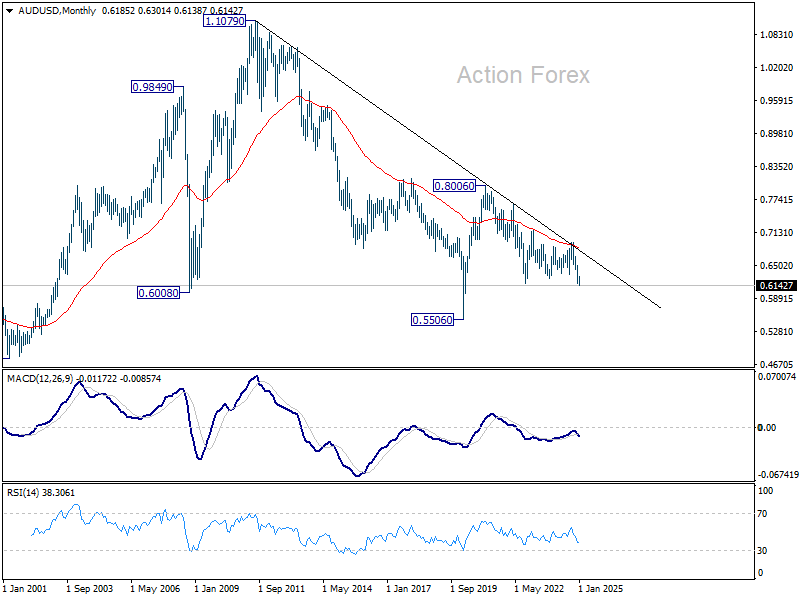
In the long term picture, prior rejection by 55 M EMA (now at 0.6846) is taken as a bearish signal. But for now, fall from 0.8006 is still seen as the second leg of the corrective pattern from 0.5506 long term bottom (2020 low). Hence, in case of deeper fall, strong support should emerge above 0.5506 to contain downside to bring reversal. However, this view is subject to adjustment if current decline accelerates further.
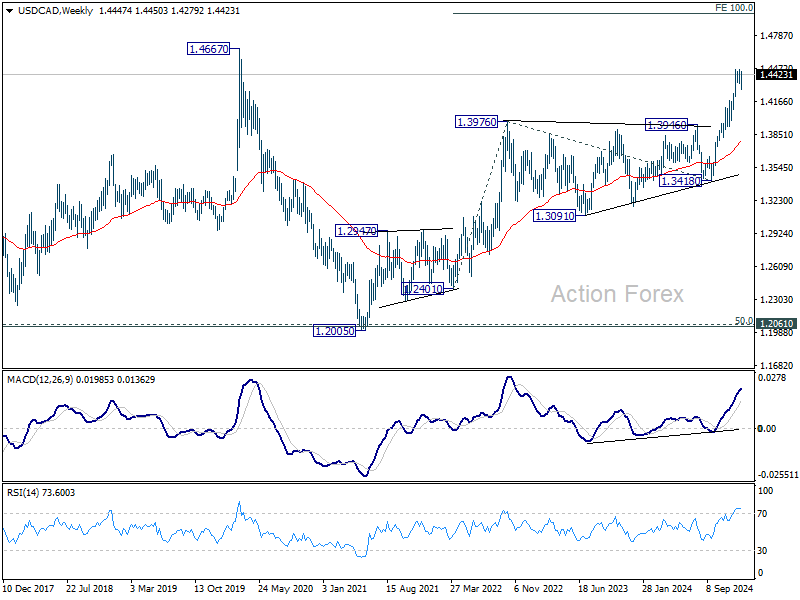
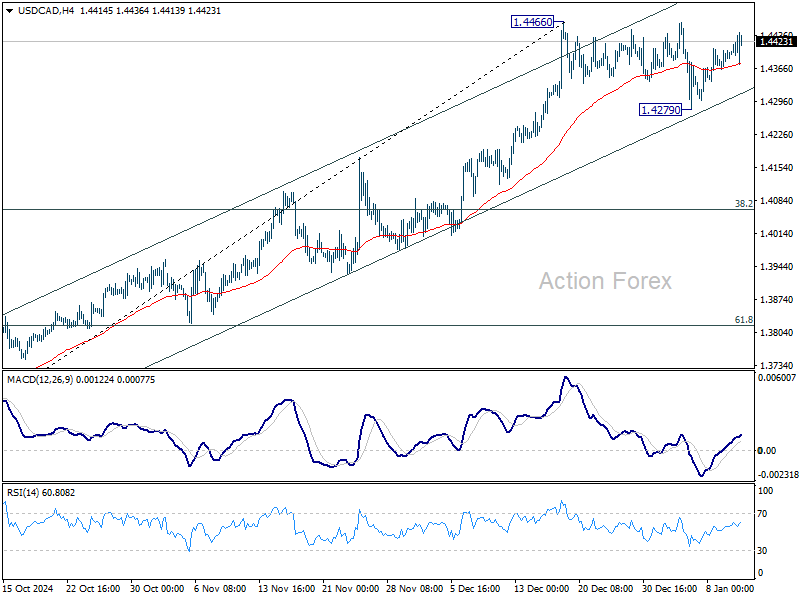
USD/CAD Weekly Outlook
USD/CAD dipped to 1.4279 last week as consolidation from 1.4466 extended, but quickly rebounded. Initial bias remains neutral this week first, and further rally is expected. Break of 1.4466 will resume larger up trend to 1.4667/89 long term resistance zone. However, break of 1.4279 will extend the corrective pattern with another falling leg.
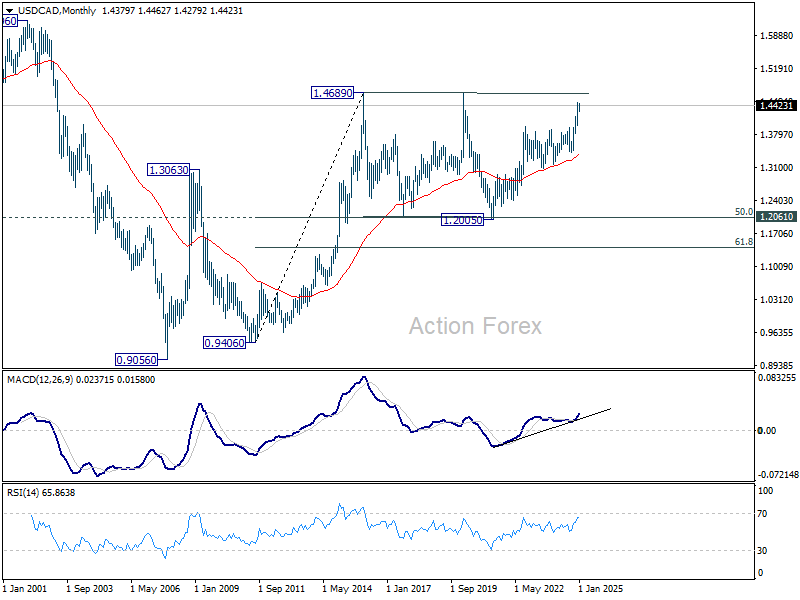
In the bigger picture, up trend from 1.2005 (2021) is in progress for retesting 1.4667/89 key resistance zone (2020/2015 highs). Medium term outlook will remain bullish as long as 1.3976 resistance turned holds (2022 high), even in case of deep pullback.
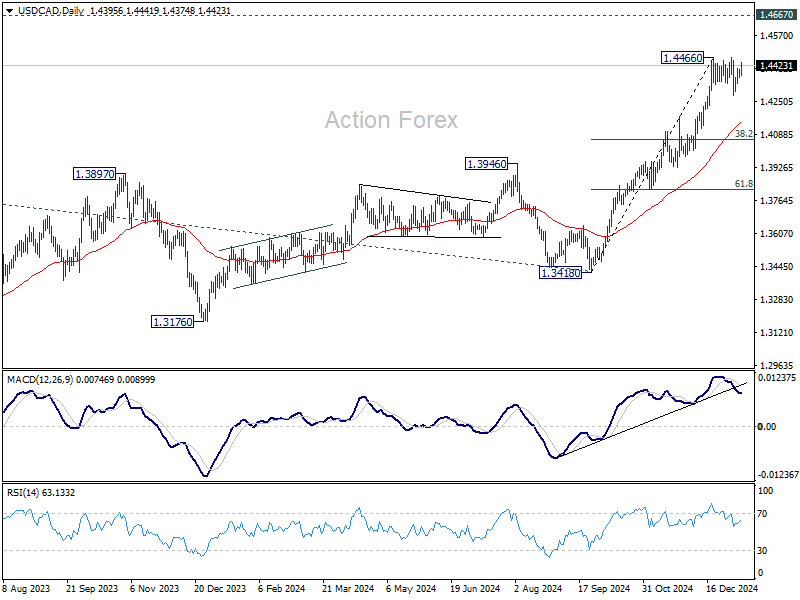
In the longer term picture, price actions from 1.4689 (2016 high) are seen as a consolidation pattern, which might have completed at 1.2005. That is, up trend from 0.9506 (2007 low) is expected to resume at a later stage. This will remain the favored case as long as 1.3418 support holds.