Sample Category Title
Sunset Market Commentary
Markets
Strong US payrolls published on Friday continued to dominate sentiment for global trading. The report confirmed Fed’s ‘guidance’ since the December meeting that it has plenty of room to assess the timing for additional easing. In this respect, the December US CPI inflation data to be published on Wednesday will be key in setting up the next big market move. A new upward surprise might cause markets to fully price out all remaining 2025 rate cuts and even cause market talk on the need for some tightening to resume. We’re not there yet, but underlying sentiment remains bearish. Core yields this morning again added a few basis points, but with hardly any important eco data scheduled for release today, investors are ‘happy’ just to digest the recent sharp repricing for now. US yields rise 1-2 bps across the curve. The German yields curve steepens slightly with yields little changed at the short end of the curve and as the 30-y adds 1.5 bps. Brent oil extending gains beyond $ 80 p/b after the US announced additional sanctions against Russian oil exports didn’t help to mitigate lingering inflation worries. Tightening of financial conditions this time also outweighs recent market optimism on ongoing strong US growth. After declining, 1.5% already on Friday, US equities again open in red (S&P 500 -0.9%, Nasdaq -1.6%).
Higher US real yields and a risk-off sentiment are supporting the dollar, but gains are not unequivocal across all USD cross rates. The DXY index near 110 is trading at the strongest level since November 2022. EUR/USD intraday briefly dropped below the 1.0201 level (62% retr. 2022/2023 rebound). The pair tries to avoid a sustained break but momentum suggests a revisit of parity (or below) is ever more likely. The jury is still out, but US equities also being captured in the broader risk-off move apparently causes investors to reassess the yen’s safe haven virtues. USD/JPY is easing from the 158 area to trade near 157.2. At the other side of the FX spectrum, sterling (and Gilts) continue to fight an uphill battle. UK Prime Minster Starmer explicitly supporting Fin Min Reeves’ policy and committing to rules of financial orthodoxy doesn’t help to address investor concerns on fiscal sustainability and on inflation staying too high for too long. ST UK yields are rising up to 4.5 bps (2-y), but this higher risk premium understandably still doesn’t help sterling. Cable tested the 1.21 area. EUR/GBP regained the 0.84 barrier (0.841). UK CPI will also be published on Wednesday. An new upside surprise almost certainly will cause more damage too overall UK markets.
News & Views
Czech inflation fell 0.3% M/M in December whereas consensus expected a 0.1% monthly gain. Lower prices in “food and non-alcoholic beverages” and in “alcoholic beverages and tobacco” were the main culprit. Prices of goods in total decreased by 0.5% (to be up 1.7% Y/Y) while prices of services remained at the level of November (5% Y/Y). In Y/Y-terms, headline CPI rose from 2.8% to 3%, the fastest pace since end 2023 but less than the feared uptick to 3.3%. Average 2024 inflation as a whole was 2.4%. The Czech National Bank commented on the inflation figures which were below the central bank’s autumn forecast (+3.3% Y/Y). Food price inflation was weaker in particular (3.3% Y/Y vs 4.8% Y/Y), but core inflation was also somewhat lower than forecasted. (2.3% instead of 2.4%). Services inflation nevertheless remains a worry because of elevated wage growth. The Czech krone weakened in the wake of the inflation report (EUR/CZK 25.20 from 25.05) as it gently reopens the door to a February policy rate cut after the CNB paused its cutting cycle in December. That feeling was strengthened by comments from influential CNB vicegovernor Zamrazilova who welcomed the pleasant inflation surprise and added that there is a rising chance that the CNB may resume its policy easing early in 2025. Czech swap rates lose up to 6 bps at the front end of the curve. Key things to watch apart from CNB comments are Q4 GDP (Jan 31st) and the January inflation report (Feb 6).
Indian inflation declined 0.56% M/M in December with the Y/Y-figure slowing down from 5.48% to 5.22%. The decline was largely driven by lower price gains for vegetables, pulses and cereals. Core inflation eased slightly from 4% Y/Y to 3.9%. Today’s data strengthen the view that new RBI governor Sanjay Malhotra at its first meeting in charge will implement a policy rate cut to start supporting slowing growth. In public comments, he has revealed himself as being more dovish than outgoing chair Das. The Indian rupee trades at an all-time low against the dollar today (USD/INR 86.50) but today’s significant sell-off is more because of the global rising interest rate environment and because of the two-day surge in oil prices (Indian being energy-dependent) than due to the inflation data.
USD/JPY Mid-Day Outlook
Daily Pivots: (S1) 156.98; (P) 157.94; (R1) 158.64; More...
No change in USD/JPY's outlook and intraday bias stays neutral at this point. Further rally is in favor as long as 156.0 support holds. ON the upside, decisive break of 61.8% projection of 139.57 to 156.74 from 148.64 at 159.25 will extend the rally from 139.57 to retest 161.94 high. However, considering bearish divergence condition in 4H MACD, firm break of 156.01 support will indicate short term topping. Intraday bias will then be back on the downside for 55 D EMA (now at 154.13) instead.
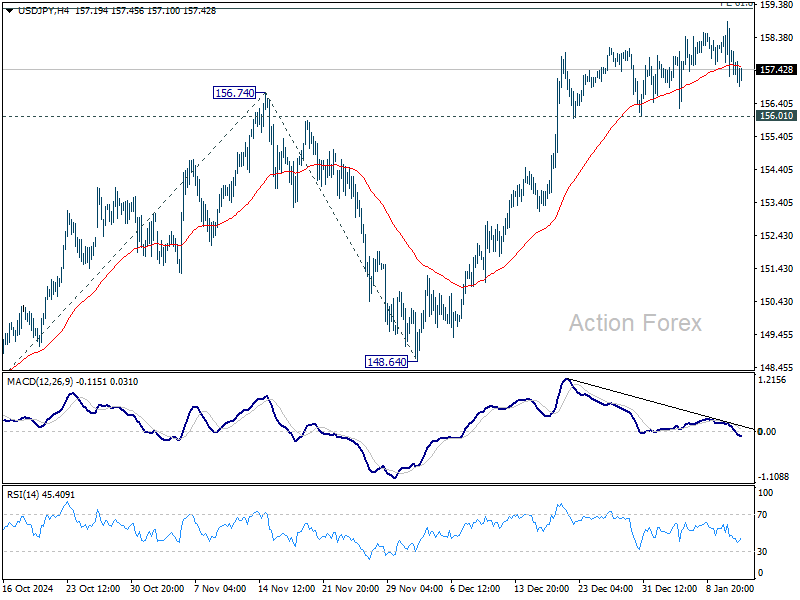
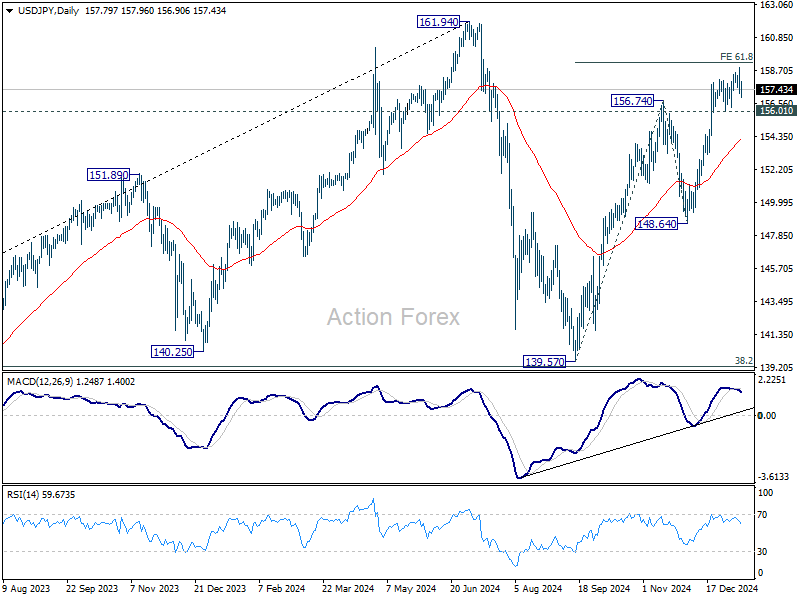
In the bigger picture, price actions from 161.94 are seen as a corrective pattern to rise from 102.58 (2021 low). The range of medium term consolidation should be set between 38.2% retracement of 102.58 to 161.94 at 139.26 and 161.94. Nevertheless, sustained break of 139.26 would open up deeper medium term decline to 61.8% retracement at 125.25.
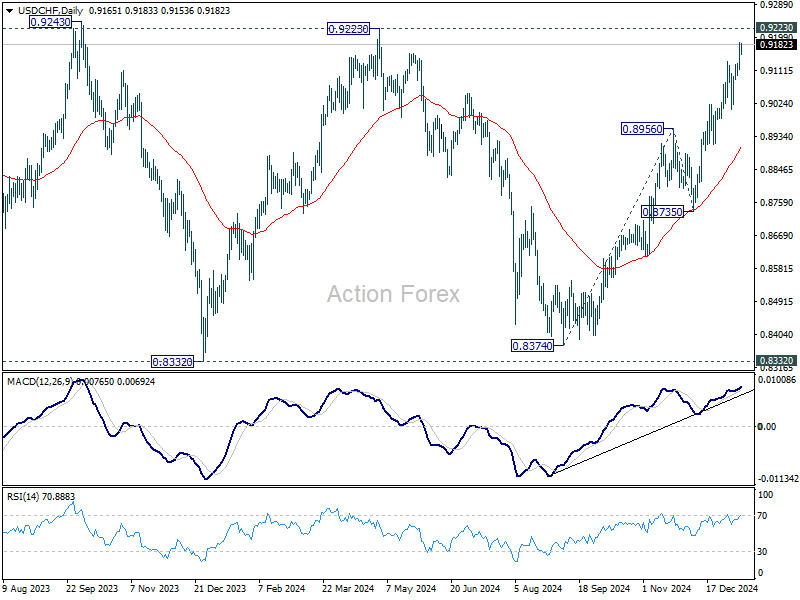
USD/CHF Mid-Day Outlook
Daily Pivots: (S1) 0.9120; (P) 0.9154; (R1) 0.9200; More…
USD/CHF's rally from 0.8374 is still in progress for 0.9223 key resistance. Decisive break there will carry larger bullish implications. For now, near term outlook will stay bullish as long as 0.9007 support holds, in case of retreat.
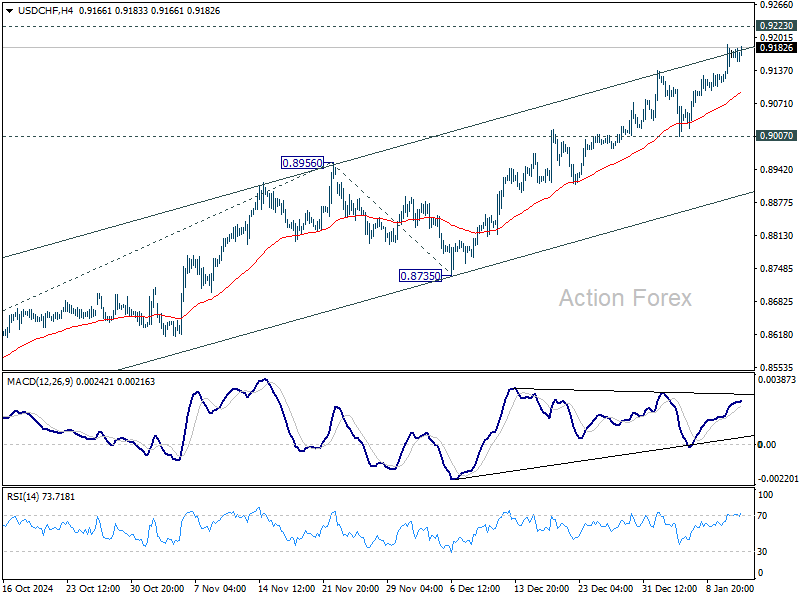
In the bigger picture, price actions from 0.8332 (2023 low) are currently seen as a medium term corrective pattern, with rise from 0.8374 as the third leg. Overall outlook will continue to stay bearish as long as 0.9223 resistance holds. Break of 0.8332 low is in favor at a later stage when the consolidation completes. However, decisive break of 0.9223 will be an important sign of bullish trend reversal.
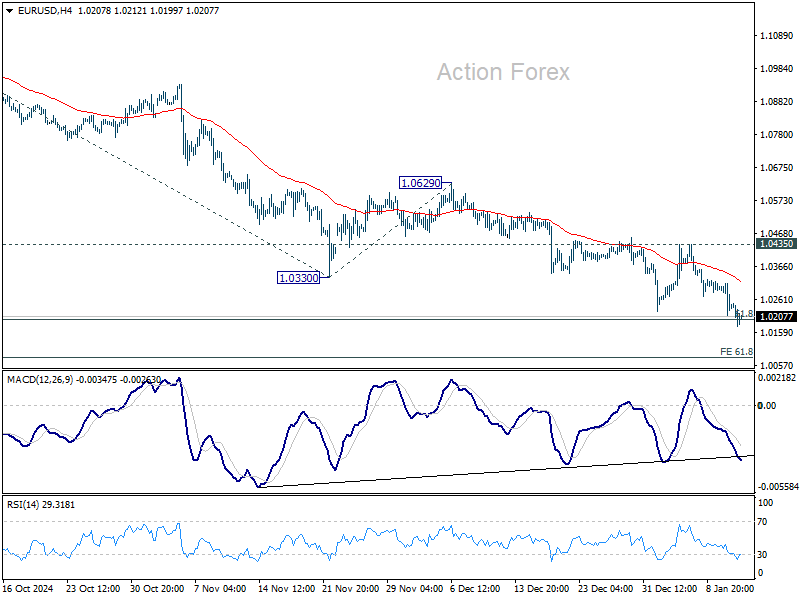
EUR/USD Mid-Day Outlook
Daily Pivots: (S1) 1.0201; (P) 1.0257; (R1) 1.0301; More...
Intraday bias in EUR/USD remains on the downside for the moment. Current fall from 1.1213 should target 61.8% projection of 1.1213 to 1.0330 from 1.0629 at 1.0083. For now, outlook will stay bearish as long as 1.0435 resistance holds, in case of recovery.
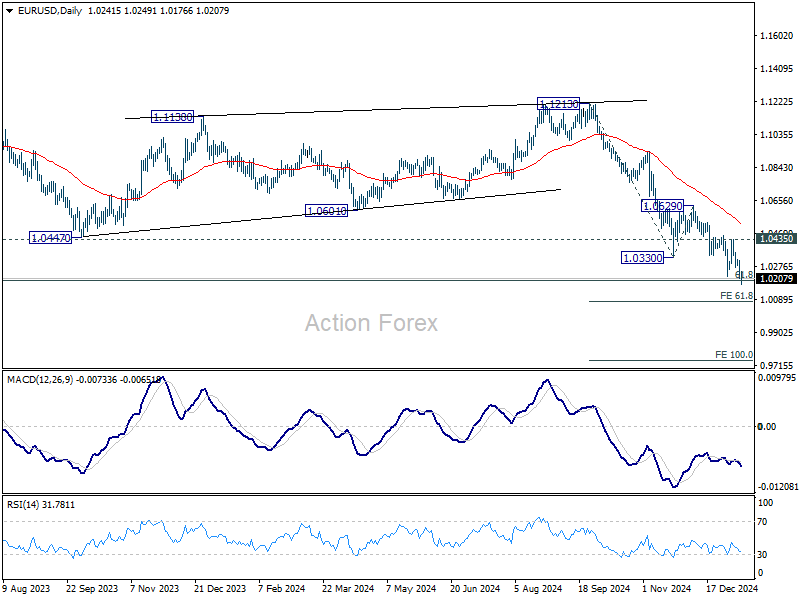
In the bigger picture, fall from 1.1274 (2023 high) should either be the second leg of the corrective pattern from 0.9534 (2022 low), or another down leg of the long term down trend. In both cases, sustained break of 61.8 retracement of 0.9534 to 1.1274 at 1.0199 will pave the way back to 0.9534. For now, outlook will stay bearish as long as 1.0629 resistance holds, even in case of strong rebound.
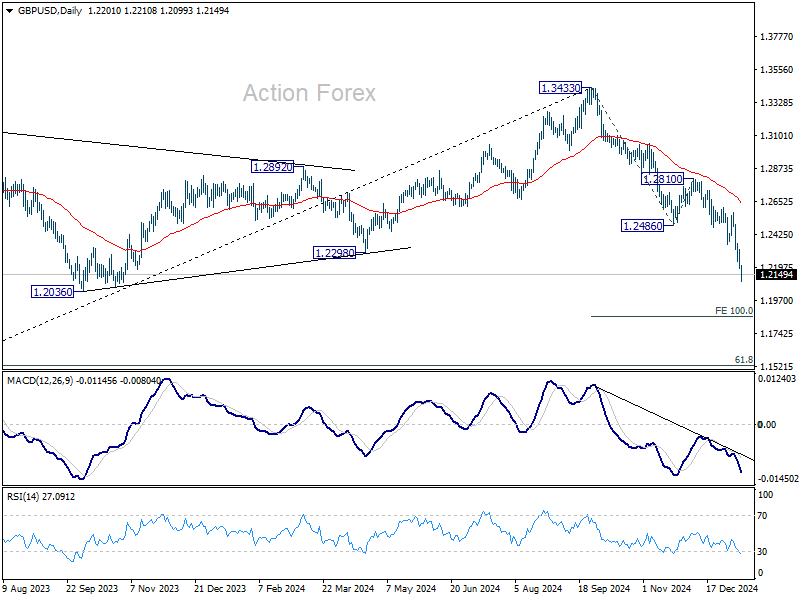
GBP/USD Mid-Day Outlook
Daily Pivots: (S1) 1.2160; (P) 1.2241; (R1) 1.2291; More...
Intraday bias in GBP/USD remains on the downside for the moment. Current decline from 1.3433 is in progress for 100% projection of 1.3433 to 1.2486 from 1.2810 at 1.1863. On the upside, break of 1.2321 minor resistance will turn intraday bias neutral first. But risk will stay on the downside as long as 1.2486 support turned resistance holds, in case of recovery.
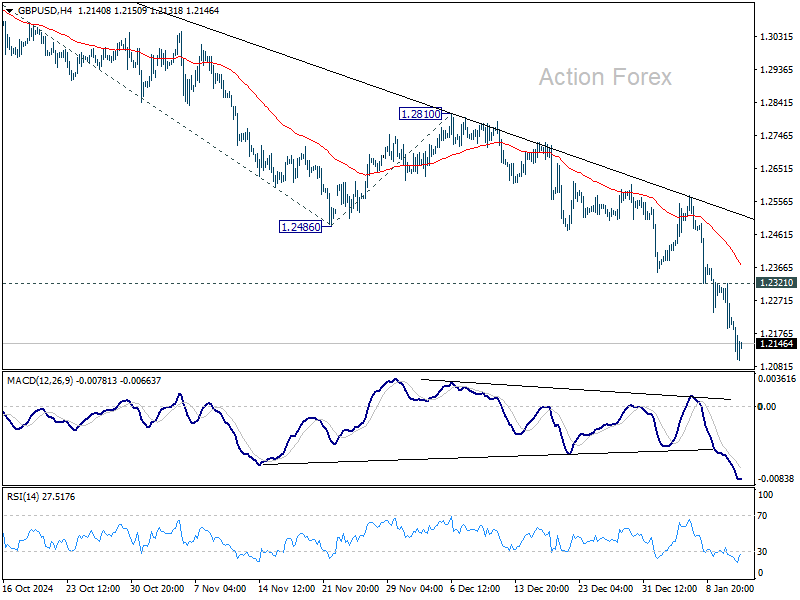
In the bigger picture, rise from 1.0351 (2022 low) should have already completed at 1.3433, and the trend has reversed. Further fall is now expected as long as 1.2810 resistance holds. Deeper decline should be seen to 61.8% retracement of 1.0351 to 1.3433 at 1.1528, even as a corrective move.
Sterling Slumps Further as UK Bond Yields Hit Multi-Decade Highs
Sterling's selloff continues today as UK government bond yields surged to new highs, underlining deep market concerns over the nation’s fiscal outlook. 10-year Gilt yield breached 4.8%, a level not seen in 17 years, while 30-year yield climbed past 5.4%, marking its highest point in 27 years.
At the core of this crisis are doubts about the government’s ability to meet its fiscal targets without resorting to higher taxes or additional spending cuts. Prime Minister Keir Starmer reaffirmed his commitment to the government’s fiscal rules, but his sidestepping of questions about austerity measures did little to calm investor nerves.
Meanwhile, Chancellor Rachel Reeves is facing scrutiny for her economic strategies—although Starmer offered unwavering support, calling her performance “fantastic.” Traders appear unconvinced, with concerns that rising debt-servicing costs could strain public finances and weigh on the Pound for some time.
Sterling will undergo crucial tests this week with the release of CPI data on Wednesday, followed by GDP figures on Thursday. While traders keep an eye on inflationary trends, a disappointing GDP print could intensify the bearish pressure on the currency. Many analysts worry that further signs of subdued economic growth, especially after the Autumn budget, could deepen the negative spiral surrounding the Pound’s outlook.
Euro, too, faced pressure today as ECB officials reaffirmed their commitment to a gradual path of monetary easing. With Fed now expected to deliver only one—or potentially zero—rate cuts in 2025, the widening rate differential is undercutting Euro. However, the single currency found some support against Sterling and Swiss Franc, helped by ECB Chief Economist Philip Lane’s call for a “middle path” on rate decisions, that's " neither too aggressive nor too cautious."
Overall in the markets, Yen emerged as the strongest performer of the day, buoyed by risk aversion, despite rising yields in the US and Europe. Canadian Dollar and Aussie also posted gains. Meanwhile, Dollar and Kiwi maintained middle-ground positions, leaving the Swiss Franc, Euro, and Sterling as the weakest currencies, with the latter suffering the steepest declines due to heightened fiscal and economic concerns.
Technically, EUR/CHF recovered ahead of 0.9329 support today, as sideway trading from 0.9440 continues. Further rise remains in favor through 0.9440 in the near term. Though strong resistance is expected from 38.2% retracement of 0.9928 to 0.9204 at 0.9481 to limit upside. Firm break of 0.9329, however, will indicate that the corrective rebound from 0.9204 has already completed.

In Europe, at the time of writing, FTSE is down -0.66%. DAX is down -0.64%. CAC is down -0.60%. UK 10-year yield is up 0.0039 at 4.847. Germany 10-year yield is up 0.0089 at 2.582. Earlier in Asia, Japan was on holiday. Hong Kong HSI fell -1.00%. China Shanghai SSE fell -0.25%. Singapore Strait Times fell -0.26%.
ECB’s Lane stresses the need for "middle path" on interest rates
ECB Chief Economist Philip Lane, in an interview with Der Standard, highlighted that a "middle path" is essential to achieving the inflation target without stifling economic growth or allowing inflationary pressures to persist.
Lane warned that if interest rates fall too quickly, it could undermine efforts to bring services inflation under control. On the other hand, keeping rates too high for too long risks that inflation could "materially fall below target".
“We think inflation pressure will continue to ease this year,” Lane stated, while adding that wage increases in 2025 are expected to moderate significantly, which could contribute to a softer inflationary environment.
While acknowledging that the overall direction of monetary policy is clear, Lane underlined the complexities of striking the right balance of "being neither too aggressive nor too cautious."
ECB's Vujcic: Gradual rate cuts justified amid elevated uncertainty
Croatian ECB Governing Council member Boris Vujcic emphasized a cautious and deliberate approach to monetary policy adjustments during comments to Econostream Media.
Vujcic stated that any acceleration in the pace of rate cuts would require a "significant departure" from the current economic projections, which he noted were being met by ongoing developments.
"In circumstances where uncertainties are still elevated," Vujcic explained, "it’s better to move gradually, and this is what we’re doing."
Vujcic also highlighted the ECB's independence from other central banks, including the Fed. "We are not dependent on the Fed or any other central bank," he remarked.
His comments lent support to current market expectations for ECB’s policy path, which he described as "justified" in the near term.
ECB’s Rehn: Restrictive monetary policy to end latest by mid-summer
Finnish ECB Governing Council member Olli Rehn reaffirmed the central bank's commitment to easing monetary policy as disinflation remains on track and the region faces a weakening growth outlook. Speaking with Bloomberg TV, Rehn stated that it "makes sense to continue rate cuts."
Rehn projected that ECB is likely to exit restrictive monetary territory "sometime in the spring-winter," a timeline he clarified could range from January to June in Finland's seasonal context.
He added, "I would say at the latest by midsummer, we should have left restrictive territory."
Rehn also emphasized ECB's independence in policy decisions, distancing it from the Fed's approach.
"The ECB is not the 13th federal district of the Federal Reserve System," he noted, reinforcing that the bank's decisions are guided solely by its mandate to maintain price stability within the Eurozone.
China's monthly trade surplus soars to USD 104.8B as exports jumps 10.7% yoy
China's trade data for December delivered a solid performance, reflecting resilience in exports and a surprising recovery in imports.
Exports surged 10.7% yoy, significantly outpacing the 7.3% yoy expected growth and accelerating from November's 6.7%.
Shipments to major markets rose sharply, with exports to the US jumping 18.9% yoy, ASEAN by 15.6% yoy, and the EU by 8.7% yoy. Some analysts highlighted that front-loading ahead of the Lunar New Year and trade policy shifts under Donald Trump’s incoming administration likely bolstered the month's figures.
Imports grew 1.0% yoy, defying expectations of a -1.5% yoy decline and marking a rebound after consecutive contractions of -3.9% yoy in November and -2.3% yoy in October. This recovery was driven in part by increased purchases of commodities like copper and iron ore, with importers potentially capitalizing on lower prices.
Regionally, imports from the US rose by 2.6% yoy, while ASEAN imports grew 5.4% yoy. However, imports from the EU fell by -4.9% yoy.
Trade surplus widened from USD 97.4B in November to USD 104.8B in December, surpassing expectations of USD 100B.
Looking ahead, markets will closely monitor China’s upcoming GDP figures, due for release on Friday. Expectations are for fourth-quarter growth to clock in at 5.0% yoy.
GBP/USD Mid-Day Outlook
Daily Pivots: (S1) 1.2160; (P) 1.2241; (R1) 1.2291; More...
Intraday bias in GBP/USD remains on the downside for the moment. Current decline from 1.3433 is in progress for 100% projection of 1.3433 to 1.2486 from 1.2810 at 1.1863. On the upside, break of 1.2321 minor resistance will turn intraday bias neutral first. But risk will stay on the downside as long as 1.2486 support turned resistance holds, in case of recovery.
In the bigger picture, rise from 1.0351 (2022 low) should have already completed at 1.3433, and the trend has reversed. Further fall is now expected as long as 1.2810 resistance holds. Deeper decline should be seen to 61.8% retracement of 1.0351 to 1.3433 at 1.1528, even as a corrective move.
AUD/USD: Aussie Bears Have Taken a Foothold Reinforced by Longer-Term US Treasury Yield Premiums
- A higher 10-year yield premium of the US Treasuries over Australian sovereign bonds has reduced the attractiveness of the Aussie dollar as a “high-yielding” currency.
- Deflationary risk in China coupled with potential higher trade tariffs policy from the US has reinforced recent languish movements in the Iron Ore CFR China futures.
- Major bearish breakdown in AUD/USD with next medium-term support at 0.6030/5990.
The price movements of the AUD/USD have continued their bearish momentum and staged a major breakdown below 0.6360. In the last four weeks, it has tumbled by 3.50%, and on Monday, 13 January, it had printed a fresh 52-week low of 0.6131 at the time of the writing.
Bond vigilantes are back with a vengeance in the US Treasury market
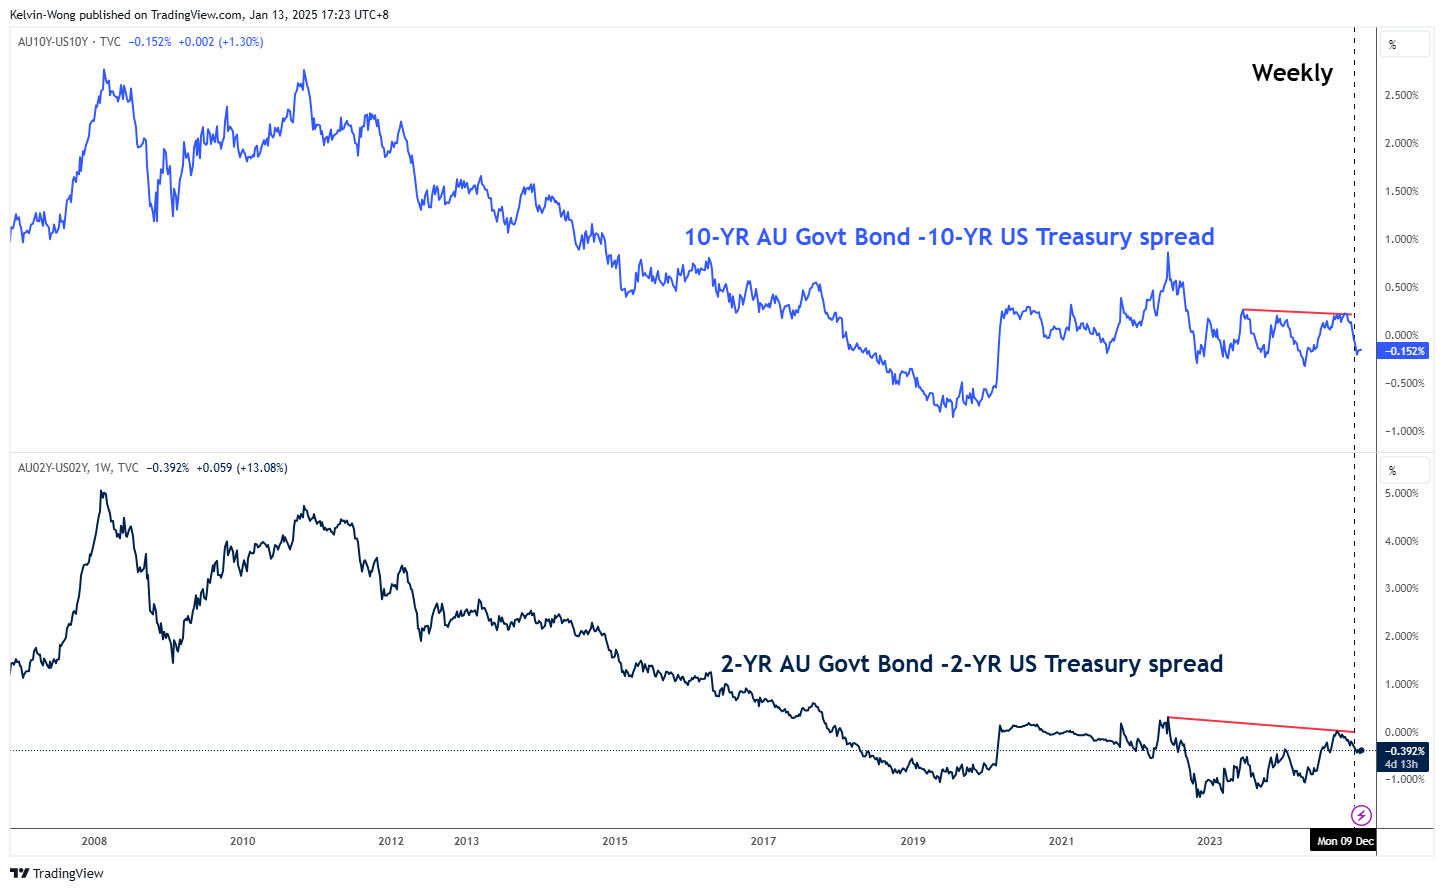
Fig 1: Major trends of 2-year & 10-year yield spreads of AU sovereign bonds/US Treasuries as of 13 Jan 2025 (Source: TradingView, click to enlarge chart)
The incoming Trump administration’s proposed policies with steep corporate tax cuts and higher trade tariffs targeted toward US key trading partners stoked fears of further widening the US budget deficit and resurgence of inflationary pressures.
The US Treasury market in the long end has responded and reacted to such fears. The US 10-year Treasury yield has continued its relentless climb northwards after a bullish breakout on 18 December last year from almost a year of consolidation from its October 2023 swing high area of 5%.
Also, since the start of the new year in 2025, the rise in the 10-year US Treasury yield has increased at a faster pace than its lower-end two-year Treasury yield; an increase of 22 basis points (bps) over 15 bps respectively.
Hence, the 10-year yield spread between the Australian government sovereign bond and the US Treasury note has continued to narrow since 13 December from -0.05% to -0.15% at this time of the writing, potentially triggering further downside pressure on the AUD/USD currency rate (see Fig 1).
Lacklustre iron ore prices have exerted downside pressure on AUD/USD
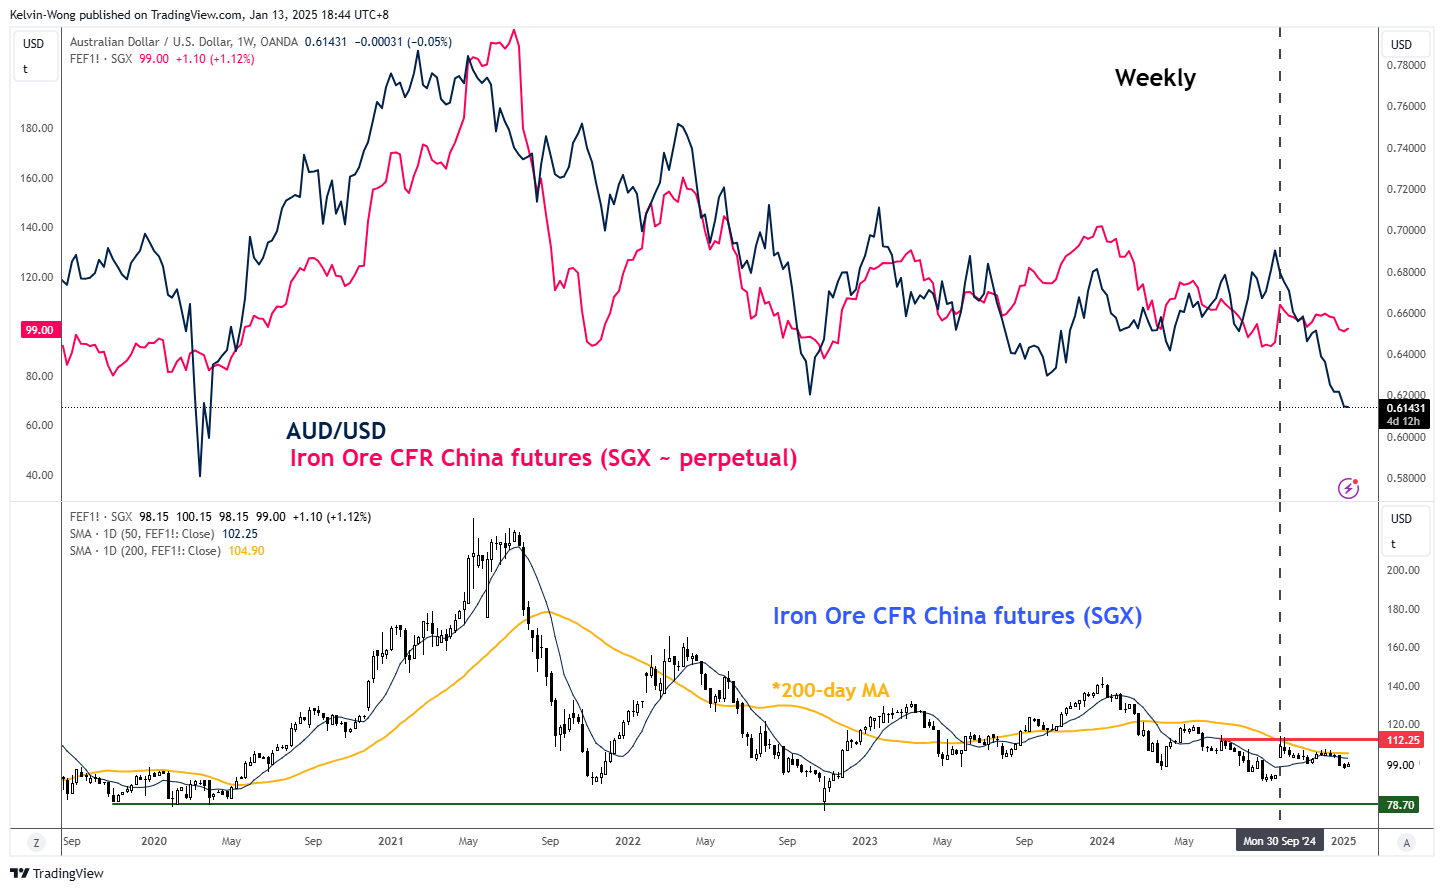
Fig 2: AUD/USD & Iron Ore futures correlation movement as of 13 Jan 2025 (Source: TradingView, click to enlarge chart)
Given that iron ore is one of Australia’s key resource exports and a significant portion of it goes to China; if China’s economic growth remains feeble, there will be likely less demand for iron ore, in turn, put downside pressure on Australia’s trade balance that may trigger a negative feedback loop into the AUD/USD.
Since late September 2024, the movement of the Iron Ore CFR China futures contract listed on the Singapore Exchange has resumed its positive correlation with the AUD/USD.
Given that China’s deflationary risk spiral narrative is back on the radar screen again coupled with potential higher trade tariffs from the US that may put a drag on the export growth prospects of China, these double whammy factors have caused the Iron Ore CFR China futures contract (SGX) to languish below its 200-day moving average (see Fig 2).
These negative price action observations on the Iron Ore CFR China futures contract may have negative knock-on effects on the AUD/USD.
Major bearish breakdown in AUD/USD below 0.6360
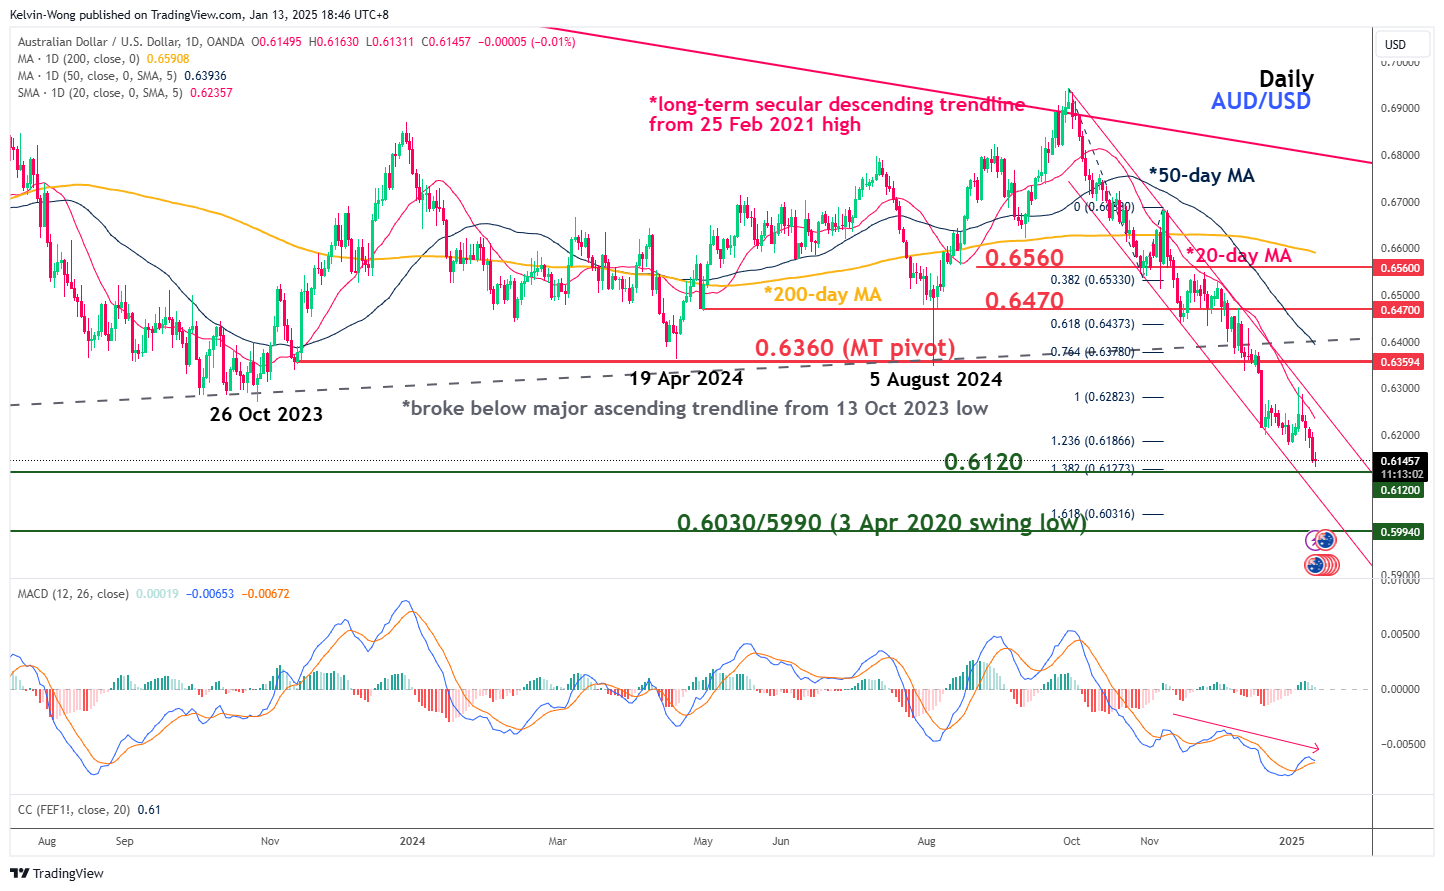
Fig 3: AUD/USD medium-term trend as of 13 Jan 2025 (Source: TradingView, click to enlarge chart)
In the lens of technical analysis, the bearish breakdown of their former 0.6360 support (also the former ascending trendline from 13 October 2023) on 17 December 2024 is considered a major price movement development where the AUD/USD has consolidated for almost a year before 17 December which suggests the start of a potential medium-term (multi-week) to major (multi-month) downtrend phases.
These bearish downtrend phases are also supported by the current negative reading seen in the daily MACD trend indicator that has steadily inched downwards below its centreline since 15 October 2024.
0.6360 key medium-term pivotal support and a break below 0.6120 exposes the next medium-term support at 0.6030/0.5990 on the AUD/USD (see Fig 3).
On the flip side, a clearance above 0.6360 Invalidates the bearish scenario for a potential mean reversion rebound scenario to unfold for the next medium-term resistances to come in at 0.6470 and 0.6560.
Crypto Market Struggles: Testing the Lower Bound Again
Market picture
The start of the new year has not been easy for the crypto market. Losing over 2% in 24 hours to $3.22 trillion, the market was back at the bottom of the consolidation range since the end of November. The promising start to the year failed to materialise. It is with some trepidation that we now watch the eighth or so attempt to break below $3.20 trillion. Adding to the unease is the fact that last week’s upside momentum failed to develop, only attracting sellers.
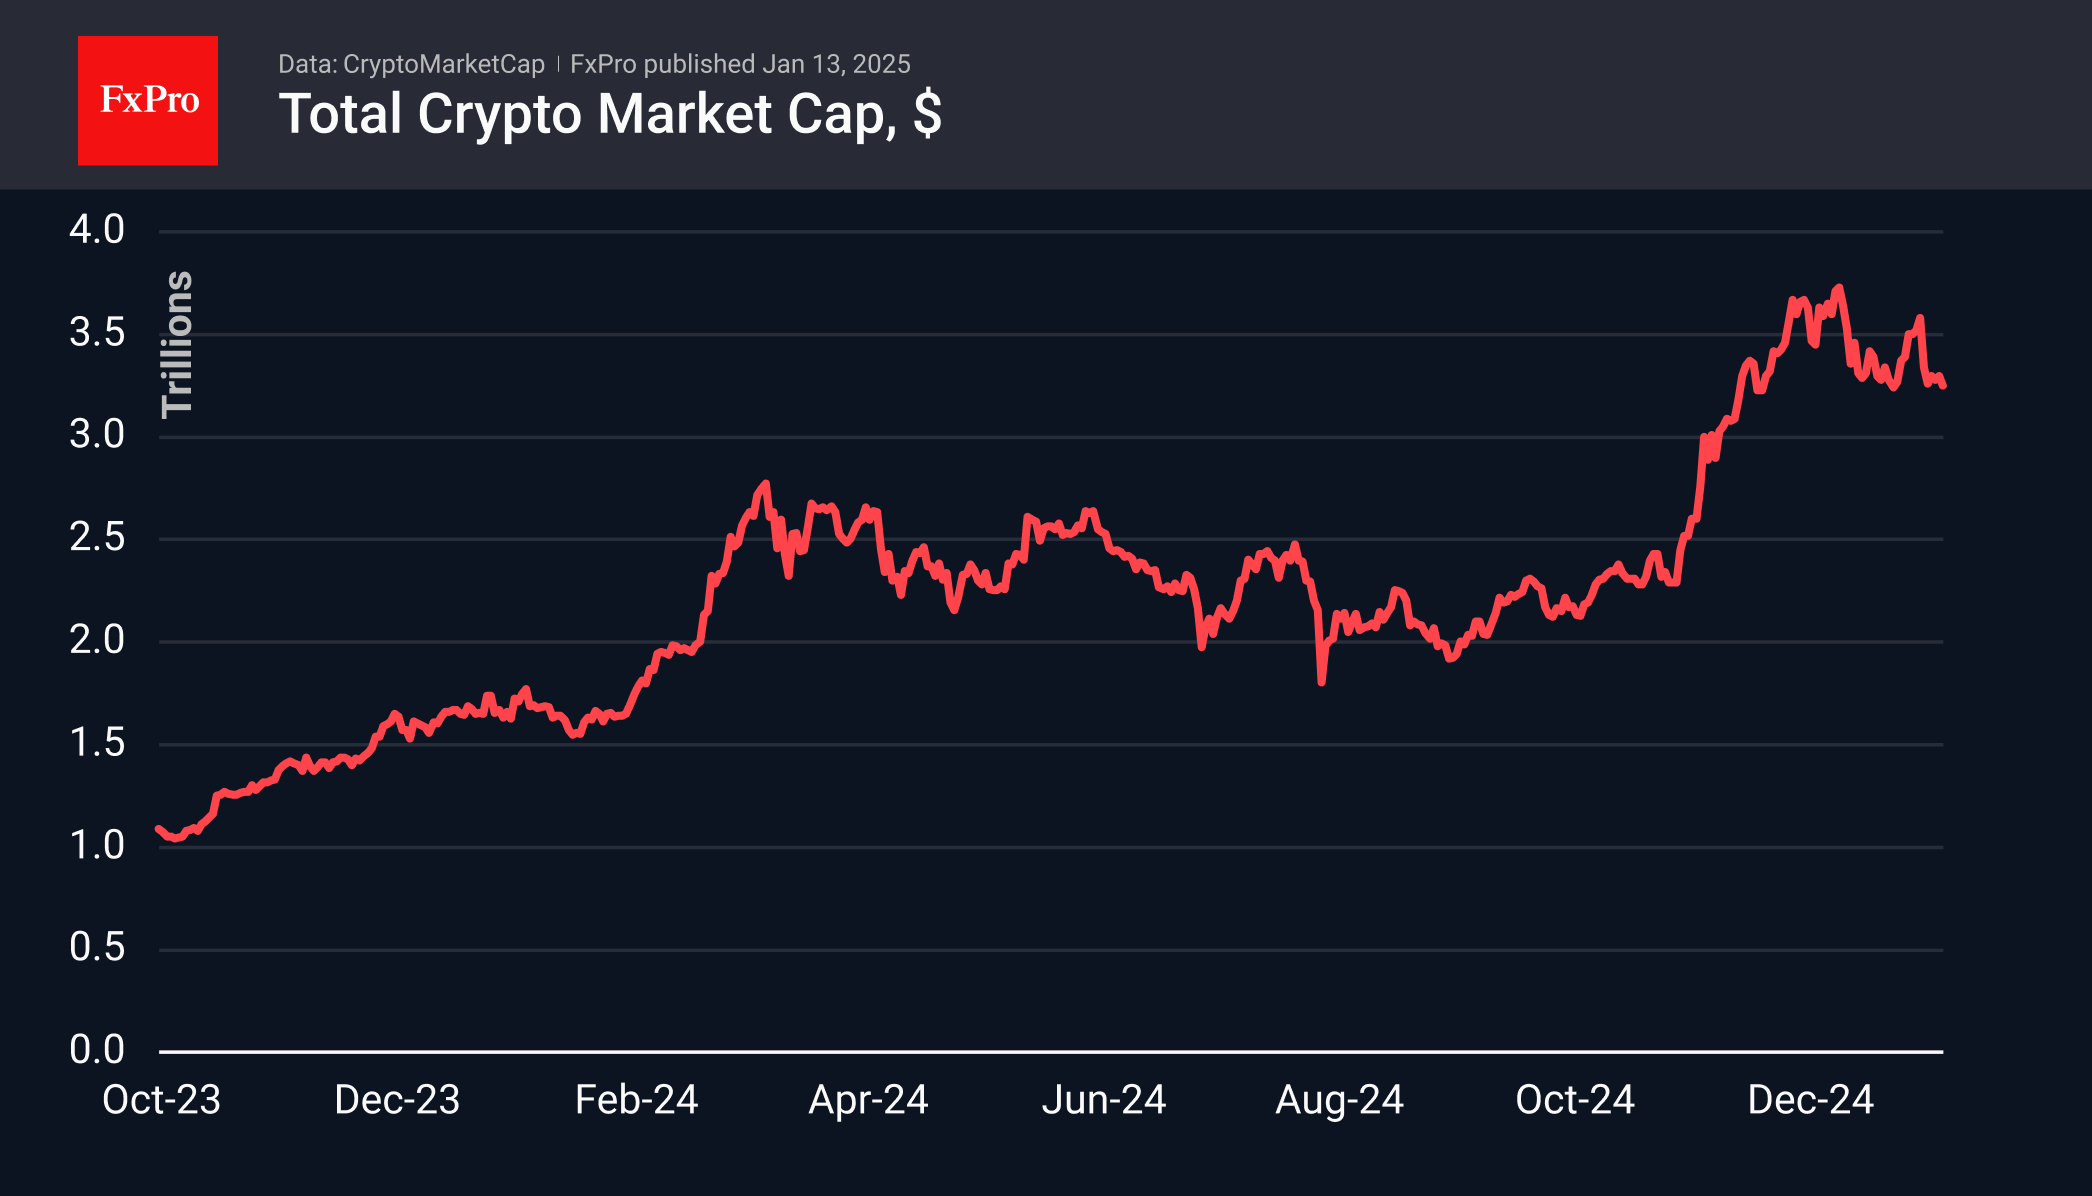
A similar return to the lower end of the trading range was seen in Bitcoin, which fell back below $93K on Monday morning. Technically, this is the 61.8% pullback level from the rally since early November. In the past, we have seen a solid bounce. However, this may not be the case this time around due to the decline in risk appetite in global financial markets. The next target for the bears looks to be the $88K area. And in a negative scenario, bitcoin will face a quick pullback to $74K.

News Background
According to SoSoValue, BTC ETFs saw net inflows of $307.2 million for the week, up from $245 million the week before, bringing total inflows to $36.22 billion.
The spot Ethereum ETF saw net outflows of $185.9 million for the week, bringing the total inflows since the launch of these products in July to $2.45 billion.
Glassnode noted that open interest in bitcoin futures is showing ‘downward speculative momentum’. This indicates that traders are closing positions in response to uncertain market conditions.
Glassnode noted that long-term Bitcoin holders continue to sell coins but at a slower pace. The share of supply controlled by ‘new investors’ has also increased.
Fidelity said the trend of declining transaction revenue for bitcoin miners may be long-term but does not pose risks to blockchain security. The main driver of the decline in network fees was the launch of US spot bitcoin ETFs in January.
CleanSpark became the fourth miner with bitcoin reserves above 10,000 BTC. Previously, competitors MARA Holdings, Riot Platforms, and Hut 8 Mining had all breached the threshold.
The Coinbase exchange has warned users that it has received a subpoena from the CFTC for customer information. The request relates to an investigation into the Polymarket betting platform, which opened at the end of 2021.
This is the 16th anniversary of the first Bitcoin transaction. On 12 January 2009, the creator of the first cryptocurrency, using the pseudonym Satoshi Nakamoto, sent developer Hal Finney 10 BTC as a test.
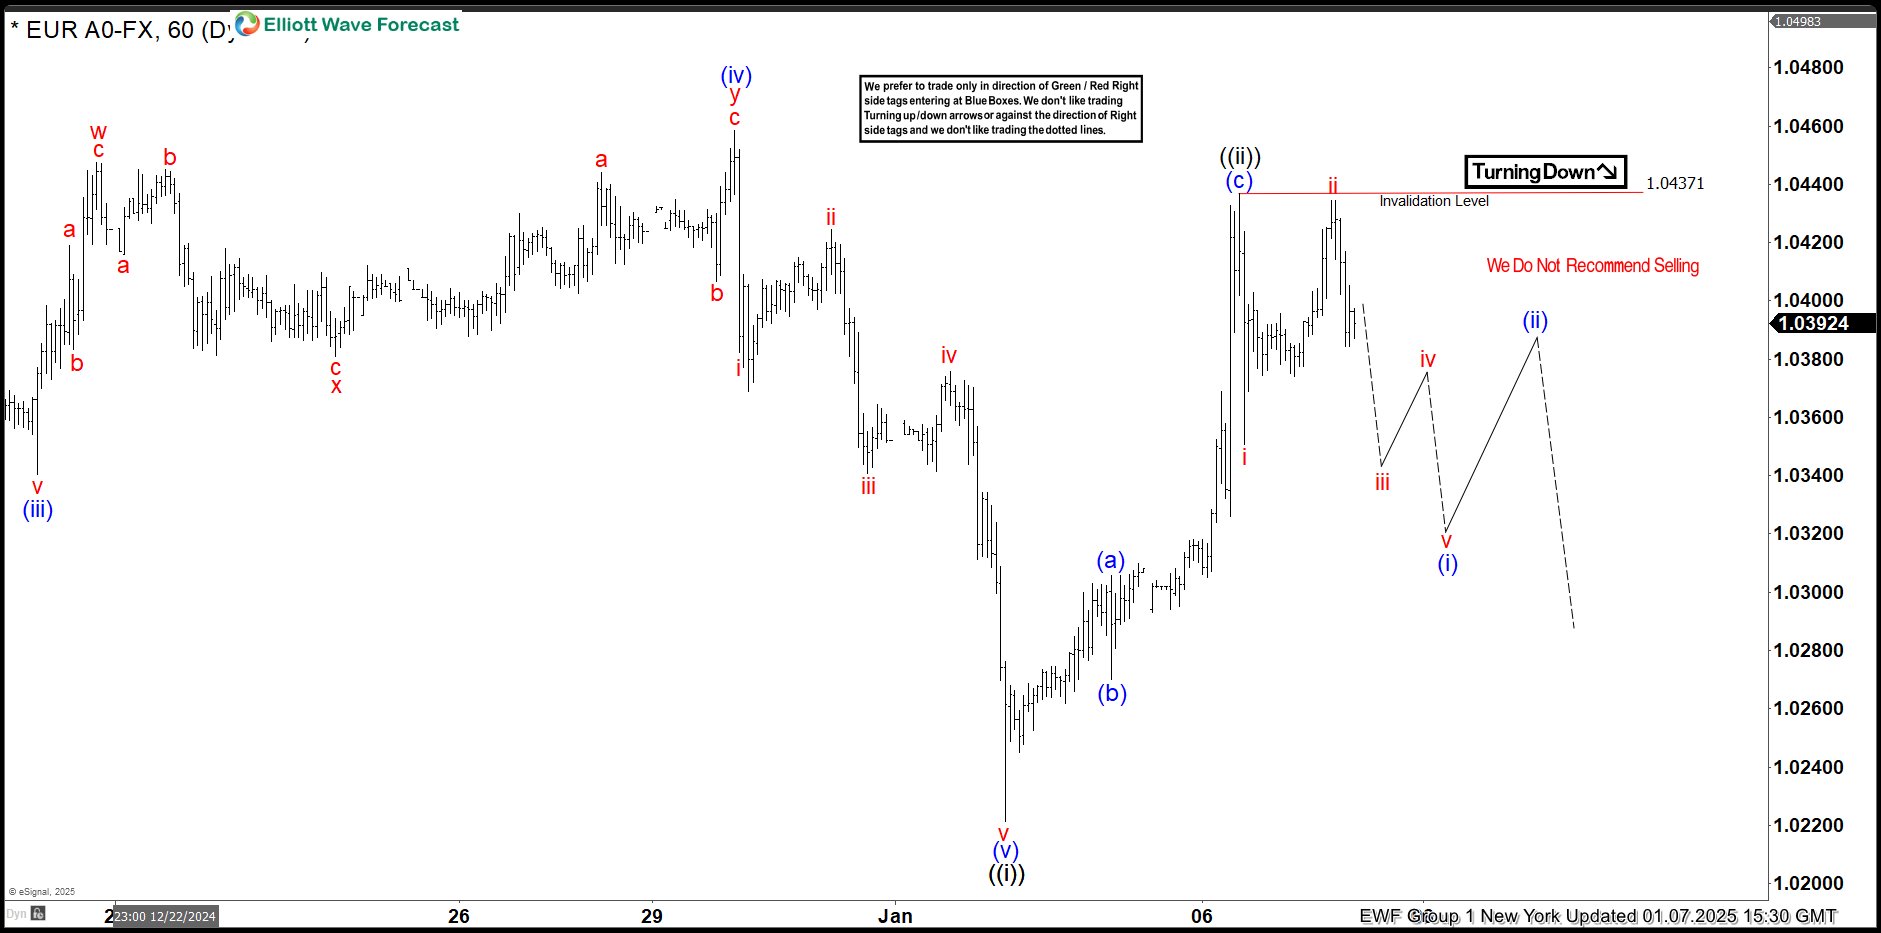
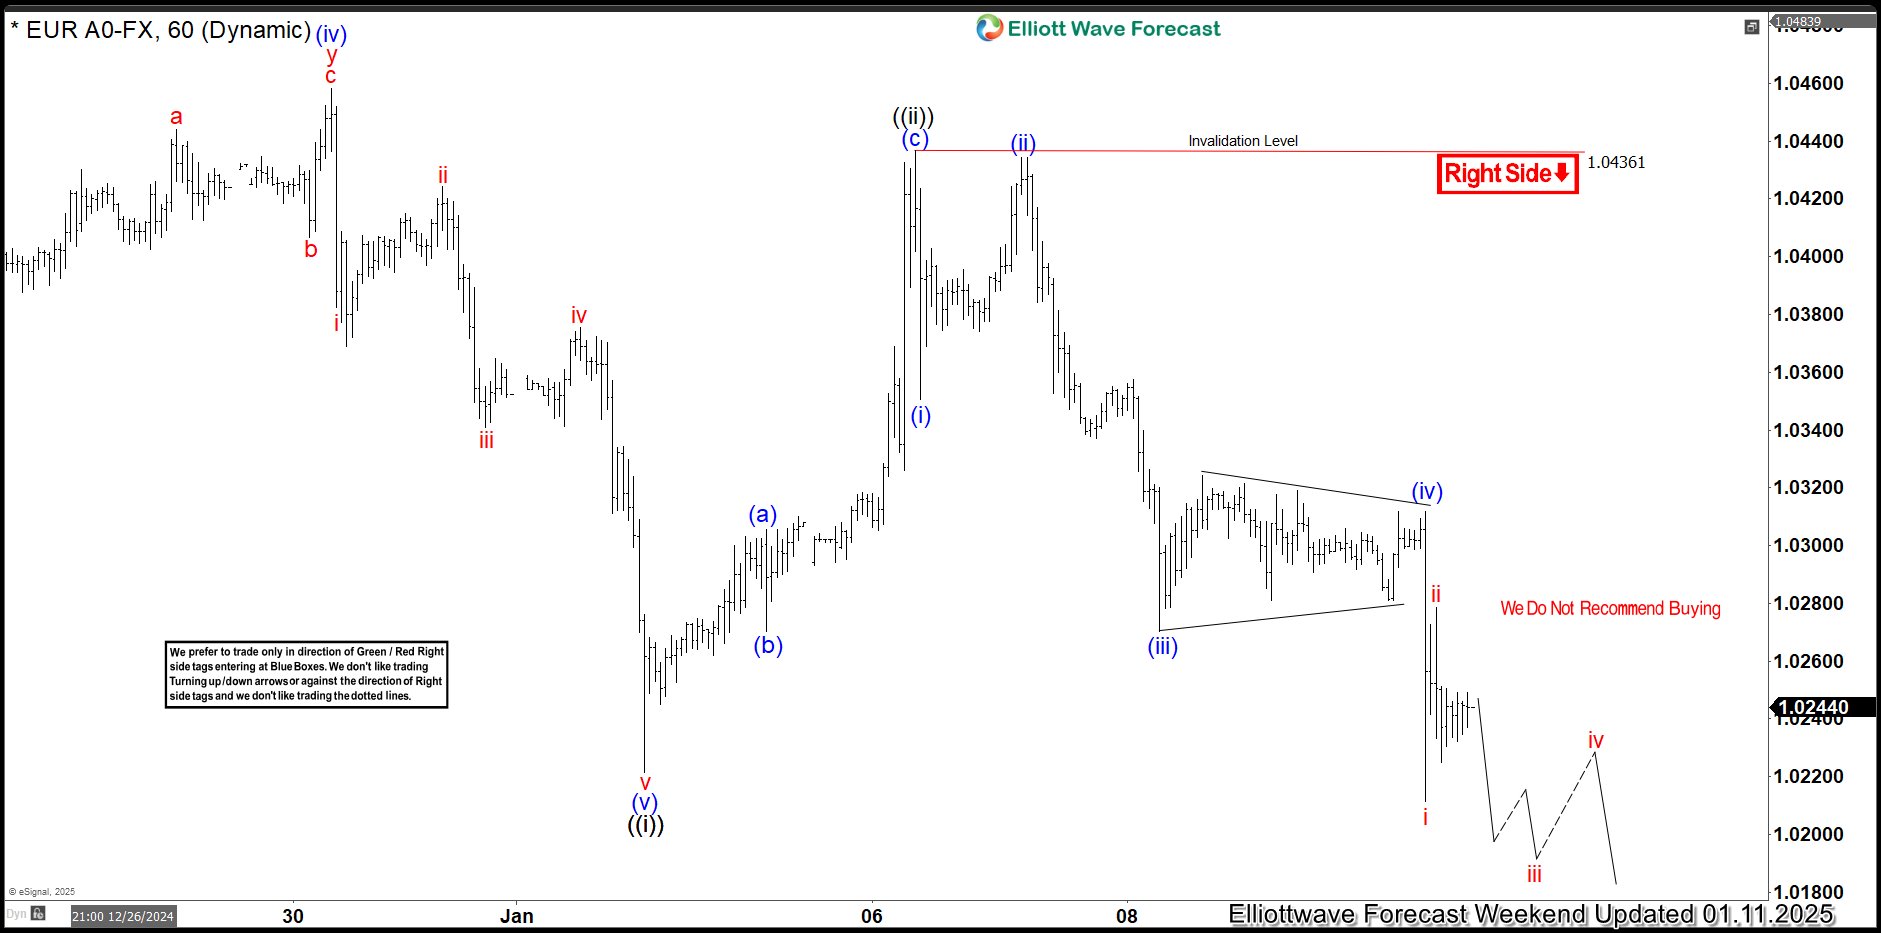
EURUSD Elliott Wave: Forecasting the Decline After 3 Waves Bounce
Hello fellow traders. In this technical article we’re going to take a quick look at the Elliott Wave charts of EURUSD , published in members area of the website. As our members know, EURUSD is still trading within the cycle from the September’s peak. Recently, we saw a 3-wave recovery, followed by a decline toward new lows as expected. In the further text, we are going to explain the wave count.
EURUSD H1 New York 01.07.2025
The current view suggests that EURUSD pair completed a 3-wave recovery at 1.0437 peak , labeled as wave ((ii)) black. A sharp drop followed from this high, appearing impulsive . We have labeled this short-term cycle as wave i red. As far as the price stays below 1.0437 high, we believe next leg down can be in progress. We expect EURUSD to continue finding intraday sellers in 3, 7, and 11 swings.
EURUSD H1 Weekend update 01.11.2025
The 1.0437 high held as expected. We got a decent decline when the price broke toward new lows, confirming wave ((iii)) is in progress. We don’t recommend buying the pair yet, and expect to see further weakness in upcoming days.
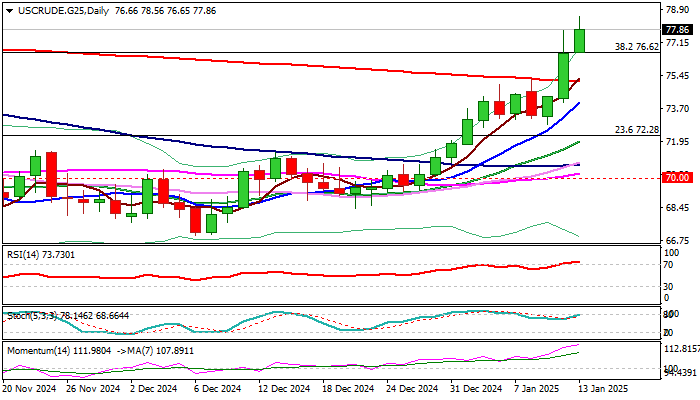
WTI Oil: Price Rises Further on Supply Concerns Over the Latest US Sanctions on Russia
WTI oil price spiked to new multi-month high ($78.66, the highest since Aug 14) on Monday, as steep bull-leg off $72.83 higher low, extends into third consecutive day.
Growing supply concerns on the newest US sanctions on Russian oil industry strongly inflated oil prices, with expectations that WTI price could rise to $85 per barrel.
The US aims to hurt Russian exports to China and India, world’s first and third oil importers, in continuous attempts to weaken Russian economy, after the military component of the conflict showed unsatisfactory results.
Obviously, the sanctions used as a weapon in conflict, so far did not significantly hit the Russia despite a number of packages of sanctions imposed and will be interesting to watch the reaction from OPEC (where Russia play important role), as well as China and India, which will be directly hit by the newest decision.
It is also important to mention that oil prices were not hit significantly from the war (except a spike above $100 in early stage of war), remaining resilient even during the escalation of the new conflict sparked in the Middle East last year.
So far, all sanctions (particularly those in energy sector, one of Russia’s key sources of income) caused more damage to those that imposed the sanction (except the US) and more important, did not cause any significant disruption in oil production and supply, keeping the oil market in a steady run.
This implies that current rally might not last long and probably without significant impact on the larger picture, as long as oil price stays below $90 per barrel.
Technical picture remains firmly bullish on daily chart, with Friday’s break above 200DMA and formation of 5/200 DMA golden cross, adding to positive outlook, however overbought conditions may boost headwinds that bulls feel at the zone of former top at $78.45 (Oct 8 peak).
Today’s Asian session low ($76.65, also broken Fibo 38.2% of $95.00/$65.26 / 100WMA) marks initial support, with extended dips to ideally hold above broken 200DMA ($75.10) to mark a healthy correction and keep bulls in play for retest of $78.45 and attempts through weekly cloud base ($78.99) towards $80 target (psychological, reinforced by 200WMA).
Res: 78.56; 78.99; 80.00; 81.35.
Sup: 76.65; 75.10; 74.71; 72.83.