Sample Category Title
AUD/USD Steady as Consumer Sentiment Slips Lower
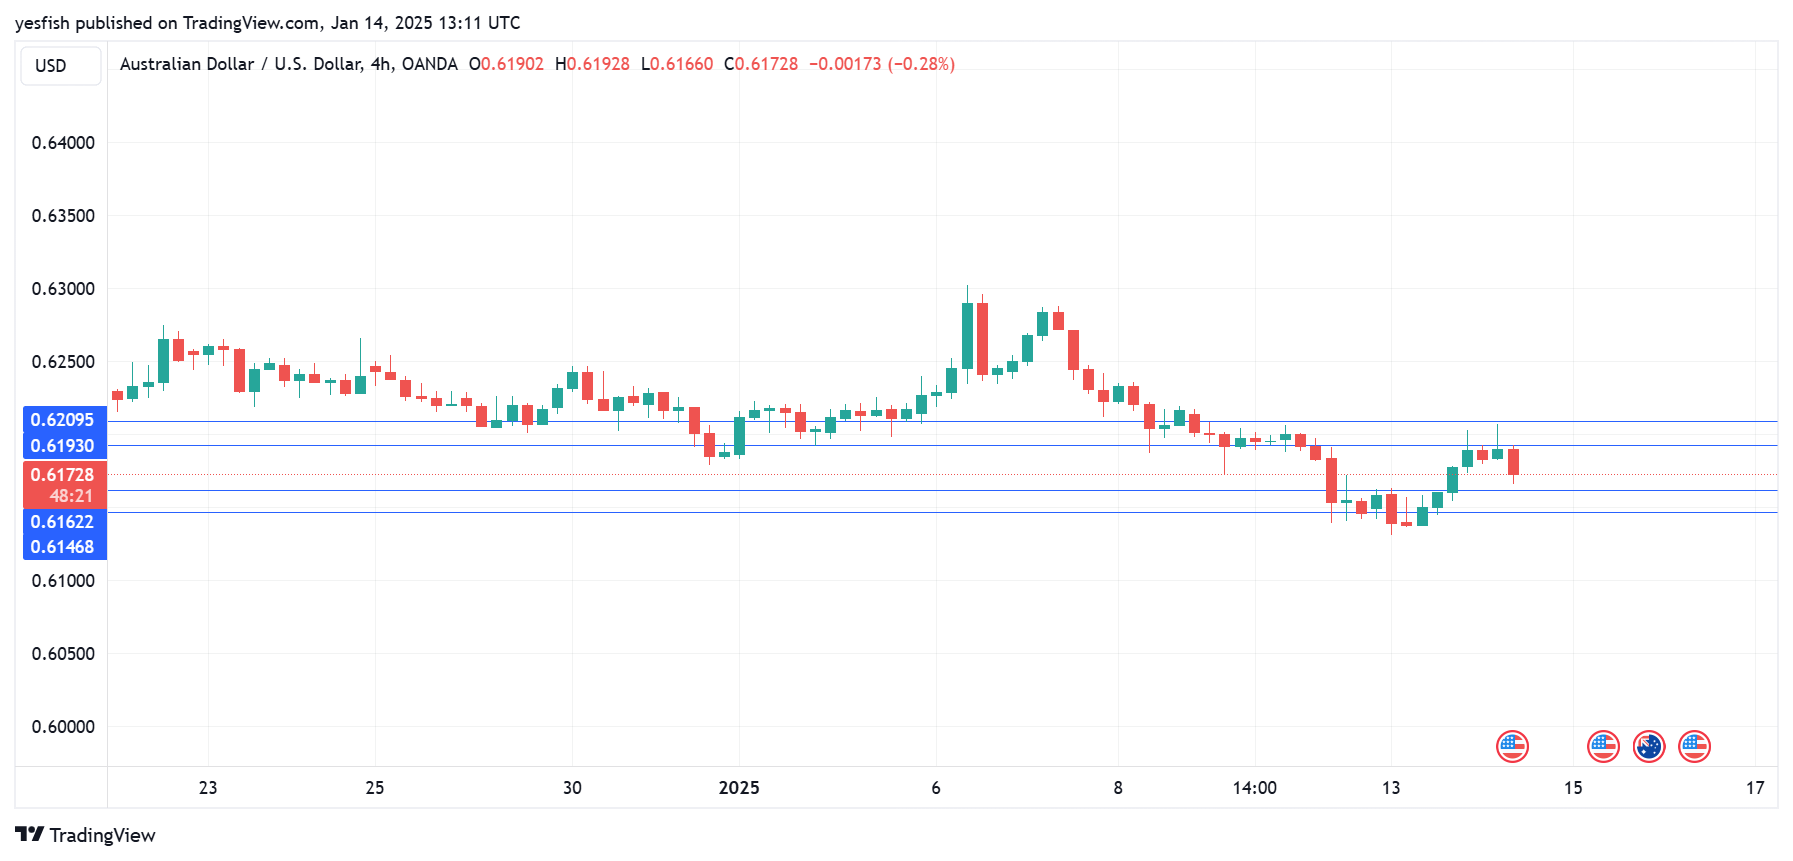
The Australian dollar is showing little movement on Tuesday. In the European session, AUD/USD is trading at 0.6174, down 0.06% at the time of writing.
Australian consumer sentiment declines for second straight month
The Australian consumer remains pessimistic about the economic outlook. The Westpac consumer sentiment index fell 0.7% in January from -2% in December 2024. This brought the index down to 92.1 in January, down from 92.8 a month earlier.
The Westpac report found that confidence over employment has been falling and interestingly, a majority of consumers expect interest rates to move higher, despite signals that the Reserve Bank of Australia’s first rate move will be a cut rather than a hike. The RBA hasn’t moved on rates in over a year and the current cash rate of 4.25% continues to squeeze businesses and consumers. Australia releases third-quarter inflation on Jan. 29 and the central bank will be watching. That inflation reading could result in a historic rate cut if inflation is lower than expected.
We’ll get a look at the US Producer Price Index later today, with mixed numbers expected. PPI is projected to jump from 3.0% to 3.4% y/y while decreasing monthly from 0.4% to 0.3%. Core PPI and is expected to jump to 3.8% y/y from 3.4% and from 0.2% to 03% m/m. If the PPI report indicates an acceleration as is expected, the money markets will likely lower their expectations for a rate cut. Currently, the money markets have priced in a quarter-point cut at the Jan. 29 meeting at below 3% and at the March meeting at around 20%. Federal Reserve members are sounding hawkish and have signaled that the market shouldn’t expect a rate cut anytime soon.
AUD/USD Technical
- AUD/USD tested resistance at 0.6193 earlier. Above, there is resistance at 0.6209
- 0.6162 and 0.6146 are providing support
Ethereum (ETHUSD) Elliott Wave Forecast: Predicting the Future Path
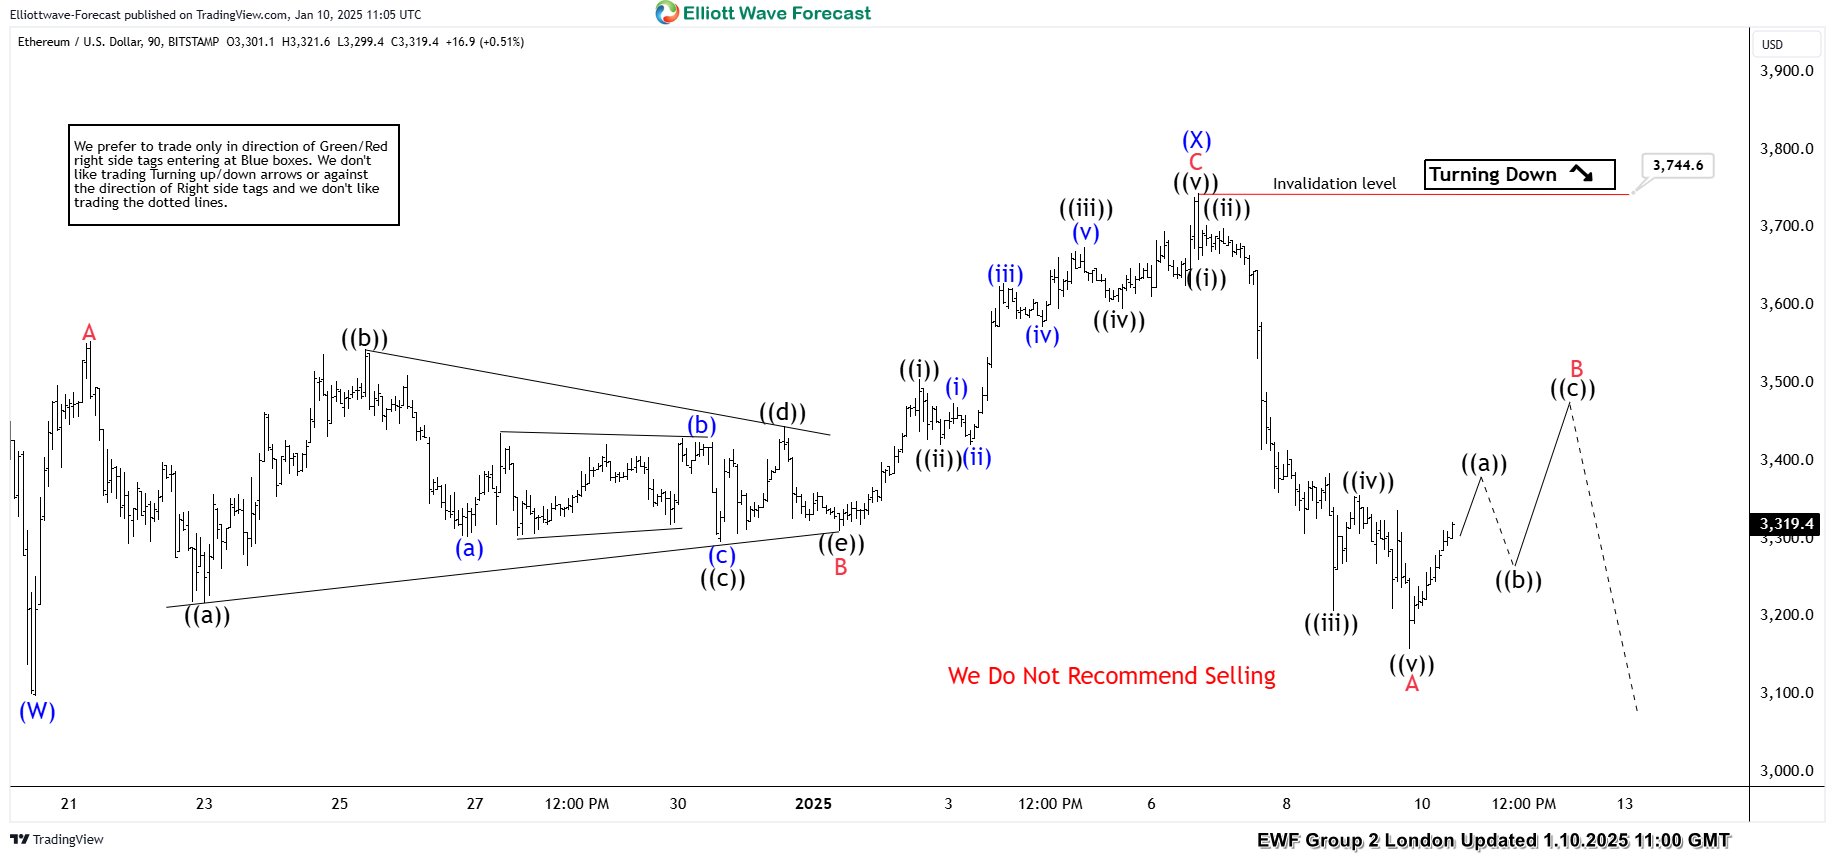
In this technical article we’re going to take a look at the Elliott Wave charts charts of Ethereum ETHUSD published in members area of the website. As our members know, we generally favor the long side in cryptos, which have recently offered good trading opportunities. However, ETHUSD can be still correcting the cycle from the August low and is not yet ready for buying at this stage. In the following text, we will explain the Elliott Wave forecast.
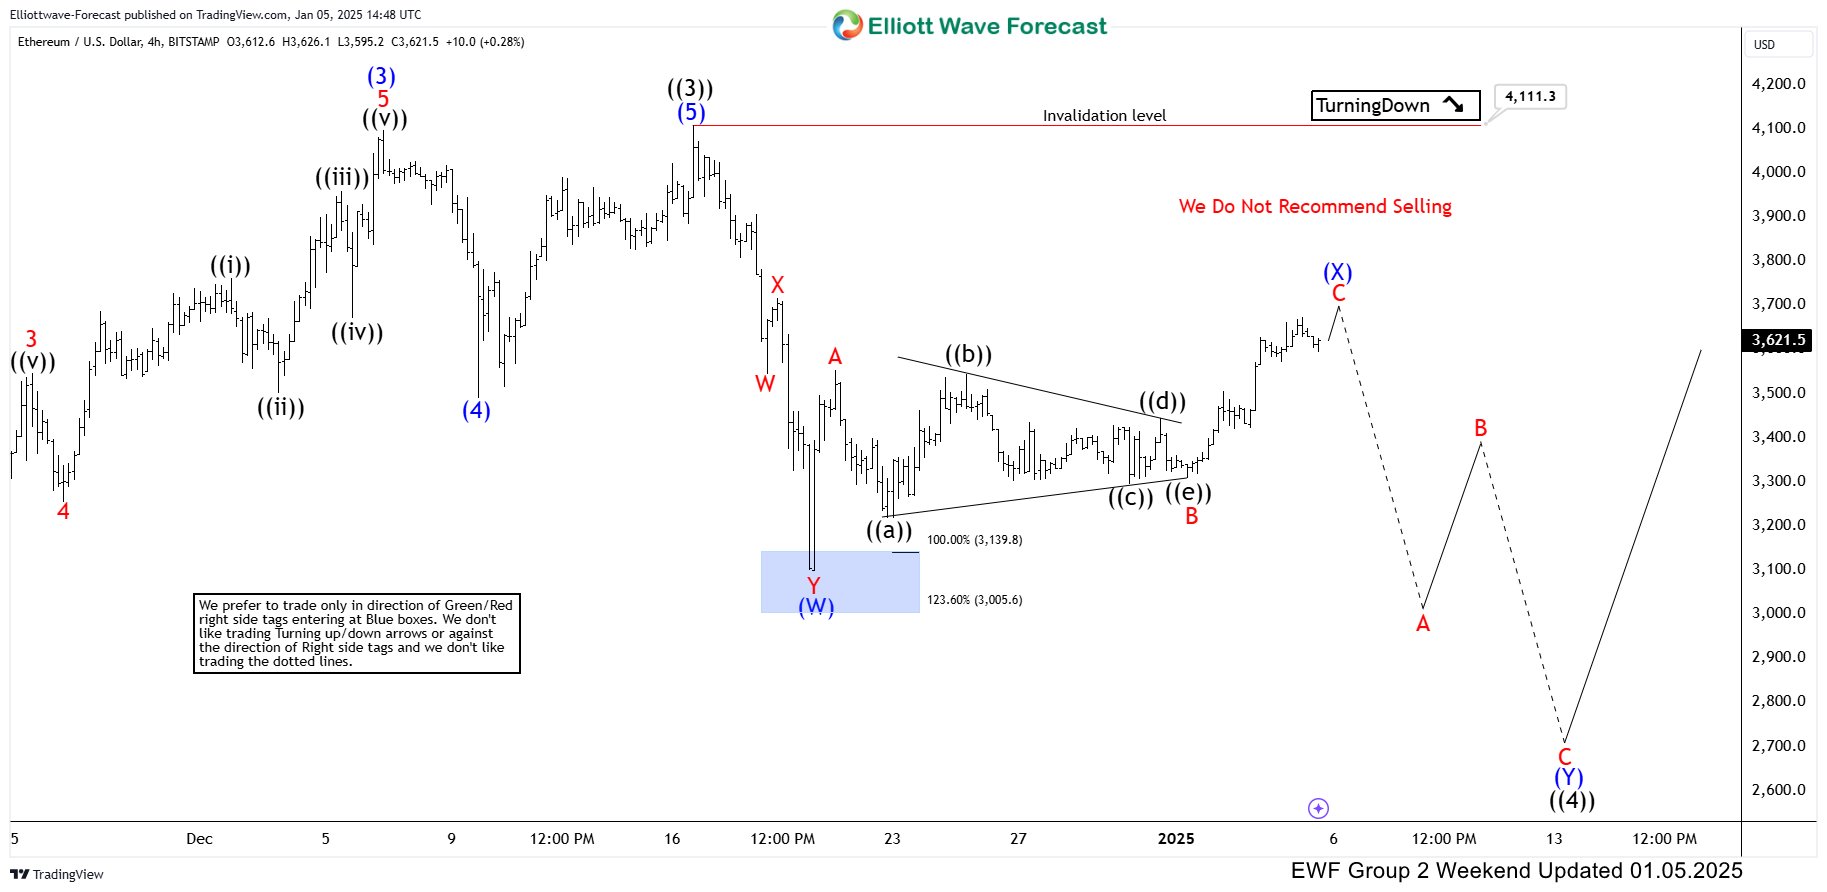
Ethereum ETHUSD 1h Hour Elliott Wave Analysis 01.05.2025.
Currently, ETHUSD is correcting the cycle from the 4111.3 high. The Elliott Wave view suggests that the recovery is unfolding as Zig Zag Pattern. When we analyze the lower time frames, we can observe that the inner subdivisions of waves A and B (red) exhibit 5-wave patterns, with wave B ending as a sideways triangle. The (X) connector is approaching the 0.618 Fibonacci retracement level. We believe the (X) connector should ideally end around the 3717.7-3885.1 area. We recommend that our members avoid buying at this stage.
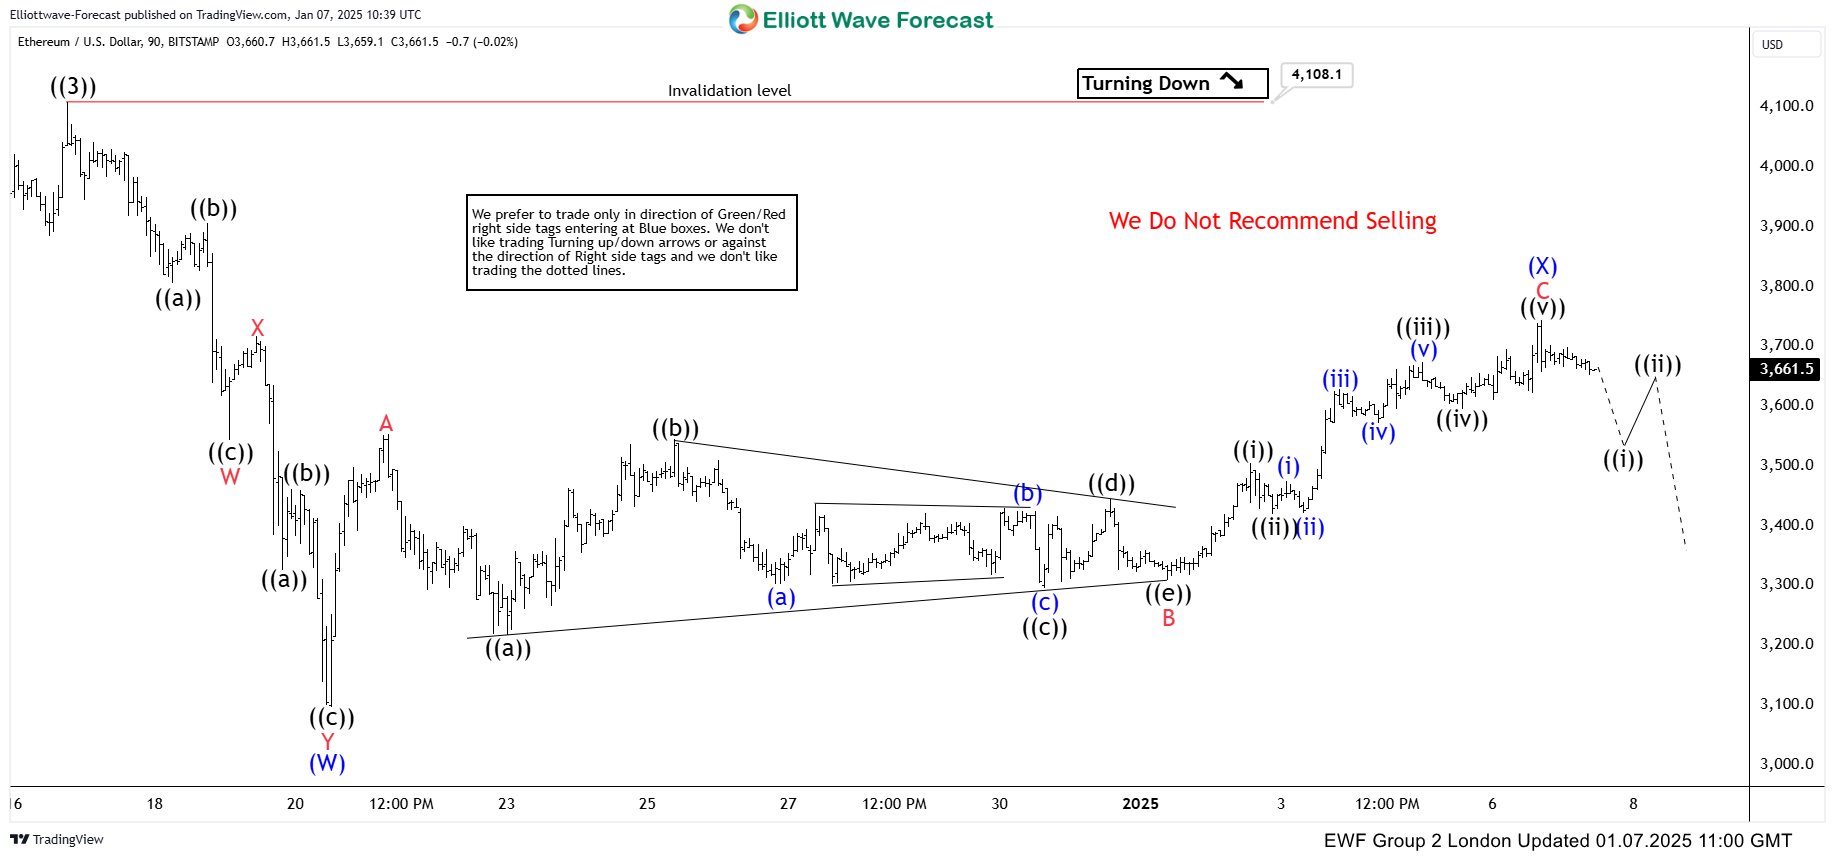
Ethereum ETHUSD 1h Hour Elliott Wave Analysis 01.07.2025.
The current view suggests the (X) connector may have ended at the 3477 peak. As long as the price stays below that level, we expect to see further weakness.
Ethereum ETHUSD 1h Hour Elliott Wave Analysis 01.10.2025.
The 3744 peak held well, and we saw further separation from that high as expected. The crypto made a decent drop, forming a clear 5-wave pattern from the 3744 high. We expect to see a 3-wave bounce in red wave B before the further decline continues, ideally toward new lows. ETHUSD can target the 2713 area, as long as the pivot at the 3744 high holds. Overall, the view remains bullish. So .we don’t favor selling and would wait for an extreme zone to be reached before looking to buy again.
Bitcoin: Pushed Back from the Bottom?
Market Picture
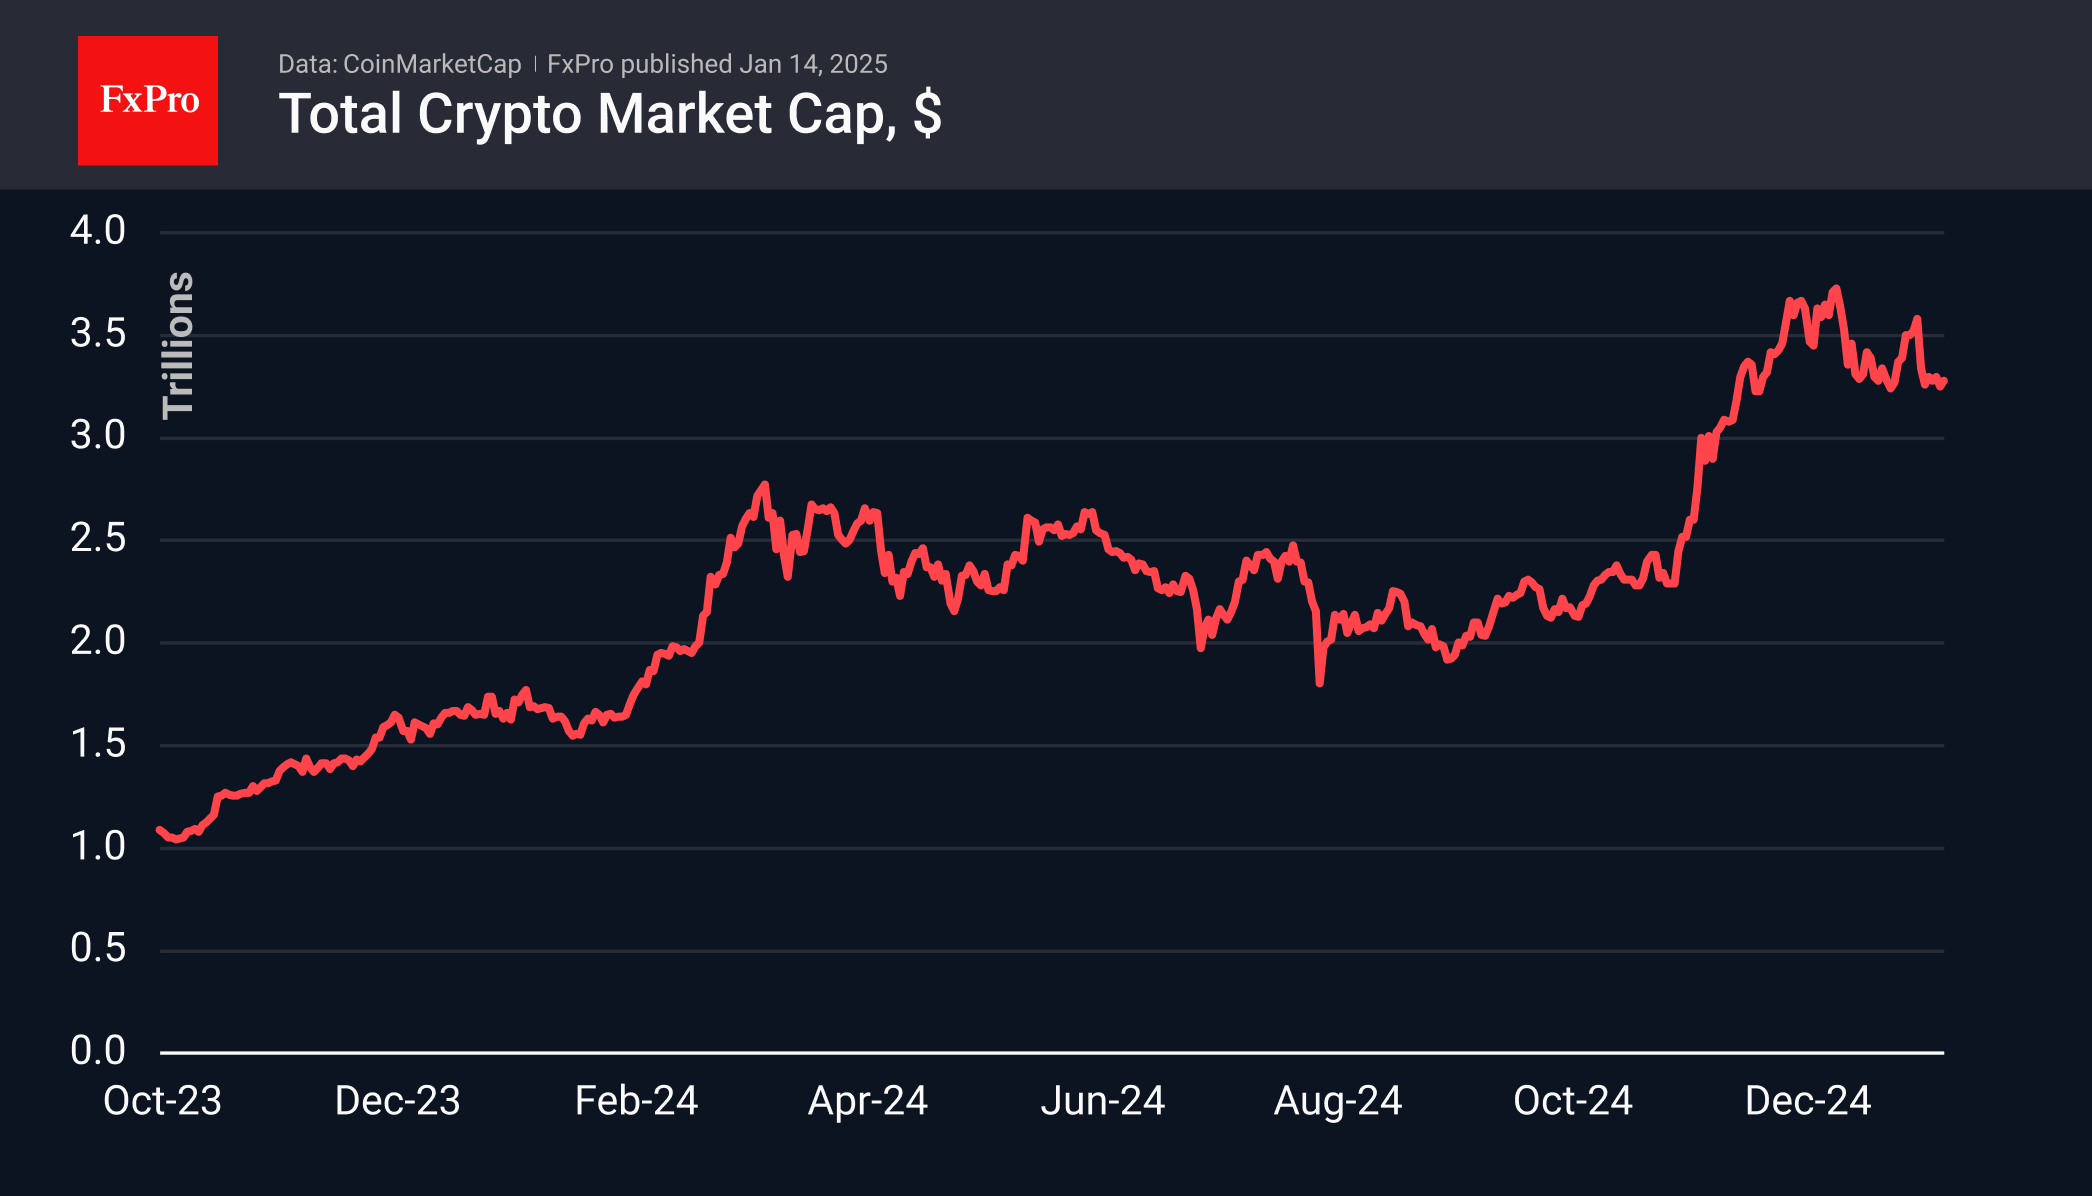
As of Tuesday morning, the cryptocurrency market had increased 2.6% over the past 24 hours to reach $3.31 trillion. The previous evening, its capitalisation was down to $3.14 trillion—its lowest in three and a half weeks.
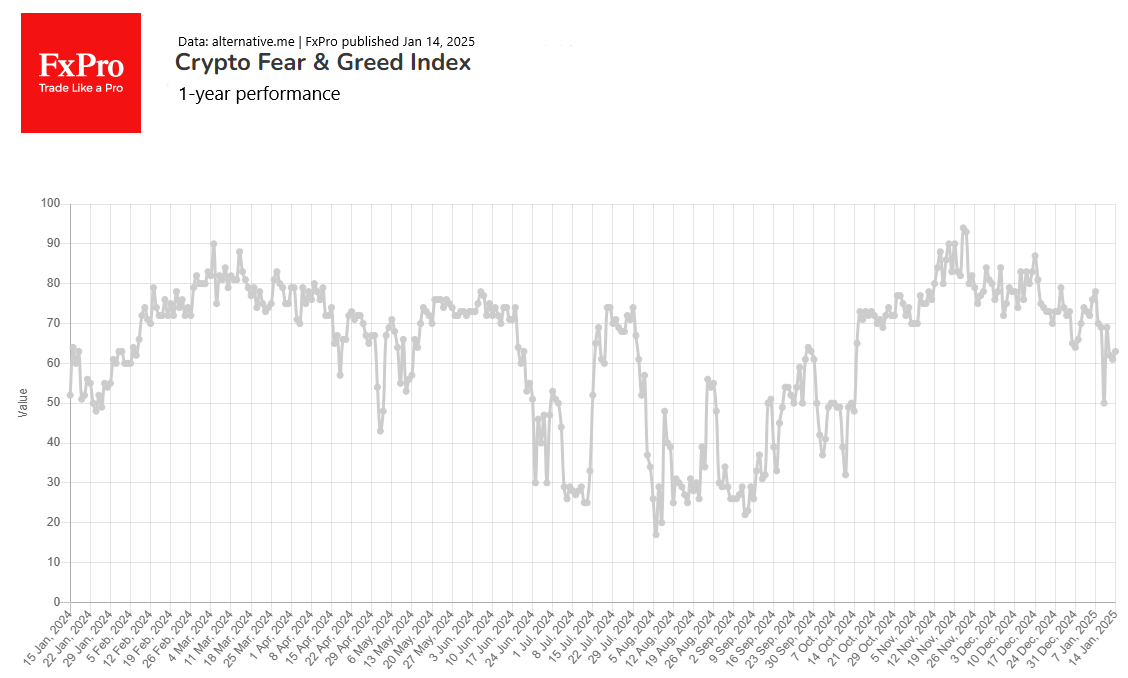
The Crypto Market Sentiment Index rose 2 points on the day to 63, advancing after Friday’s drop to 50 – exactly midway between fear and greed. The index has been drifting downward since late November, but the drop late last week may well have been the bottom for the market.
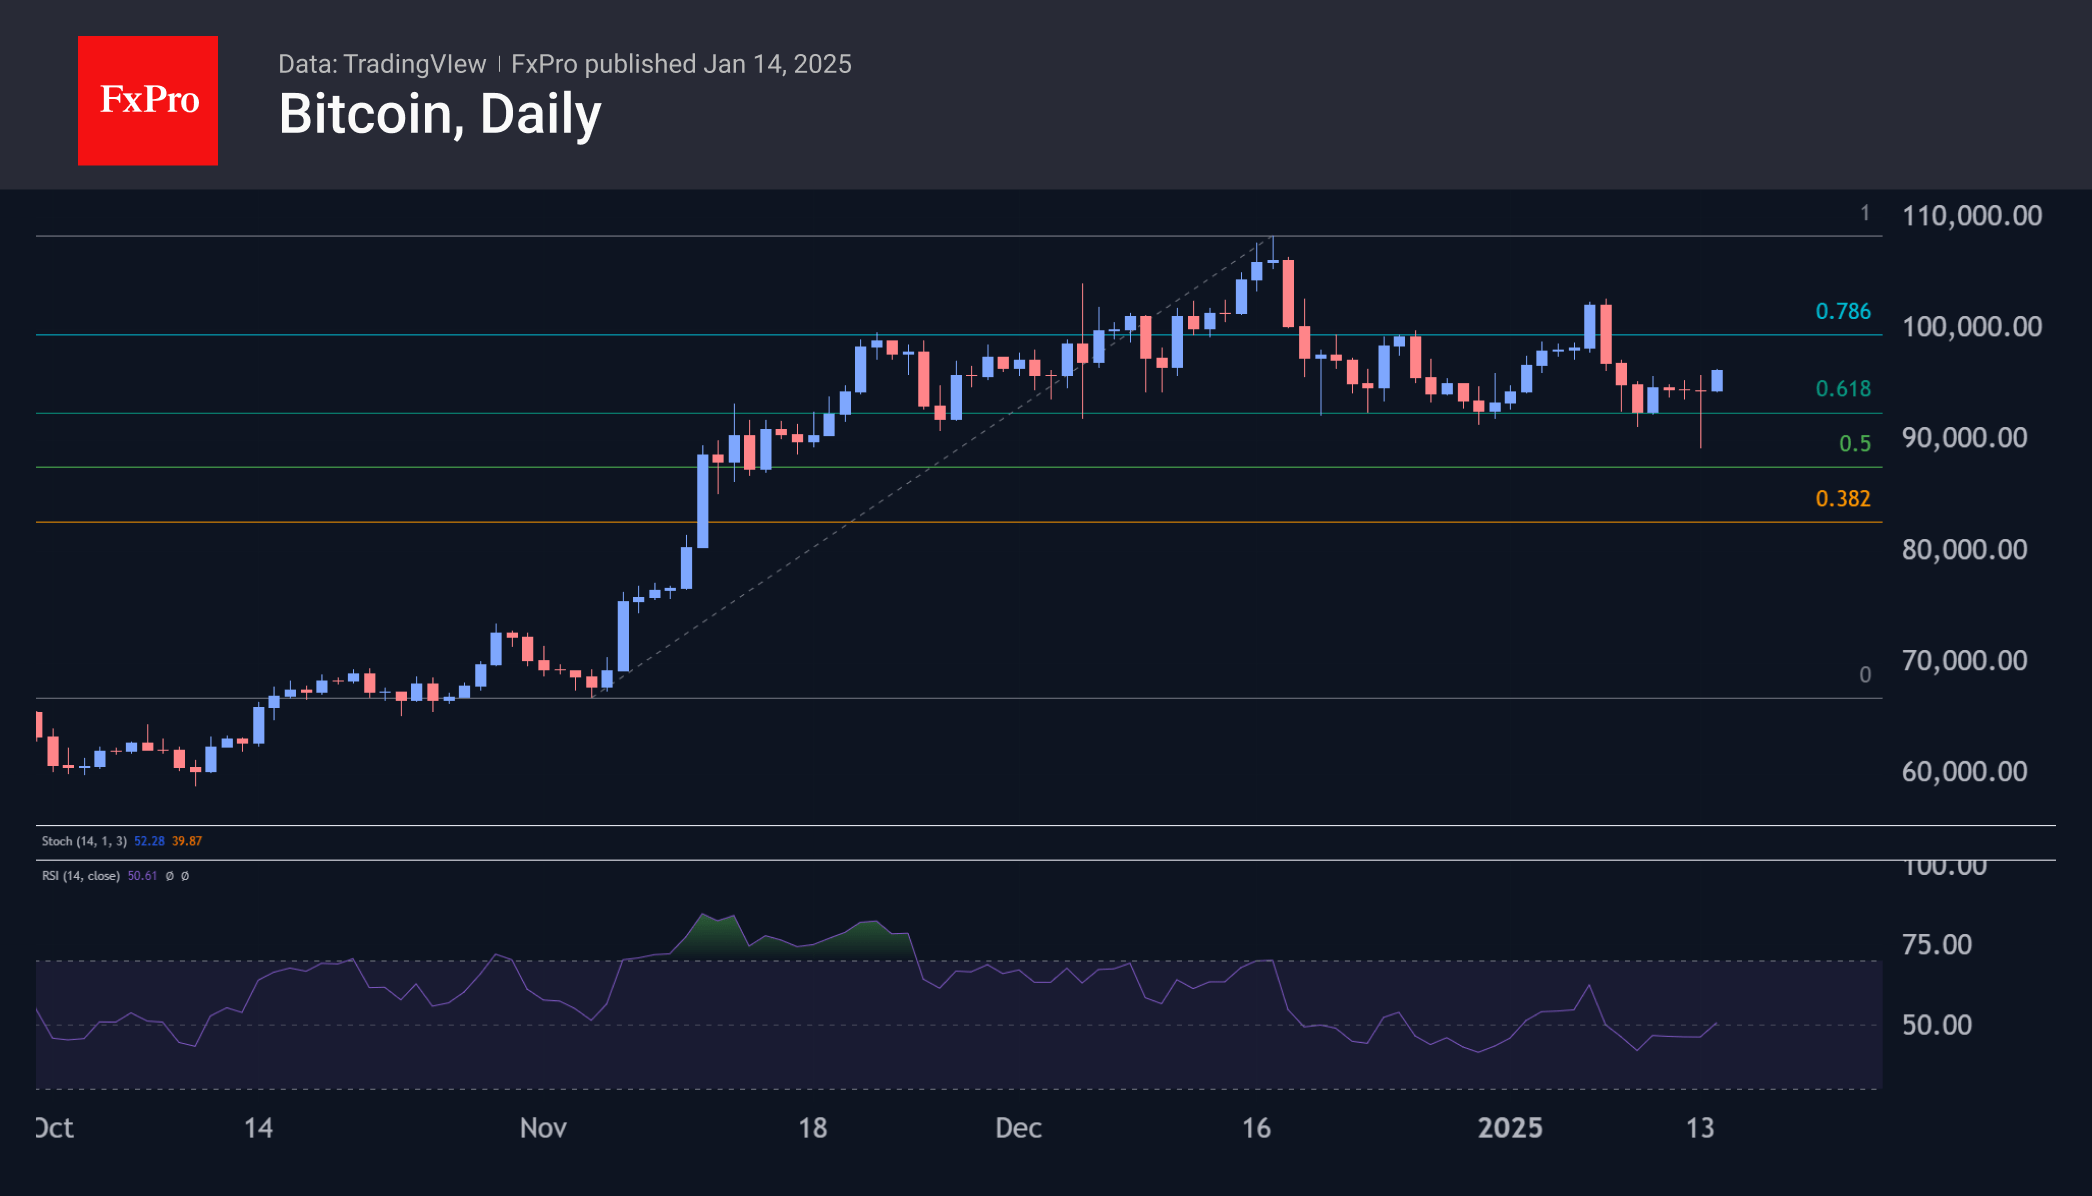
Bitcoin briefly slipped to $89,000 on Monday for the first time since 18 November. This was a liquidation of ‘weak’ long positions by the start of active U.S. trading. Stock markets then recovered, and bitcoin reversed to the upside. Aside from a brief slip to the downside, bitcoin generally held within a consolidation, quickly returning to the $94,000 area. On Tuesday morning, the first cryptocurrency’s rise continues, bringing the price to $95,500.
Despite the prolonged correction, this is still a bull market where it is preferable to look for buying dips rather than selling highs.
News Background
According to CoinShares, global crypto fund investments rose by $48 million last week. Overall, changes in inflows over the past three weeks have been small. Bitcoin investments were up $214 million, XRP was up $41 million, Solana was up $15 million, and Ethereum was down $256 million.
Another recalculation saw the first cryptocurrency’s mining difficulty increase by 0.61%, updating the record at 110.45 T. The average hash rate for the period since the previous value change was 804.05 EH/s.
Tether is ‘completing all formalities’ to move to El Salvador after successfully obtaining a digital asset service provider licence as a stablecoin issuer. Tether is currently registered in the British Virgin Islands.
MicroStrategy bought an additional 2,530 BTC for $243 million last week at an average price of $95.972 per coin. The company holds 450,000 BTC on its balance sheet, purchased for a combined $28.2 billion at an average price of $62.691.
According to Bloomberg, the Trump administration is considering candidates for a cryptocurrency advisory board from among the CEOs of key companies in the industry. The council is expected to begin work in late January.
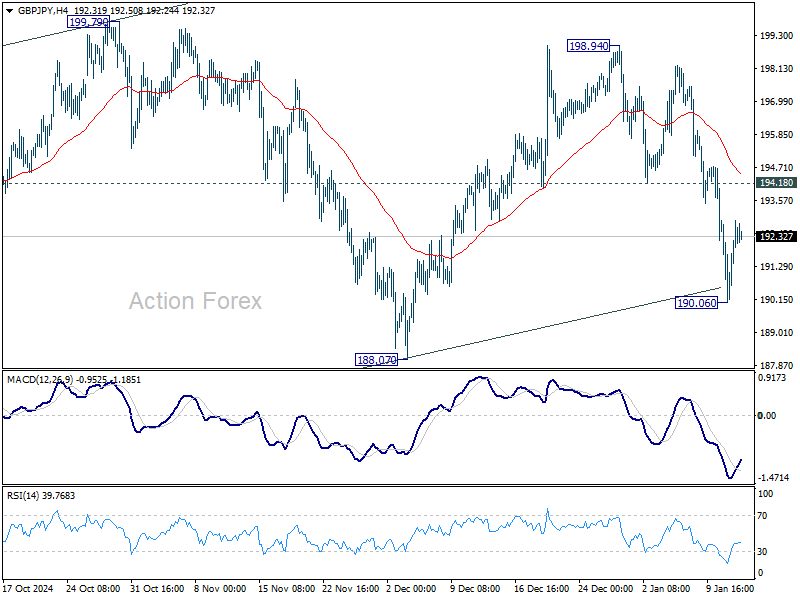
GBP/JPY Daily Outlook
Daily Pivots: (S1) 190.57; (P) 191.67; (R1) 193.27; More...
Intraday bias in GBP/JPY is turned neutral with current recovery. Rebound from 188.07 could have completed at 198.94 already. Risk will stay on the downside as long as 194.18 support turned resistance holds. Below 190.06 will target 188.07 support. Firm break there will argue that corrective pattern from 180.00 has finished too, and larger decline from 208.09 might be ready to resume.
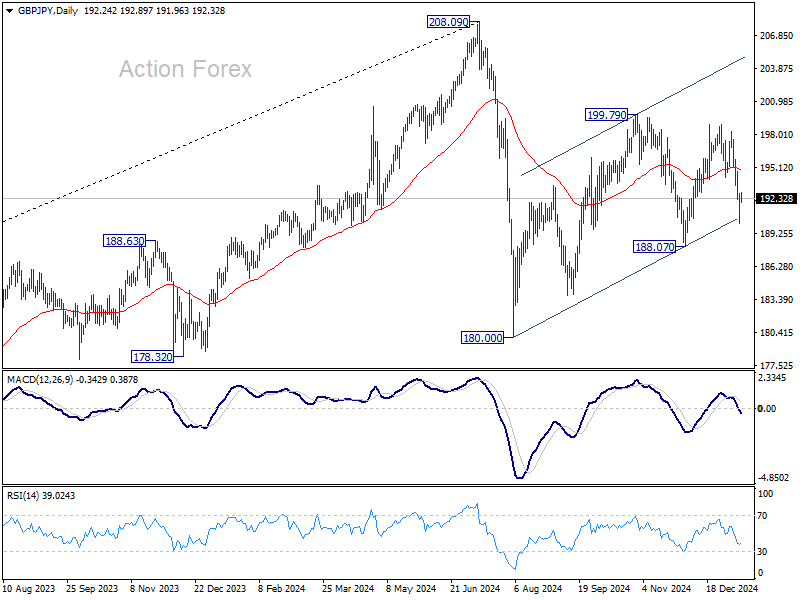
In the bigger picture, price actions from 208.09 are seen as a correction to whole rally from 123.94 (2020 low). The range of consolidation should be set between 38.2% retracement of 123.94 to 208.09 at 175.94 and 208.09. However, decisive break of 175.94 will argue that deeper correction is underway.
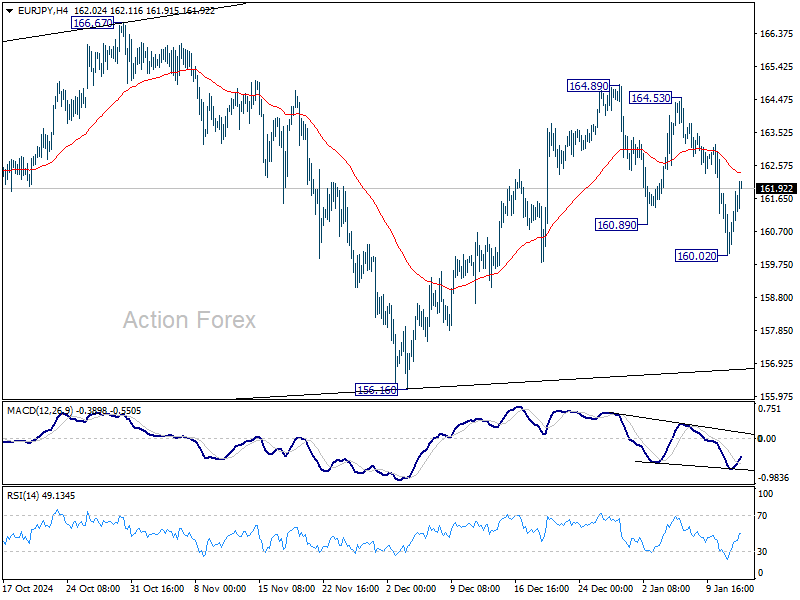
EUR/JPY Daily Outlook
Daily Pivots: (S1) 160.28; (P) 161.04; (R1) 162.04; More...
Intraday bias in EUR/JPY is turned neutral first with current recovery. Rebound from 156.16 might have completed at 164.89 already. Risk will stay on the downside as long as 164.53 resistance holds. Below 160.02 will bring deeper fall to 156.16 support next. Firm break there will argue that corrective pattern from 154.40 has completed, and fall from 175.41 is ready to resume.
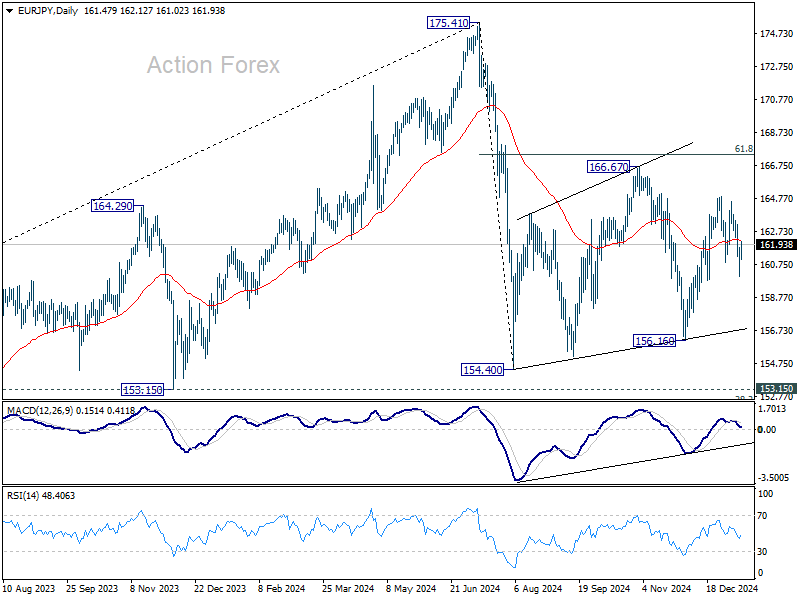
In the bigger picture, price actions from 175.41 are seen as correction to rally from 114.42 (2020 low). The range of consolidation should have been set between 38.2% retracement of 114.42 to 175.41 at 152.11 and 175.41 high. However, decisive break of 152.11 would argue that deeper correction is underway.
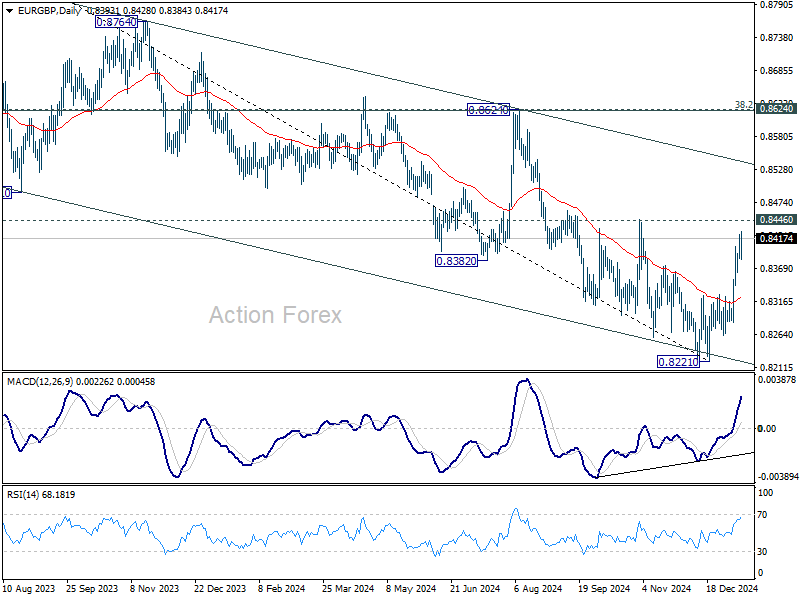
EUR/GBP Daily Outlook
Daily Pivots: (S1) 0.8379; (P) 0.8401; (R1) 0.8417; More...
EUR/GBP edges higher today as rebound from 0.8221 extends. Intraday bias stays mildly on the upside for 0.8446 resistance, despite loss of momentum. Firm break there will target 0.8624 cluster resistance zone, even as a corrective move. On the downside, below 0.8384 minor support will turn intraday bias neutral first.
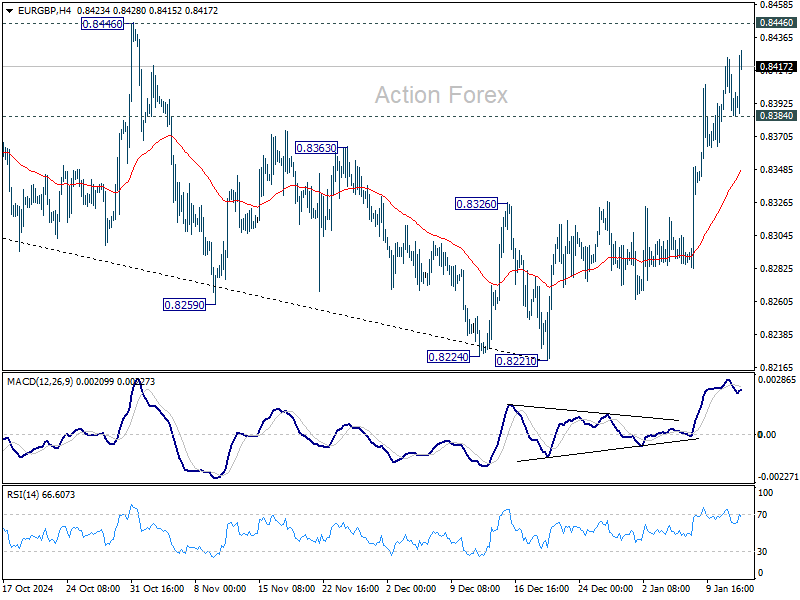
In the bigger picture, considering bullish convergence condition in D MACD, decisive break of 0.8446 resistance and 55 D EMA (now at 0.8446) should confirm medium term bottoming at 0.8221, just ahead of 0.8201 key support (2022 low). Further rally should be seen towards 0.8624 key resistance, even as a correction to the down trend from 0.9267 (2022 high). Overall, however, medium term outlook will be neutral at best until decisive break of 0.8624 cluster zone (38.2% retracement of 0.9267 to 0.8221 at 0.8621). Risk will stay on the downside even in case of strong rebound.
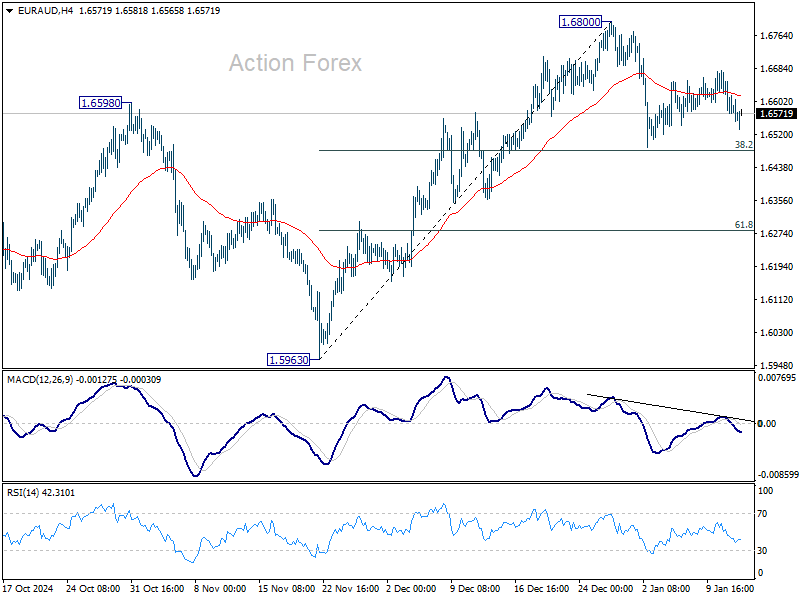
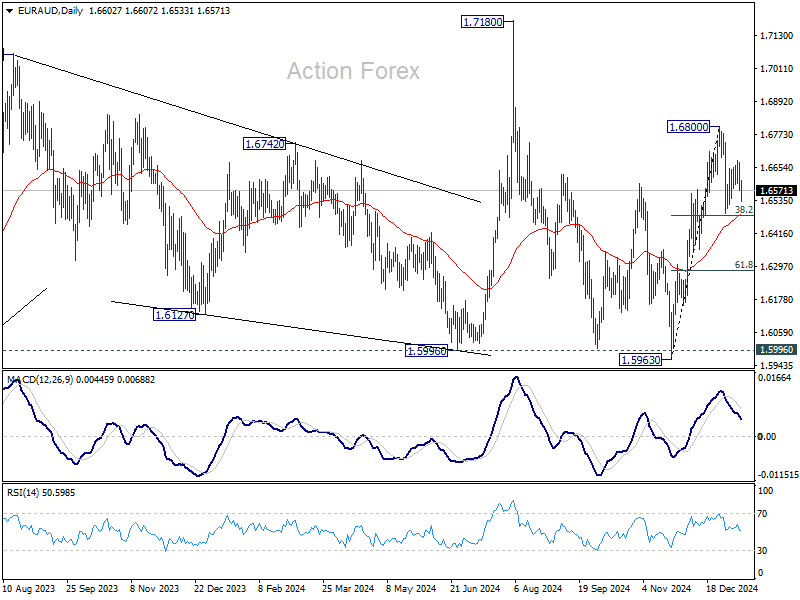
EUR/AUD Daily Outlook
Daily Pivots: (S1) 1.6545; (P) 1.6611; (R1) 1.6648; More...
No change in EUR/AUD's outlook as consolidation from 1.6800 is extending. Downside should be contained by 38.2% retracement of 1.5963 to 1.6800 at 1.6480 in case of another fall. Firm break of 1.6800 will resume the rally from 1.5963. However, firm break of 1.6480 will bring deeper correction 61.8% retracement at 1.6283.
In the bigger picture, EUR/AUD is holding on to 1.5996 key support despite brief breach. Larger up trend from 1.4281 (2022 low) is still in favor to resume through 1.7180 at a later stage. Nevertheless, sustained break of 1.5995 will indicate that such up trend has completed and deeper decline would be seen.
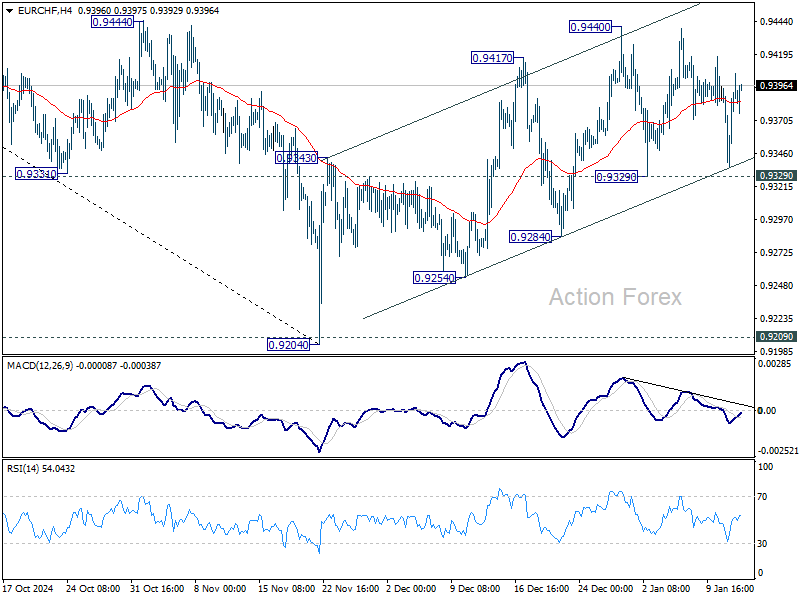
EUR/CHF Daily Outlook
Daily Pivots: (S1) 0.9355; (P) 0.9377; (R1) 0.9417; More....
Sideway trading continues in EUR/CHF and intraday bias stays neutral. Corrective rebound from 0.9204 could still extend higher. But upside should be limited by 0.9481 fibonacci resistance. On the downside, firm break of 0.9329 support will argue that the correction has completed, and turn bias back to the downside for 0.9284 support first.
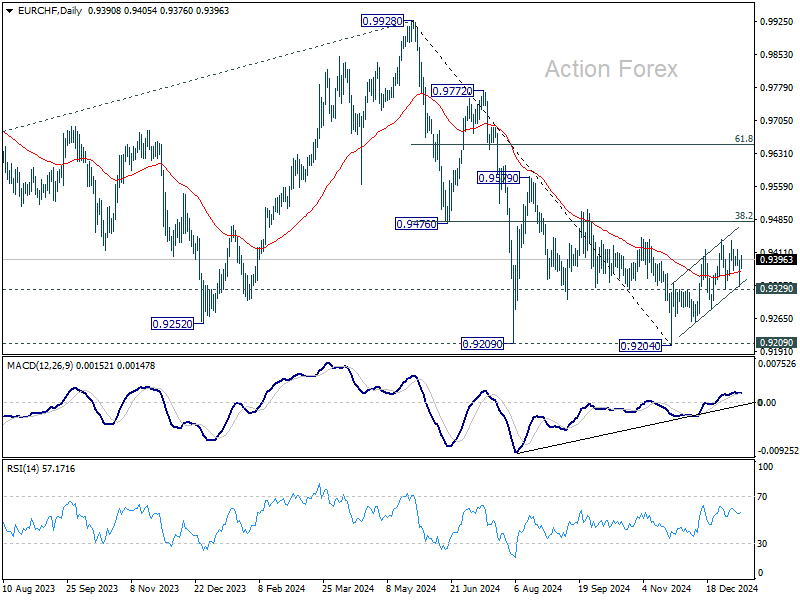
In the bigger picture, while corrective rebound from 0.9204 might extend higher, strong resistance could be seen from 38.2% retracement of 0.9928 to 0.9204 at 0.9481 to limit upside. Down trend from 0.9928 (2024 high) is still in favor to resume through 0.9204/9 support zone at a later stage.
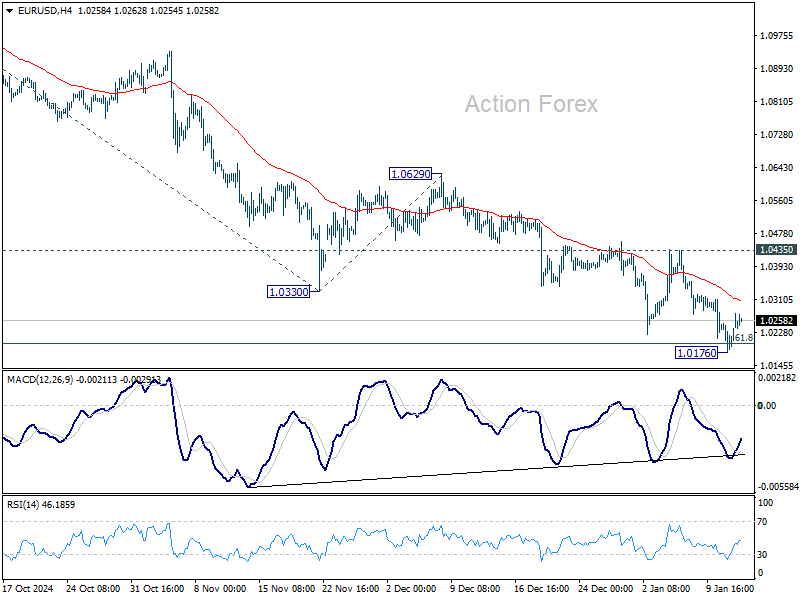
EUR/USD Daily Outlook
Daily Pivots: (S1) 1.0198; (P) 1.0224; (R1) 1.0270; More...
Intraday bias in EUR/USD is turned neutral first with current recovery and some consolidations would be seen above 1.0176 temporary low. Further decline is expected as long as 1.0435 resistance holds. ON the downside, break of 1.0176 will resume the fall from 1.1213 and target 61.8% projection of 1.1213 to 1.0330 from 1.0629 at 1.0083.
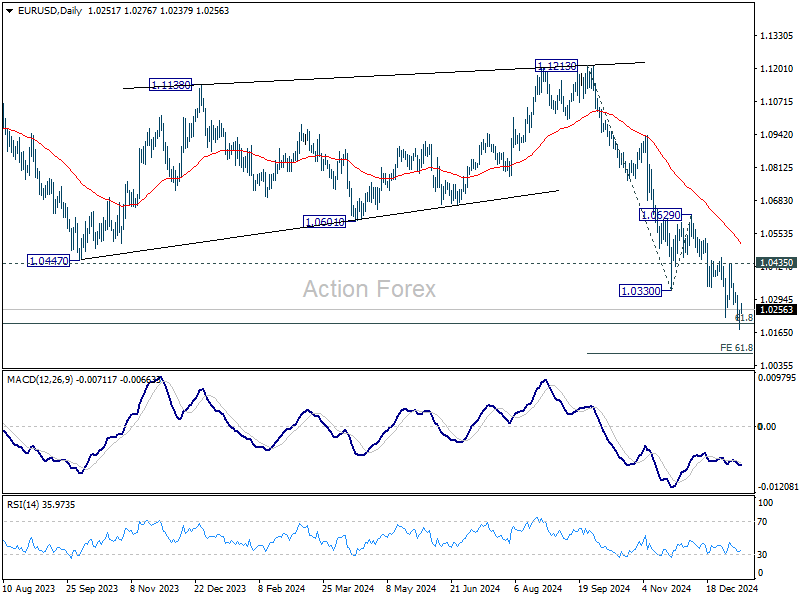
In the bigger picture, fall from 1.1274 (2023 high) should either be the second leg of the corrective pattern from 0.9534 (2022 low), or another down leg of the long term down trend. In both cases, sustained break of 61.8 retracement of 0.9534 to 1.1274 at 1.0199 will pave the way back to 0.9534. For now, outlook will stay bearish as long as 1.0629 resistance holds, even in case of strong rebound.
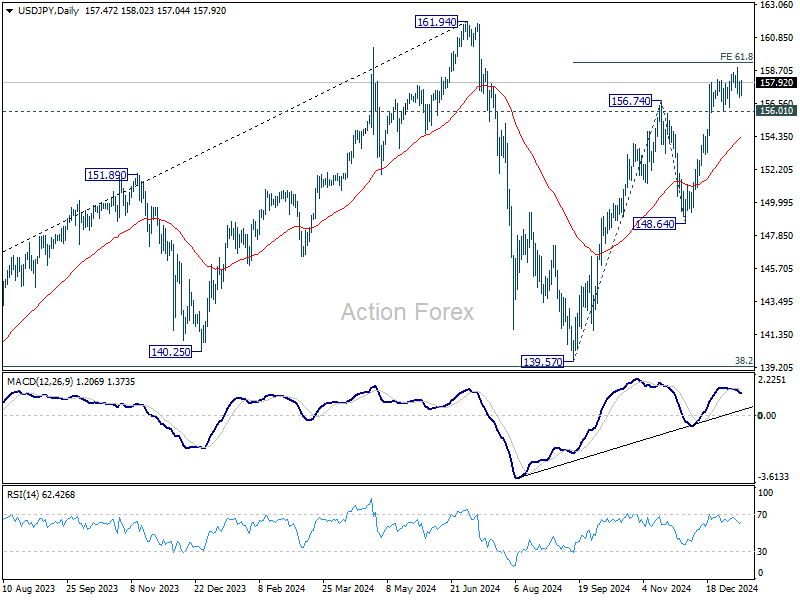
USD/JPY Daily Outlook
Daily Pivots: (S1) 156.94; (P) 157.46; (R1) 157.99; More...
Intraday bias in USD/JPY remains neutral for the moment. Further rally is in favor as long as 156.0 support holds. On the upside, decisive break of 61.8% projection of 139.57 to 156.74 from 148.64 at 159.25 will extend the rally from 139.57 to retest 161.94 high. However, considering bearish divergence condition in 4H MACD, firm break of 156.01 support will indicate short term topping. Intraday bias will then be back on the downside for 55 D EMA (now at 154.37) instead.
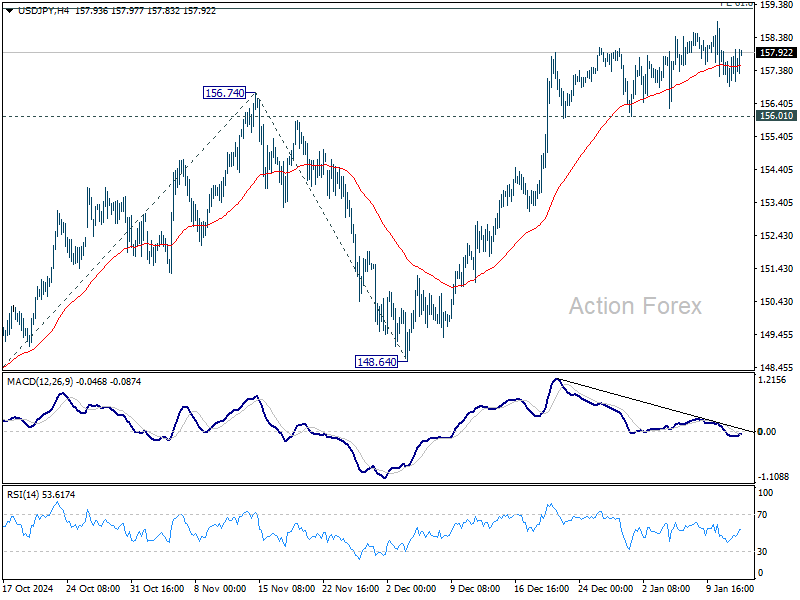
In the bigger picture, price actions from 161.94 are seen as a corrective pattern to rise from 102.58 (2021 low). The range of medium term consolidation should be set between 38.2% retracement of 102.58 to 161.94 at 139.26 and 161.94. Nevertheless, sustained break of 139.26 would open up deeper medium term decline to 61.8% retracement at 125.25.