
Sample Category Title
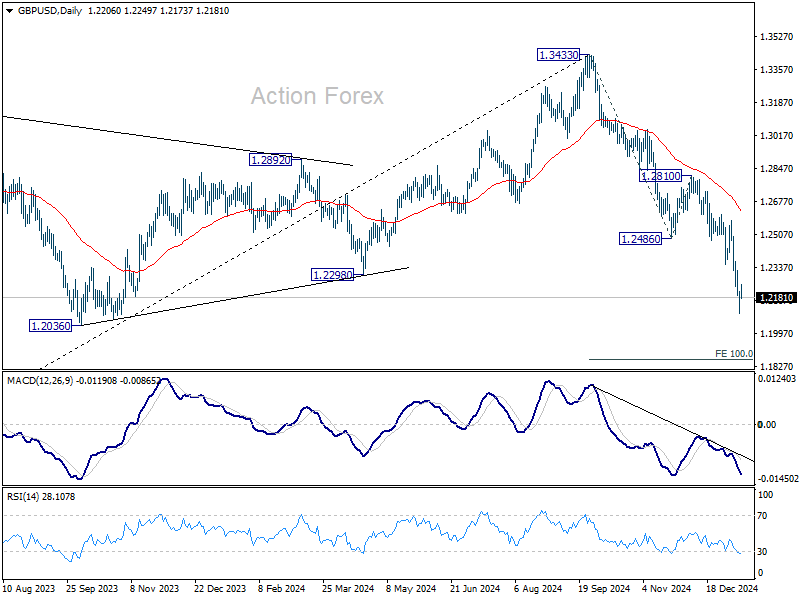
GBP/USD Daily Outlook
Daily Pivots: (S1) 1.2131; (P) 1.2172; (R1) 1.2244; More...
A temporary low is formed at 1.2099 with current recovery, and intraday bias is turned neutral first. Some consolidations would be seen but outlook will stay bearish as long as 1.2486 support turned resistance holds. Break of 1.2099 will resume the decline from 1.3433 to 100% projection of 1.3433 to 1.2486 from 1.2810 at 1.1863.
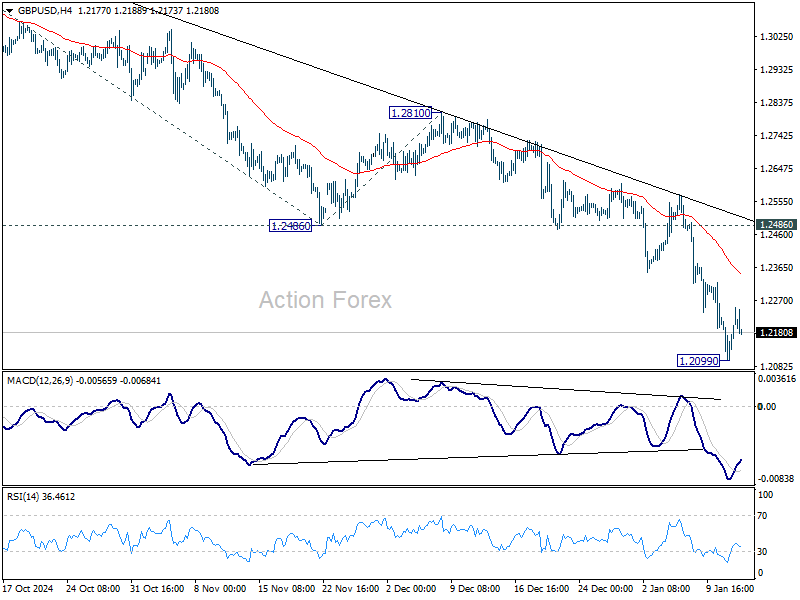
In the bigger picture, rise from 1.0351 (2022 low) should have already completed at 1.3433, and the trend has reversed. Further fall is now expected as long as 1.2810 resistance holds. Deeper decline should be seen to 61.8% retracement of 1.0351 to 1.3433 at 1.1528, even as a corrective move.
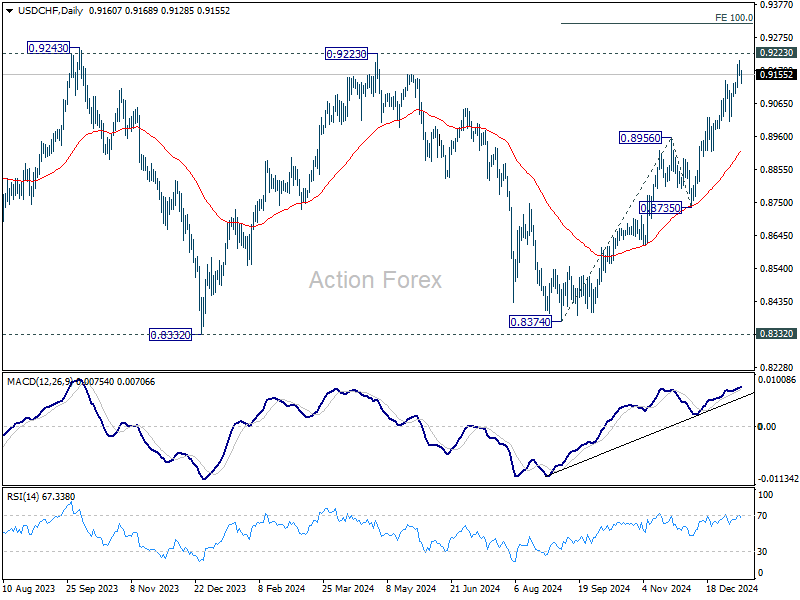
USD/CHF Daily Outlook
Daily Pivots: (S1) 0.9150; (P) 0.9176; (R1) 0.9196; More…
USD/CHF retreated ahead of 0.9223 key resistance and intraday bias is turned neutral for some consolidations. Near term outlook will stay bullish as long as 0.9007 support holds, in case of deep retreat. On the upside, decisive break of 0.9223 will carry larger bullish implications.
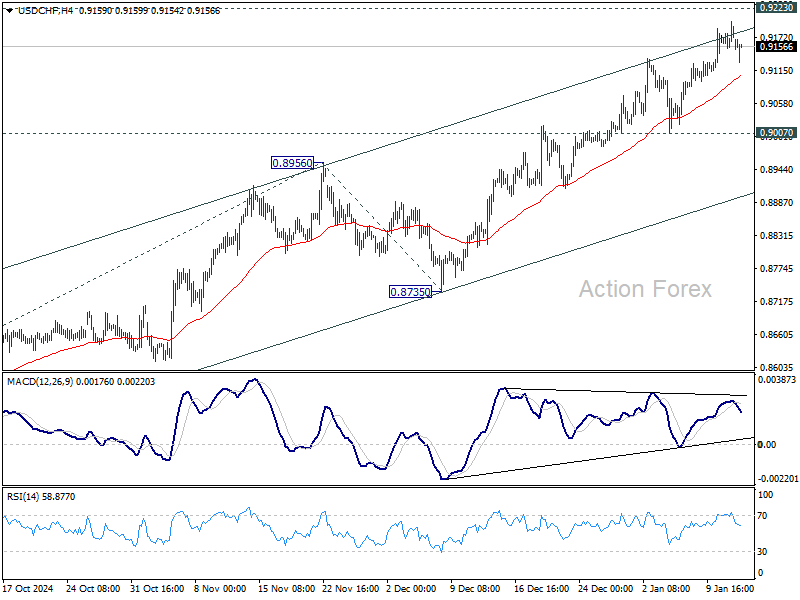
In the bigger picture, price actions from 0.8332 (2023 low) are currently seen as a medium term corrective pattern, with rise from 0.8374 as the third leg. Overall outlook will continue to stay bearish as long as 0.9223 resistance holds. Break of 0.8332 low is in favor at a later stage when the consolidation completes. However, decisive break of 0.9223 will be an important sign of bullish trend reversal.
AUD/USD Daily Report
Daily Pivots: (S1) 0.6146; (P) 0.6162; (R1) 0.6193; More...
A temporary low as formed at 0.6130 with current recovery. Intraday bias is turned neutral first. Further decline is expected in AUD/USD as long as 0.6310 resistance holds. Break of 0.6130 will resume the fall from 0.6941 to 61.8% projection of 0.6687 to 0.6198 from 0.6301 at 0.5999. However, considering bullish convergence condition in 4H MACD, break of 0.6310 will indicate short term bottoming, and turn bias back to the upside for stronger rebound.
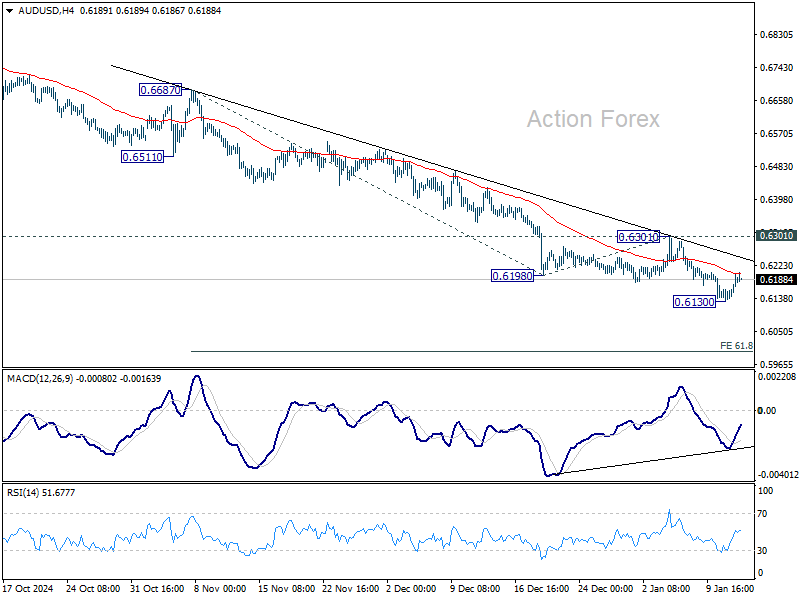
In the bigger picture, down trend from 0.8006 (2021 high) is resuming with break of 0.6169 (2022 low). Next medium term target is 61.8% projection of 0.8006 to 0.6169 from 0.6941 at 0.5806, In any case, outlook will stay bearish as long as 55 W EMA (now at 0.6587) holds.
Japanese Yen in Consolidation After Recent Growth: Signs of Recovery but Insufficient Support Factors
The USD/JPY pair entered a consolidation phase on Tuesday, following modest growth during the earlier two trading sessions. Today, the pair’s movements are centred around the 157.50 mark.
Despite these recovery attempts, the yen remains under pressure, with limited support for a sustained rebound. Comments from Ryozo Himino, Deputy Governor of the Bank of Japan (BoJ), did little to shift market sentiment. Himino indicated that the upcoming BoJ meeting would discuss the possibility of an interest rate hike. However, inflation expectations and price dynamics remain largely unchanged, influenced by both domestic and global risk factors. As a result, many market participants expect that the BoJ will maintain its current policy stance.
Some limited support for the yen has provided a temporary equilibrium, but this has not been sufficient to drive significant gains.
Externally, the US dollar continues to weigh on the yen. Signs of economic resilience in the US have led market participants to adjust their expectations about potential interest rate cuts in 2025. While the prevailing market consensus still points to two or three rate cuts next year, these adjustments are not expected in the near term, reinforcing the dollar’s strength against the yen.
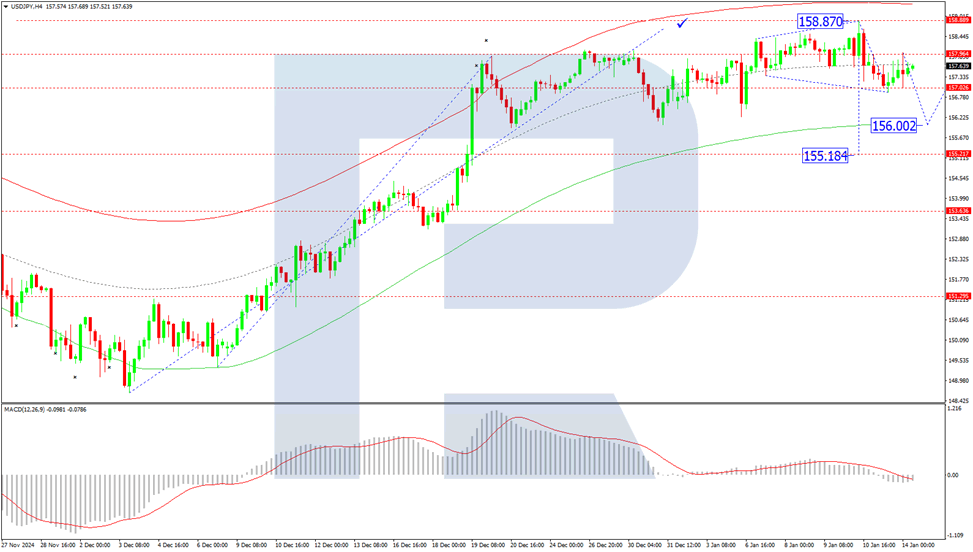
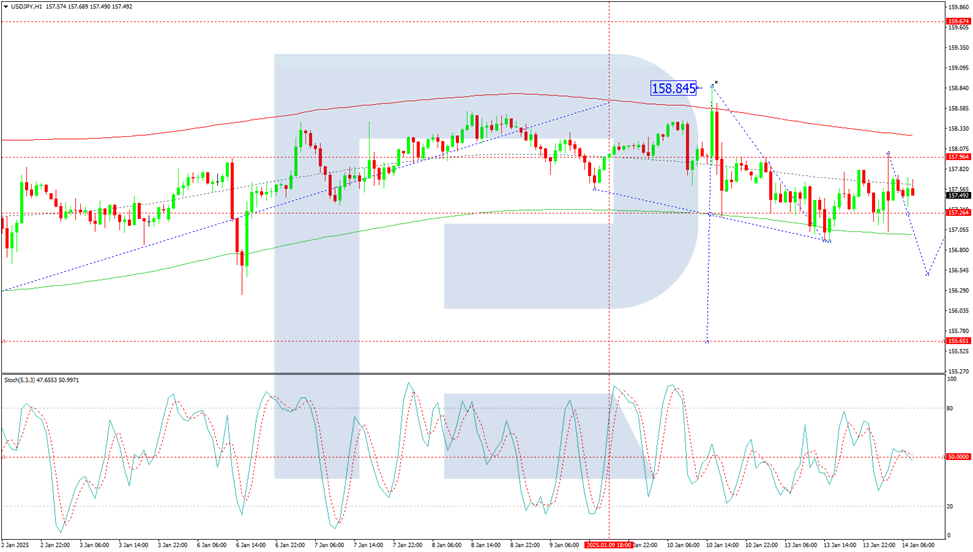
Technical analysis of USD/JPY
On the H4 chart, the USD/JPY pair completed its upward move at the 158.87 level, followed by a downward impulse reaching 156.90. The current outlook suggests a potential upward correction towards 157.90. Should this level be achieved, the market could see a renewed decline towards the 156.00 mark, which is considered a local target. The MACD indicator supports this scenario, with its signal line below zero and decisively downwards.
On the H1 chart, the pair experienced a pullback from the 157.90 level, forming a downward wave. The consolidation range around 157.90 is nearly complete, with expectations of a breakout to the downside, likely to initiate a decline towards the 156.00 level. After reaching this target, a corrective move to 157.25 (as a test from below) is possible. Further downward movement towards 156.66 could follow, marking the primary target. The Stochastic oscillator corroborates this scenario, with its signal line below the 50 level and pointing sharply downwards.
Conclusion
The yen’s recent movements highlight an ongoing struggle to recover amid limited support factors and external pressures from the US dollar. The technical outlook suggests a potential short-term decline in USD/JPY, with key support levels at 156.00 and 156.66. However, the broader trend will depend on upcoming developments from the BoJ and shifts in market sentiment around US monetary policy.
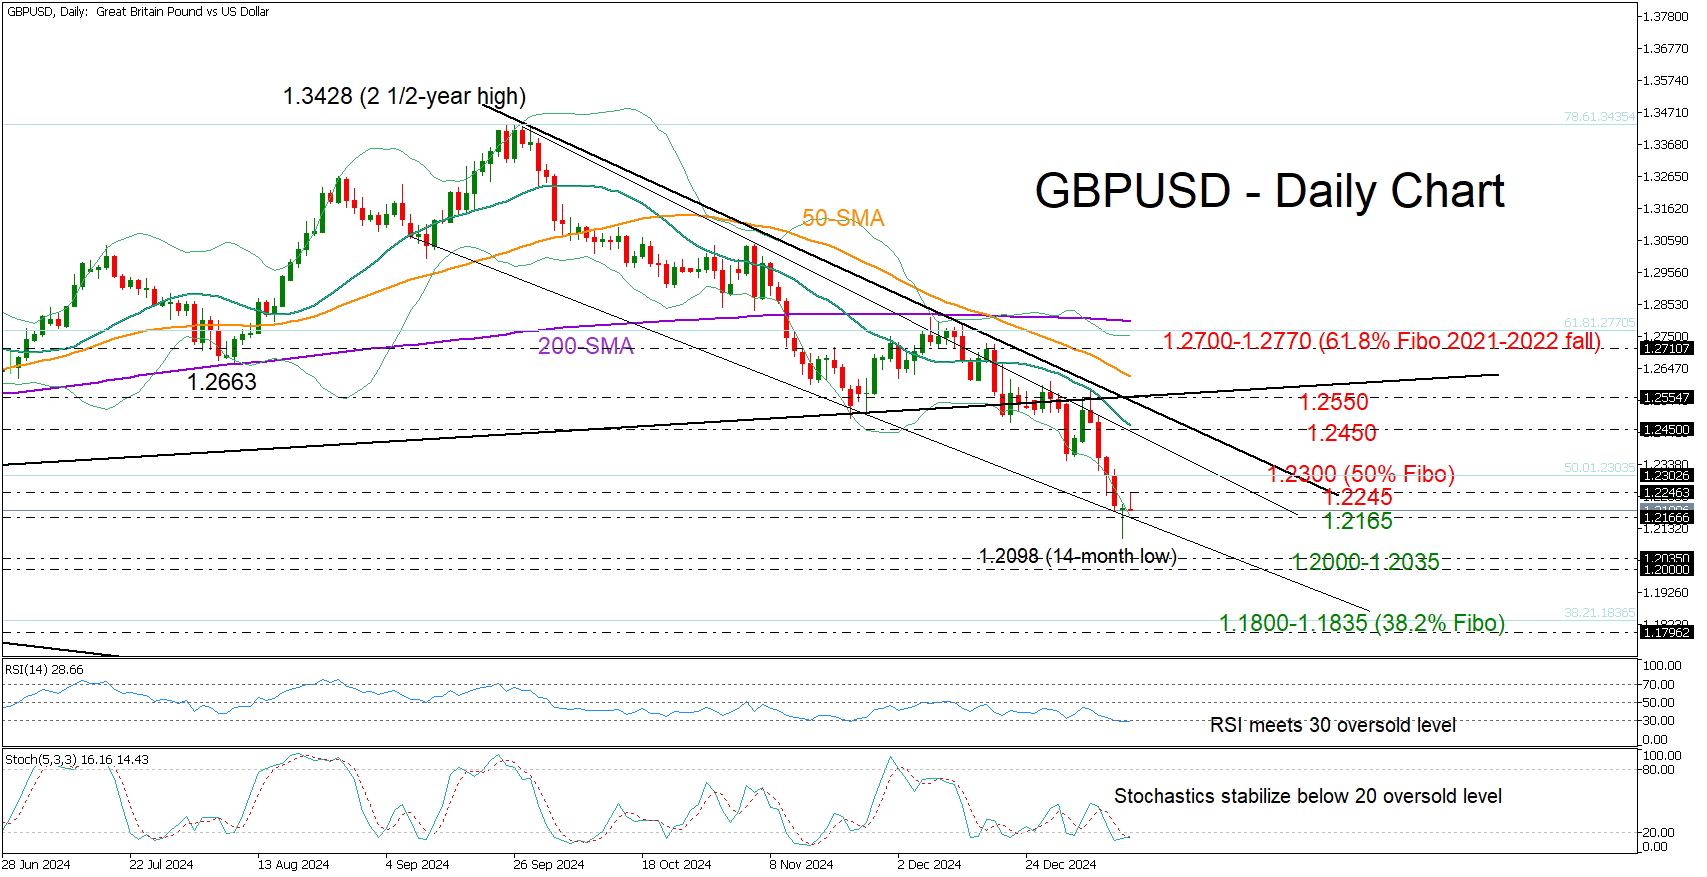
GBP/USD Shows Recovery Signs
- GBP/USD creates bullish candlestick near 1.2100.
- Technical signals reflect weakening selling appetite.
GBP/USD slumped to a 14-month low of 1.2098 on Monday following five devastating weeks, but a hopeful green doji candlestick emerged at the close of the day, signaling that the bears might be losing their grip.
The RSI and the stochastic oscillator are both flatlining near their oversold levels, and the price itself has dipped below the lower Bollinger band. These signs suggest that the recent bearish cycle might have hit a bottom, though traders will likely want confirmation before committing to buying positions.
The 1.2245 level is currently capping bullish momentum, while slightly higher, the 1.2300 number represents the 50% Fibonacci retracement of the sharp 2021-2022 downtrend and could be symbolic. A move above the latter could allow more increases toward the crucial 20-day simple moving average (SMA) at 1.2450, which rejected the bulls twice recently. From there, the bulls could fight for a close above the tentative resistance trendline from September seen at 1.2550. A successful penetration higher could attract new buyers, delivering an acceleration toward the 1.2700 area,if the 50-day SMA gives way as well.
In the opposite case where the price closes below 1.2165, the spotlight will turn again to the 1.2100 level and if this proves easy to breach this time, the bears could target the October 2023 low of 1.2035 and the 1.2000 psychological number. Additional losses from there could target the 38.2% Fibonacci level of 1.1835 or even the 2023 base around 1.1800.
Overall, GBP/USD is showing signs of a potential recovery after its steep fall, particularly if it manages to break above the 1.2235-1.2300 range. For a more sustained upward move and a brighter outlook, the pair would need to establish a solid base above 1.2550, paving the way for a longer-term bullish trend.
Brent Oil Price Retreats from a 3-Month High
On January 6, while analysing the XBR/USD chart, we:
→ constructed an upward structure using blue trend lines;
→ highlighted the potential for a pullback after the formation of peaks A and B around the $76.20 level.
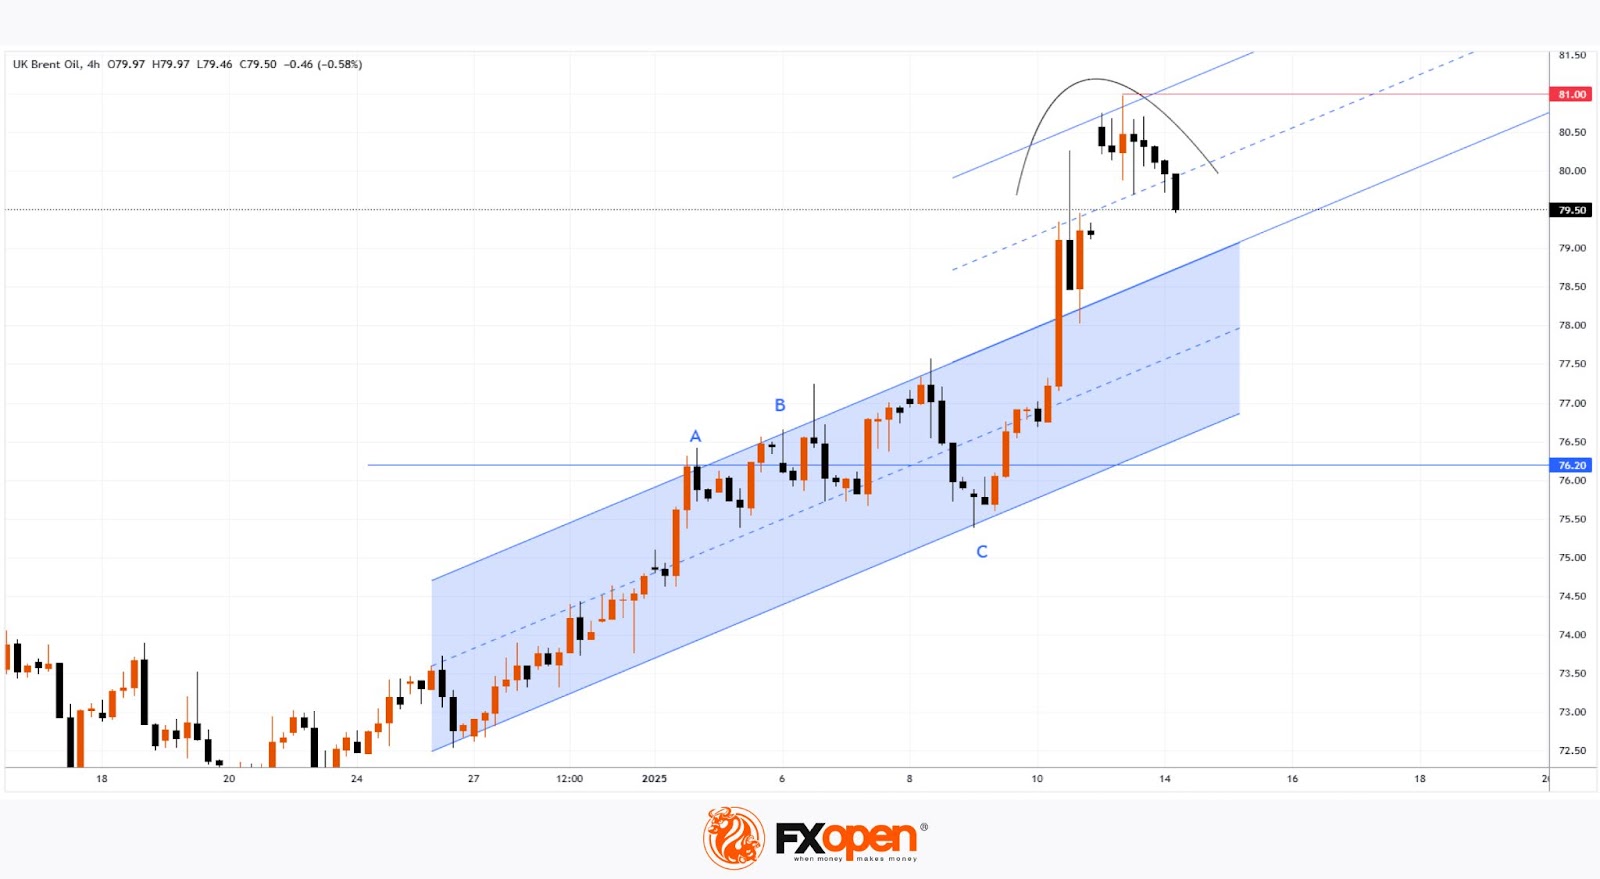
What happened next?
As shown on the XBR/USD chart, Brent oil prices retreated on January 8 to the lower blue line (point C), where bulls successfully resumed the uptrend, pushing the price close to $81—a level last seen in early October 2024, near a key peak (not shown on the chart).
According to The Wall Street Journal:
→ Demand was supported by sanctions imposed by the outgoing Biden administration on Russia’s oil industry.
→ Jonathan Ng, an OCBC Asean economist, noted that the price range of $78–83 appears to be a “relatively comfortable zone” for Brent oil in the near term.
From a technical analysis perspective, the XBR/USD chart displays price action resembling a rounding top pattern. Therefore, it’s possible that after the bullish momentum triggered by the sanctions, another pullback towards the blue channel could occur in the short term.
Going forward, much will depend on the political and trade policies adopted by the incoming Trump administration.
Start trading commodity CFDs with tight spreads. Open your trading account now or learn more about trading commodity CFDs with FXOpen.
This article represents the opinion of the Companies operating under the FXOpen brand only. It is not to be construed as an offer, solicitation, or recommendation with respect to products and services provided by the Companies operating under the FXOpen brand, nor is it to be considered financial advice.
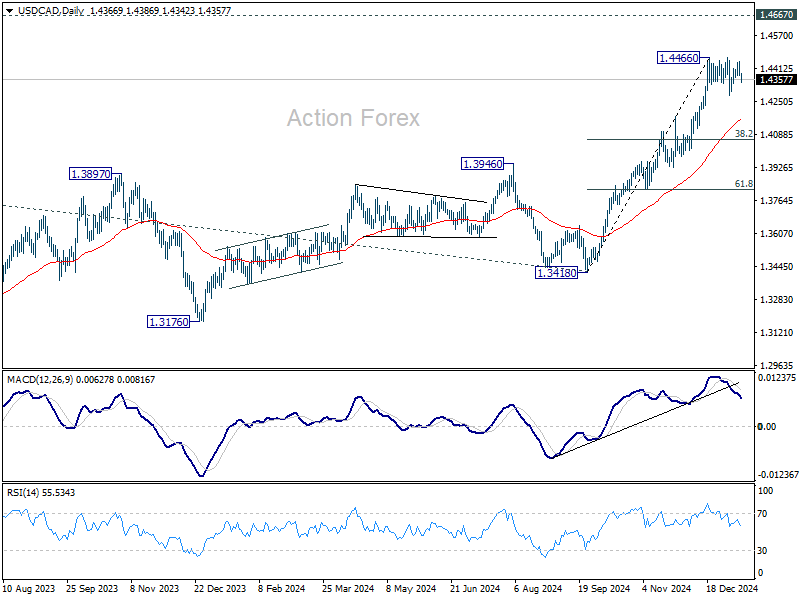
USD/CAD Daily Outlook
Daily Pivots: (S1) 1.4354; (P) 1.4401; (R1) 1.4425; More...
USD/CAD dips ahead of 1.4466 resistance as consolidations pattern from there extends. Intraday bias remains neutral first. Break of 1.4279 support will bring further correction. But downside should be contained by 55 D EMA (now at 1.4166) to bring rebound. On the upside, break of 1.4466 will resume larger up trend to 1.4667/89 long term resistance zone.
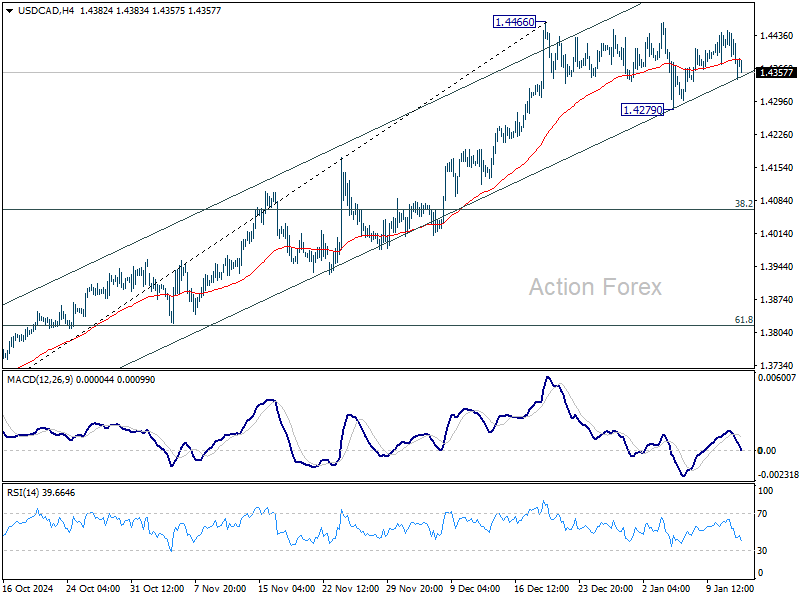
In the bigger picture, up trend from 1.2005 (2021) is in progress for retesting 1.4667/89 key resistance zone (2020/2015 highs). Medium term outlook will remain bullish as long as 1.3976 resistance turned holds (2022 high), even in case of deep pullback.
Tariff Rumors Shake Markets Again, Dollar Retreats Ahead of PPI
Speculation surrounding the incoming US administration's tariff strategy continues to rattle global markets. Reports suggest that President-elect Donald Trump’s economic team is exploring a phased approach to tariffs, gradually increasing rates by 2% to 5% per month. This tactic, if adopted, would utilize executive powers under the International Emergency Economic Powers Act to maximize negotiation leverage while reducing immediate inflation risks. However, the proposal is still in its infancy and has not yet even reached Trump for approval, leaving markets to grapple with the uncertainty.
The potential for a measured tariff escalation has brought mixed reactions across asset classes. US equities displayed divergence overnight, with DOW rallying on diminished fears of abrupt trade disruptions. In contrast, NASDAQ underperformed, partly as investors rotated out of tech-heavy growth stocks. Meanwhile, Asian markets presented a fragmented picture—Hong Kong and China posted robust gains, buoyed by optimism surrounding trade resilience, while Japan’s Nikkei suffered steep losses.
In the currency markets, Dollar is taking a breather as it consolidates recent gains. The greenback has been the weakest performer of the week so far, as traders await critical US economic data, including today’s PPI and tomorrow’s CPI. Sterling remains under significant pressure, ranked as the second weakest currency, weighed down by ongoing fiscal concerns in the UK. The Swiss Franc is close behind as third worst.
Conversely, commodity-linked currencies are leading the charge. Kiwi is the top performer, benefiting from improved risk sentiment, followed by Aussie and Loonie. Yen and Euro are mixed in middle positions.
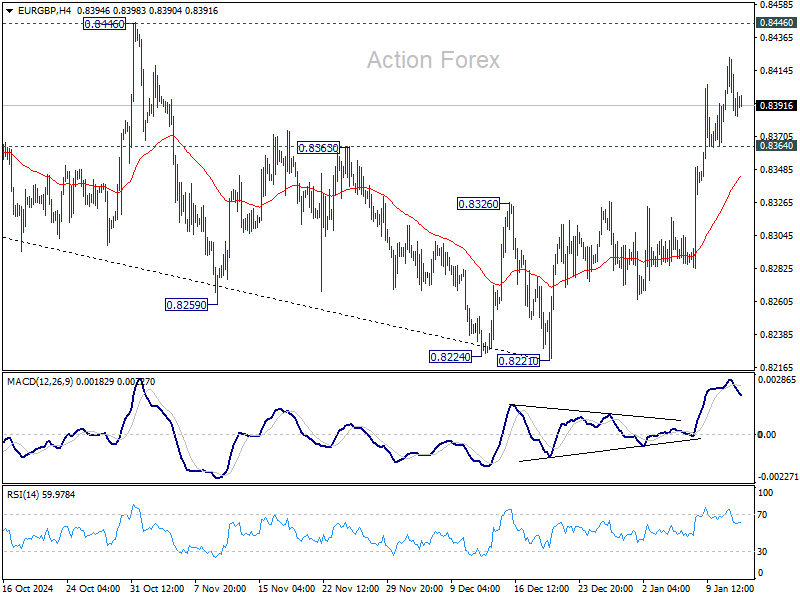
Technically, EUR/GBP is worth some attention in the coming days. Rebound from 0.8221 is starting to lose momentum ahead of 0.8446 near term resistance, as seen in 4H MACD. Break of 0.8364 minor support will indicate short term toping and bias deeper pull back. Such a development could hint at stabilization in sentiment following the recent fiscal "mini-crisis". The relative medium term strength of Sterling against Euro would remain intact after near term jitters.
BoJ’s Himino signals rate hike possible in upcoming meeting
In remarks today, BoJ Deputy Governor Ryozo Himino signaled that a rate hike remains a tangible possibility at the upcoming policy meeting. He said the board "will discuss whether to raise interest rates next week, base its decision on thee projections detailed in the quarterly outlook report.
Himino stated, “When the appropriate timing comes, we must shift policy without delay, as the effect of monetary policy is said to show up with a lag of one to one-and-a-half years.”
The Deputy Governor clarified that BoJ does not rely on a predefined "checklist" for rate decisions. Instead, the board intends to thoroughly analyze the economic outlook and inflation expectations to determine the next steps.
Australian Westpac consumer sentiment dips again, RBA easing unlikely before May
Australia’s Westpac Consumer Sentiment fell -0.7% mom in January, settling at 92.1, reflecting a second consecutive decline. However, Westpac noted a divergence within the data: current conditions sub-indexes weakened, while forward-looking measures were flat or showed slight gains.
RBA faces a mixed picture as it prepares for its next policy meeting on February 17–18. While the central bank appears increasingly confident about bringing inflation back within its 2–3% target range, labor market “stopped easing” in the latter half of 2024 and subdued consumer surveys highlighted “mixed signals”.
According to Westpac, RBA is likely to keep interest rates unchanged in February, with an easing cycle more probable to commence in May.
USD/CAD Daily Outlook
Daily Pivots: (S1) 1.4354; (P) 1.4401; (R1) 1.4425; More...
USD/CAD dips ahead of 1.4466 resistance as consolidations pattern from there extends. Intraday bias remains neutral first. Break of 1.4279 support will bring further correction. But downside should be contained by 55 D EMA (now at 1.4166) to bring rebound. On the upside, break of 1.4466 will resume larger up trend to 1.4667/89 long term resistance zone.
In the bigger picture, up trend from 1.2005 (2021) is in progress for retesting 1.4667/89 key resistance zone (2020/2015 highs). Medium term outlook will remain bullish as long as 1.3976 resistance turned holds (2022 high), even in case of deep pullback.
BoJ’s Himino signals rate hike possible in upcoming meeting
In remarks today, BoJ Deputy Governor Ryozo Himino signaled that a rate hike remains a tangible possibility at the upcoming policy meeting. He said the board "will discuss whether to raise interest rates next week, base its decision on thee projections detailed in the quarterly outlook report.
Himino stated, “When the appropriate timing comes, we must shift policy without delay, as the effect of monetary policy is said to show up with a lag of one to one-and-a-half years.”
The Deputy Governor clarified that BoJ does not rely on a predefined "checklist" for rate decisions. Instead, the board intends to thoroughly analyze the economic outlook and inflation expectations to determine the next steps.
Australian Westpac consumer sentiment dips again, RBA easing unlikely before May
Australia’s Westpac Consumer Sentiment fell -0.7% mom in January, settling at 92.1, reflecting a second consecutive decline. However, Westpac noted a divergence within the data: current conditions sub-indexes weakened, while forward-looking measures were flat or showed slight gains.
RBA faces a mixed picture as it prepares for its next policy meeting on February 17–18. While the central bank appears increasingly confident about bringing inflation back within its 2–3% target range, labor market "stopped easing" in the latter half of 2024 and subdued consumer surveys highlighted "mixed signals".
According to Westpac, RBA is likely to keep interest rates unchanged in February, with an easing cycle more probable to commence in May.