
Sample Category Title
Sunset Market Commentary
Markets
Yesterday’s Bloomberg story brought some relief to markets. The news company citing people familiar reported that president-elect Trump’s team is working on a phased introduction of import tariffs. Raising levies 2%-5% each month instead of everything all at once reduces its shock effect both on US inflation and exporting areas, including the EU. The article shouldn’t be taken by face value though. A previous report by the Washington Post about a targeted tariff approach on a product level was quickly rebuffed by the present-to-be. Lacking such denial for the time being, however, and helped somewhat by lower-than-expected US PPIs, that eased the upward pressure on (US) bond yields, Euro area stocks rise about 1%, Wall Street between 0.4-0.9%. Producer prices were flat to +0.2% higher in December, depending on the gauge. This compared to a consensus estimate varying between +0.3-0.4%. With tomorrow’s more important consumer price inflation on the agenda, it triggered a kneejerk reaction lower in short-term US bond yields. Net daily changes vary between -1.4 (2-yr) to +1.4 bps (30-yr). European yields overcame morning weakness to trade slightly higher in a bear steepener. Long-end underperformance remains the name of the game since the short end is more or less locked in. A reasonable 100 bps of additional ECB easing is discounted. Swap yields add up to 5 bps. Maturities from 10-yr on hit new multi-month highs. The beginning-of-the-year bond market taps continue to be in high demand. A dual tranche European offering consisting of a new €6bn 3-yr benchmark and a €5bn Oct2054 tap attracted a combined €170bn. Books for Greece’s €4bn 10-yr syndicated sale ran above $40bn. Oil prices fluctuated near their 5-month highs (Brent +$80 per barrel) amid cease fire talks between Israel and Hamas reported to be in their final stages. Currency markets trade mixed with sterling the noticeable underperformer. Chancellor Reeves sought to reassure markets by repeating a pledge to stick by her own fiscal rules “at all times”. GBP investors send the currency nevertheless lower against the euro (EUR/GBP >0.84) and the dollar (GBP/USD 1.215, on track for its lowest close since October 2023). EUR/USD trades around the recent lows of 1.025.
News & Views
Inflation in Hungary accelerated more than expected in December, surpassing the upper limit of its 3.0% +/- 1.0% MNB tolerance band. Price rose 0.5% M/M and 4.6% Y/Y, up from 3.7% in November. The rise was mainly due to higher prices for food (0.4% M/M), gas and electricity (1.7% M/M) and durable goods (0.6% M/M). Services prices stay elevated at 0.4% M/M and 6.8% Y/Y. The National Bank of Hungary’s core inflation measures all rose on a Y/Y year basis compared to November to between 4.7% and 5.4%. The NMB in its December inflation update indicated that inflation could rise to 4.6% Y/Y in January. With this level already reached in December, the risk is the hoped-for 2025 disinflation process will start from a higher level. The MNB in December also raised its 2025 inflation estimate to 3.3%-4.1% before returning sustainably to 3.0% in 2026. The MNB since end-September kept the policy rate unchanged at 6.50%. Current inflation data and the still-weak forint suggests that there is no room to restart easing anytime soon. The 2-y swap adds 5.0 bps (6.67%) and the 10-y also moves further north (+6.0 bps at 7.16%). The forint gains modestly from the EUR/HUF 413 area to currently 411.9, but this is rather due to global sentiment.
The National Federation of Independent Business (NFIB) sentiment indicator among small US business improved further in December. The index rose 3.4 points to 105.1 after already having jumped at the fastest pace on record in November. It’s the highest reading since October 2018. “Optimism on Main Street continues to grow with the improved economic outlook following the election,” NFIB Chief Economist Bill Dunkelberg was quoted. “Small business owners feel more certain and hopeful about the economic agenda of the new administration. Expectations for economic growth, lower inflation, and positive business conditions have increased in anticipation of pro-business policies and legislation in the new year.” Of the 10 index components, seven increased. The uncertainty index declined substantially for the second consecutive month. Amongst others, the net percent of owners expecting the economy to improve rose 16 points to a net 52%, the highest since Q4 of 1983. Both the percentage of owners expecting higher real sales to rise and believing it is a good time to expand business rose to the highest level since early 2020. 20% reports inflation is their single most import problem, unchanged from November.
EUR/USD Mid-Day Outlook
Daily Pivots: (S1) 1.0198; (P) 1.0224; (R1) 1.0270; More...
EUR/USD is staying in consolidations above 1.0176 temporary low and intraday bias stays neutral for now. While stronger recovery cannot be ruled out, outlook will stay bearish as long as 1.0435 resistance holds. On the downside, break of 1.0176 will resume the fall from 1.1213 and target 61.8% projection of 1.1213 to 1.0330 from 1.0629 at 1.0083.
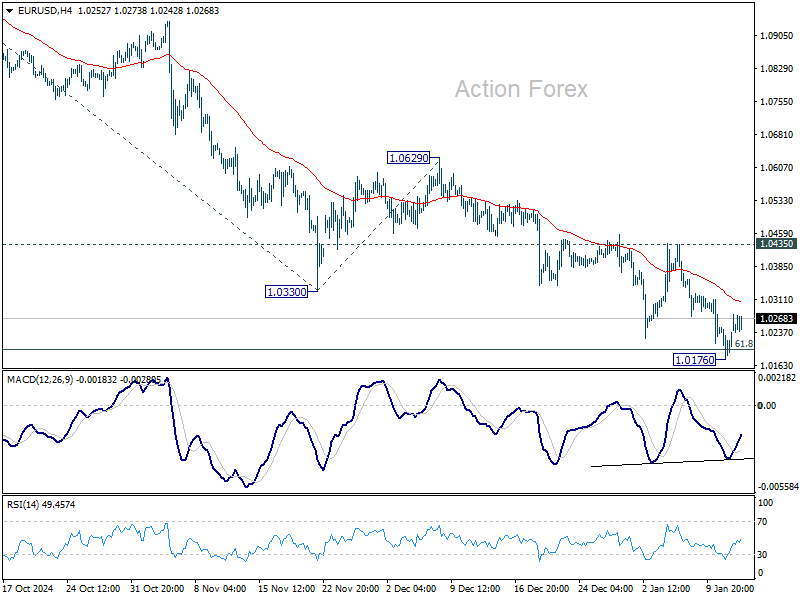
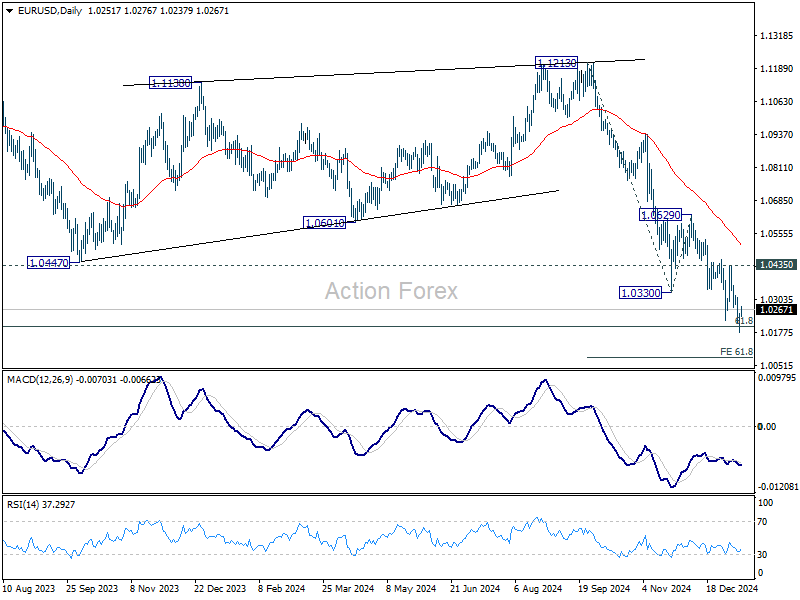
In the bigger picture, fall from 1.1274 (2023 high) should either be the second leg of the corrective pattern from 0.9534 (2022 low), or another down leg of the long term down trend. In both cases, sustained break of 61.8 retracement of 0.9534 to 1.1274 at 1.0199 will pave the way back to 0.9534. For now, outlook will stay bearish as long as 1.0629 resistance holds, even in case of strong rebound.
USD/CHF Mid-Day Outlook
Daily Pivots: (S1) 0.9150; (P) 0.9176; (R1) 0.9196; More…
Intraday bias in USD/CHF remains neutral for the moment. More consolidations could be seen and deeper pullback cannot be ruled out. But near term outlook will stay bullish as long as 0.9007 support holds, in case of deep retreat. On the upside, decisive break of 0.9223 will carry larger bullish implications.
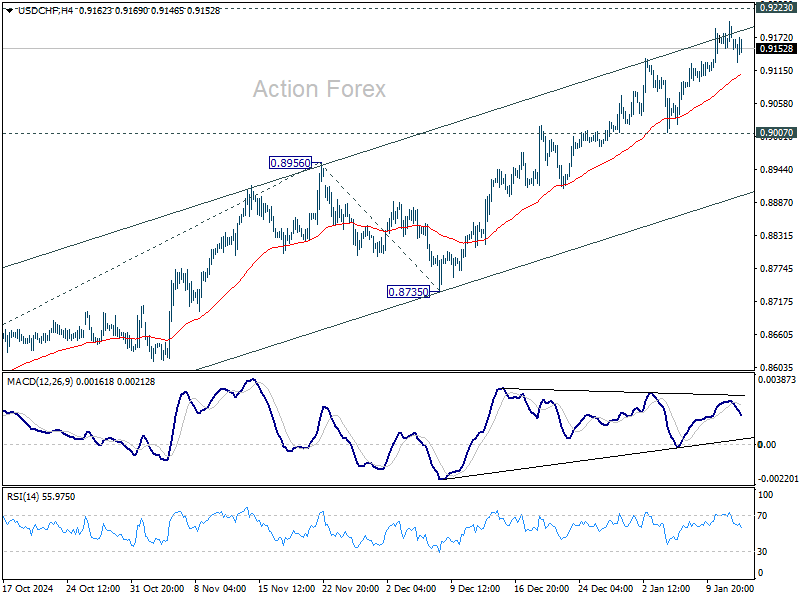
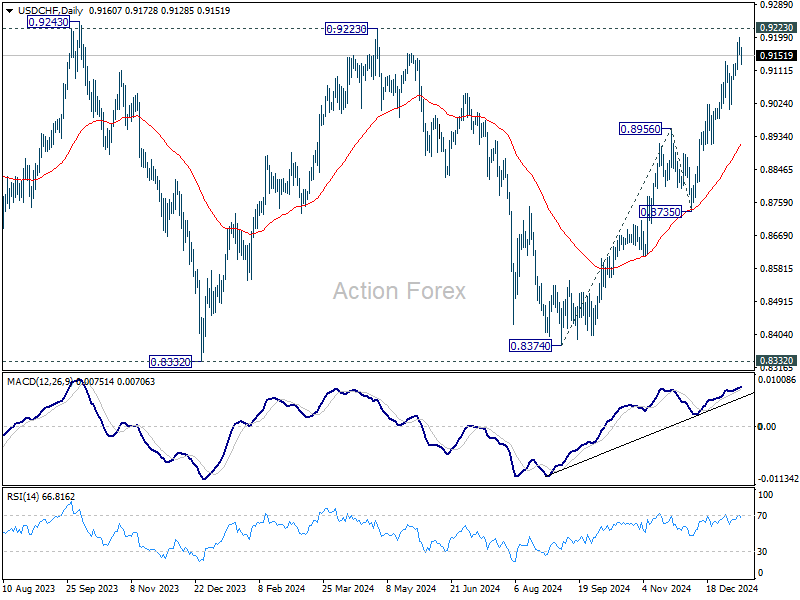
In the bigger picture, price actions from 0.8332 (2023 low) are currently seen as a medium term corrective pattern, with rise from 0.8374 as the third leg. Overall outlook will continue to stay bearish as long as 0.9223 resistance holds. Break of 0.8332 low is in favor at a later stage when the consolidation completes. However, decisive break of 0.9223 will be an important sign of bullish trend reversal.
USD/JPY Mid-Day Outlook
Daily Pivots: (S1) 156.94; (P) 157.46; (R1) 157.99; More...
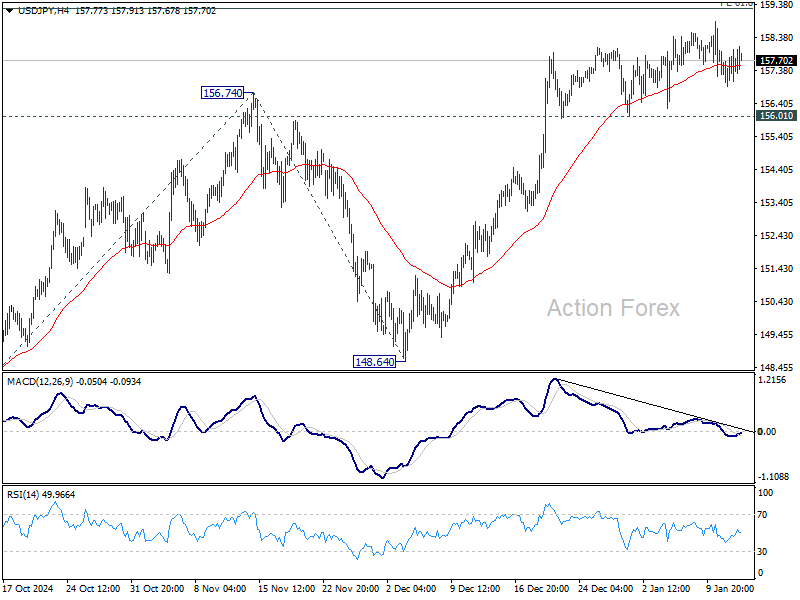
No change in USD/JPY's outlook as sideway trading continues. Intraday bias remains neutral for now. Further rally is in favor as long as 156.0 support holds. On the upside, decisive break of 61.8% projection of 139.57 to 156.74 from 148.64 at 159.25 will extend the rally from 139.57 to retest 161.94 high. However, considering bearish divergence condition in 4H MACD, firm break of 156.01 support will indicate short term topping. Intraday bias will then be back on the downside for 55 D EMA (now at 154.37) instead.
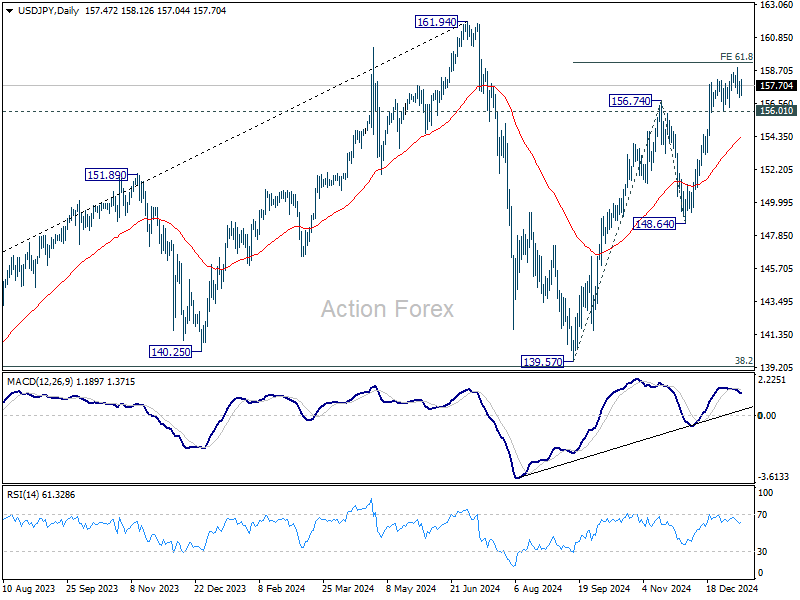
In the bigger picture, price actions from 161.94 are seen as a corrective pattern to rise from 102.58 (2021 low). The range of medium term consolidation should be set between 38.2% retracement of 102.58 to 161.94 at 139.26 and 161.94. Nevertheless, sustained break of 139.26 would open up deeper medium term decline to 61.8% retracement at 125.25.
US: Small Business Optimism Index Rose to Six-Year High in December as Uncertainty Subsided
The NFIB's Small Business Optimism Index rose 3.4 points to 105.1 in December, beating market expectations for a mild decline. The uncertainty subindex continued to retreat, falling another 12 points in December to 86.
Seven out of ten main subcomponents improved on the month, two fell and one remained unchanged. The largest increase was in the share of owners expecting the economy to improve, which rose 16 points to 52% – the highest level since 2002. Notable gains were also recorded in the share of owners believing that now is a good time to expand (up 6 points to 20%) and expectations about higher real sales (up 8 points to 22%).
The net share of businesses planning to increase employment rose 1 point to 19%, reaching its highest level since spring 2023. The share of firms with unfilled job openings fell one point to 35%. Quality of labor concerns held steady, with 19% of business owners identifying this as their top business problem, second behind inflation concerns. The latter remained unchanged at 20%.
The share of firms increasing employee compensation fell 3 points to 29%, while the share of firms planning to do so over the next three months fell 4 points to 24% – reversing much of the outsized increase in the month prior.
Key Implications
Post-election optimism continues to reverberate across the small business community as uncertainty continues to subside. The improvement is visible in the headline NFIB confidence measure, which rose to its highest level in six years and is echoed across several sub-indicators. For instance, the belief that 'now is a good time to expand', and expectations about 'an improvement in the economy' and 'higher real sales' all surged higher at the tail end of 2024.
As last week's payrolls report showed us, the labor market continues to chug along at a healthy clip, and small businesses appear to echo this theme with plans to increase employment trending up recently. That said, it remains to be seen if this will lead to a major improvement in job growth over the near-term as not all indicators are singing to the same tune. Small business job openings have failed to mimic the improvement in employment plans, instead holding flat at a level that's roughly in line with the pre-pandemic period. Additionally, the fact that compensation trends retreated in December suggests that businesses may not be in a major hurry to fill their open positions.
GBP/USD Mid-Day Outlook
Daily Pivots: (S1) 1.2131; (P) 1.2172; (R1) 1.2244; More...
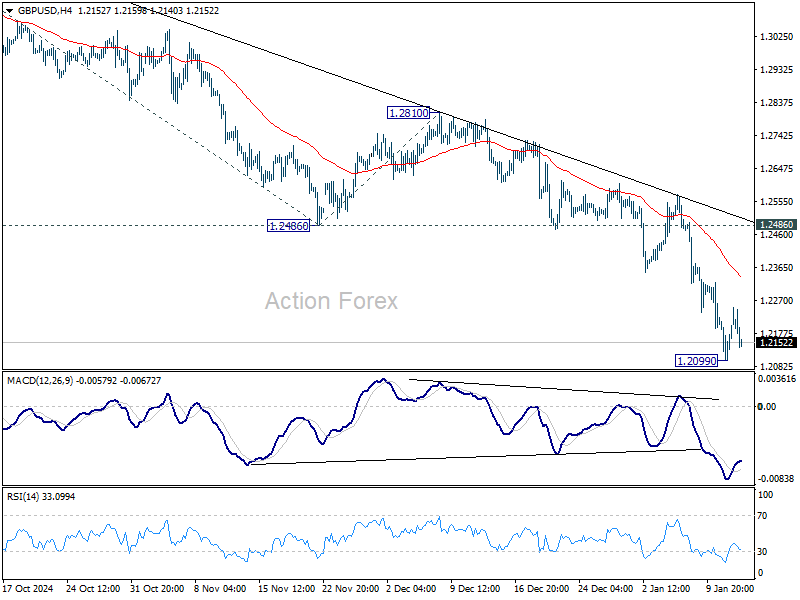
Intraday bias in GBP/USD remains neutral as consolidations continue above 1.2099 temporary low. While stronger recovery cannot be ruled out, outlook will stay bearish as long as 1.2486 support turned resistance holds. Break of 1.2099 will resume the decline from 1.3433 to 100% projection of 1.3433 to 1.2486 from 1.2810 at 1.1863.
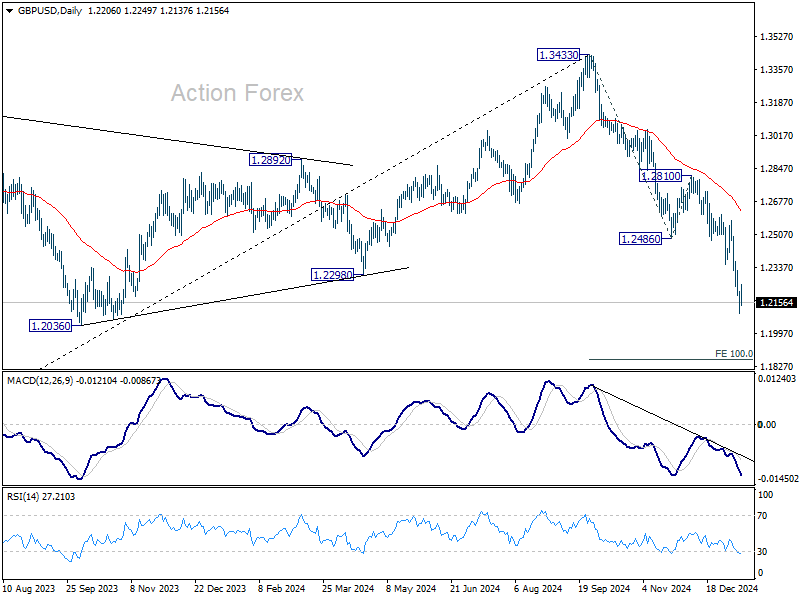
In the bigger picture, rise from 1.0351 (2022 low) should have already completed at 1.3433, and the trend has reversed. Further fall is now expected as long as 1.2810 resistance holds. Deeper decline should be seen to 61.8% retracement of 1.0351 to 1.3433 at 1.1528, even as a corrective move.
Greenback Holds Ground After Slight PPI Miss, Sterling Weakens Again as Gilt Yields Eye 5%
Dollar is holding steady against its peers in early U.S. trading, with softer-than-expected PPI report failing to trigger significant selling pressure. Market sentiment continues to shift toward the possibility that the Fed might refrain from additional rate cuts in 2025. Fed funds futures are currently pricing in less than 60% probability of a 25bps rate reduction in the first half of the year.
Attention now turns to Tuesday’s U.S. Consumer Price Index (CPI) data, which is anticipated to be a more significant indicator of inflationary trends and policy direction. Currently, the market expects a significant interest rate differential of 200-300 basis points between Fed and ECB by the terminal point of the currency easing cycle. Should domestic inflationary pressures in the US show any signs of resurgence, this differential could skew further toward the higher end of the range, solidifying Dollar strength.
Meanwhile, the Pound continues to bear the brunt of market concerns over the UK's fiscal health. The relentless selloff in UK government bonds drove 10-year Gilt yield to above 4.9%, with a break above 5% psychological barrier appearing increasingly imminent. Such a move could intensify the downward pressure on Sterling, which is already grappling with domestic economic challenges. The UK is bracing for a pivotal week, with CPI data scheduled for Wednesday and GDP figures following on Thursday. These releases could determine whether the Pound can stabilize or face further deterioration.
On the weekly leaderboard, Sterling is the worst performer so far, followed by Yen and Dollar. Kiwi leads the pack with Aussie and Loonie close behind. Euro and Swiss Franc remain in middle positions.
In Europe, at the time of writing, FTSE is down -0.13%. DAX is up 0.83%. CAC is up 0.86%. UK 10-year yield is down -0.004 at 4.887. Germany 10-year yield is up 0022 at 2.617. Earlier in Asia, Nikkei fell -1.83%. Hong Kong HSI rose 1.83%. China Shanghai SSE rose 2.54%. Singapore Strait Times fell -0.08%. Japan 10-year JGB yield rose 0.0319 to 1.244.
US PPI rises 0.2% mom, 3.3% yoy in Dec, miss expectations
US producer prices rose modestly in December, with PPI for final demand increasing by 0.2% mom, falling short of market expectations of 0.3%. The gain was driven primarily by 0.6% mom increase in goods prices, which included a sharp 3.5% rise in energy costs.
In contrast, prices for services remained flat. Excluding the more volatile components of food and energy, core PPI was unchanged for the month, missing the anticipated 0.2% mom increase.
On an annual basis, headline PPI edged higher from 3.0% to 3.3% yoy, narrowly below the forecast of 3.4% yoy. Core PPI, excluding food and energy, rose from 3.4% to 3.5% yoy, also underwhelming expectations of 3.8% yoy.
BoJ’s Himino signals rate hike possible in upcoming meeting
In remarks today, BoJ Deputy Governor Ryozo Himino signaled that a rate hike remains a tangible possibility at the upcoming policy meeting. He said the board "will discuss whether to raise interest rates next week, base its decision on thee projections detailed in the quarterly outlook report.
Himino stated, “When the appropriate timing comes, we must shift policy without delay, as the effect of monetary policy is said to show up with a lag of one to one-and-a-half years.”
The Deputy Governor clarified that BoJ does not rely on a predefined "checklist" for rate decisions. Instead, the board intends to thoroughly analyze the economic outlook and inflation expectations to determine the next steps.
Australian Westpac consumer sentiment dips again, RBA easing unlikely before May
Australia’s Westpac Consumer Sentiment fell -0.7% mom in January, settling at 92.1, reflecting a second consecutive decline. However, Westpac noted a divergence within the data: current conditions sub-indexes weakened, while forward-looking measures were flat or showed slight gains.
RBA faces a mixed picture as it prepares for its next policy meeting on February 17–18. While the central bank appears increasingly confident about bringing inflation back within its 2–3% target range, labor market “stopped easing” in the latter half of 2024 and subdued consumer surveys highlighted “mixed signals”.
According to Westpac, RBA is likely to keep interest rates unchanged in February, with an easing cycle more probable to commence in May.
GBP/USD Mid-Day Outlook
Daily Pivots: (S1) 1.2131; (P) 1.2172; (R1) 1.2244; More...
Intraday bias in GBP/USD remains neutral as consolidations continue above 1.2099 temporary low. While stronger recovery cannot be ruled out, outlook will stay bearish as long as 1.2486 support turned resistance holds. Break of 1.2099 will resume the decline from 1.3433 to 100% projection of 1.3433 to 1.2486 from 1.2810 at 1.1863.
In the bigger picture, rise from 1.0351 (2022 low) should have already completed at 1.3433, and the trend has reversed. Further fall is now expected as long as 1.2810 resistance holds. Deeper decline should be seen to 61.8% retracement of 1.0351 to 1.3433 at 1.1528, even as a corrective move.
US PPI rises 0.2% mom, 3.3% yoy in Dec, miss expectations
US producer prices rose modestly in December, with PPI for final demand increasing by 0.2% mom, falling short of market expectations of 0.3%. The gain was driven primarily by 0.6% mom increase in goods prices, which included a sharp 3.5% rise in energy costs.
In contrast, prices for services remained flat. Excluding the more volatile components of food and energy, core PPI was unchanged for the month, missing the anticipated 0.2% mom increase.
On an annual basis, headline PPI edged higher from 3.0% to 3.3% yoy, narrowly below the forecast of 3.4% yoy. Core PPI, excluding food and energy, rose from 3.4% to 3.5% yoy, also underwhelming expectations of 3.8% yoy.
US Inflation: PPI, CPI Release Dates, DXY Analysis & Market Impact
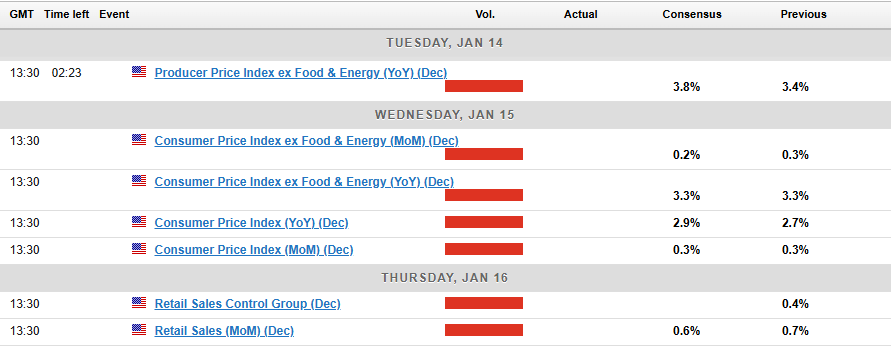
- The US Dollar Index (DXY) is awaiting US inflation data (PPI and CPI), with PPI data releasing on Tuesday, January 14, and CPI on Wednesday, January 15.
- Tariff rumors from the Trump team have caused a pause in the US Dollar’s rise.
- Key support for the DXY is at 109.57, with resistance at 110.00; a break above 110.00 could signal a move towards 111.00.
The US Dollar Index (DXY) has retreated from the psychological 110.00 handle as markets await the US inflation report due on Wednesday. Later today however, markets will get a glimpse of producer price inflation data which could set the tone for the growing 2025 inflation conundrum.
Currency Strength Chart: Strongest – NZD, AUD, CHF, EUR, GBP, CAD, JPY, USD – Weakest
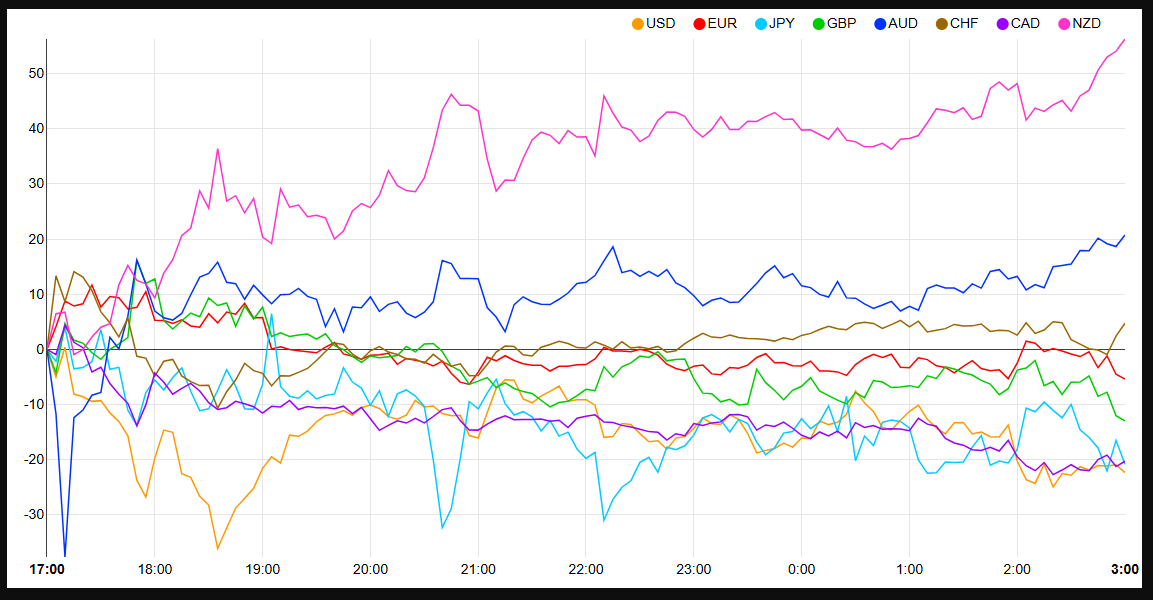
Source: FinancialJuice (click to enlarge)
‘Incremental Tariff Chatter’ Leads to US Dollar Pause
The US Dollar started the week on the offensive following blockbuster payroll data on Friday. However, late in the US session rumors began to swirl that the Trump team is assessing gradual tariffs to combat the potential rise in inflation.
On Monday evening, Bloomberg reported citing sources that Donald Trump’s top economic advisers are considering slowly increasing tariffs to strengthen their negotiating position and avoid sudden inflation. A proposal being discussed involves raising tariffs by 2%-5% each month using emergency powers.
The advisers involved include Scott Bessent, nominated for Treasury Secretary, Kevin Hassett, expected to lead the National Economic Council, and Stephen Miran, chosen to head the Council of Economic Advisers. The plan has not yet been presented to Trump, showing that the idea is still in its early stages.
The news was enough however to lead a brief recovery in US stocks and lead the US Dollar Index (DXY) away from the psychological 110.00 handle.
Tariff concerns continue to support the US Dollar as fears mount around the impact it will have on US inflation. Such a move, if confirmed by incoming President Trump could pave the way for a slightly weaker US Dollar in the short-term.
When are the US PPI and CPI Data releases?
This week will no doubt be dominated by the US PPI and CPI data releases for the month of December.
The PPI data will be released at 13h30 (GMT Time) on Tuesday, January 14 with the CPI following at the same time on Wednesday, January 15.
PPI and CPI Data in Focus
Following the US jobs report it is critical that today’s PPI data does not show significant signs of an uptick in price pressures. Increasing PPI data usually precedes a jump in consumer price inflation (CPI).
An increase prior to the impacts of potential Tariffs could send the US Dollar marching higher.
I do expect headline PPI data to come out in line with estimates but a slight uptick in core PPI (MoM) from 0.2% to 0.3% for the month of December.
Looking toward Wednesday’s CPI release, I could see a slightly milder than expected print. Markets are expecting prices to have increased 0.4% MoM but I would not be surprised with a print of 0.3%.
A slightly milder CPI print may provide some resistance to the US Dollar Index rally but this may prove to be short-lived.
There are also a couple of Fed speakers today and tomorrow which could add some extra volatility to markets. Later today we have Fed policymakers John Williams speaking at 20h00 (GMT Time) and Thomas Barkin speaking tomorrow at 13h00 (GMT Time), just before the CPI release.
Technical Analysis
US Dollar Index (DXY)
The US Dollar index daily chart has run into a key area around the 110.00 psychological level.
Yesterday tariff news coicided with a tap into the 110.00 which was met by some selling pressure and potential profit taking which also contributed to the indexes slide.
The daily candle closed as a shooting star candle which hints at further downside. We have seen a brief attempt to push lower today met by buying pressure which is a sign of the bullish momentum currently in play. This is further backed up the golden cross pattern that is forming as the 100-day MA crosses above the 200-day MA.
For now though, price is resting on support at 109.57 with a break lower likely to bring the ascending trendline into play and support at 108.49.
A move higher here for the DXY and 110.00 needs to be cleared with a daily candle close above the level a sign of acceptance. Should this occur then a run toward the 111.00 handle may be on the cards for the index.
US Dollar Index (DXY) Daily Chart, January 14, 2025
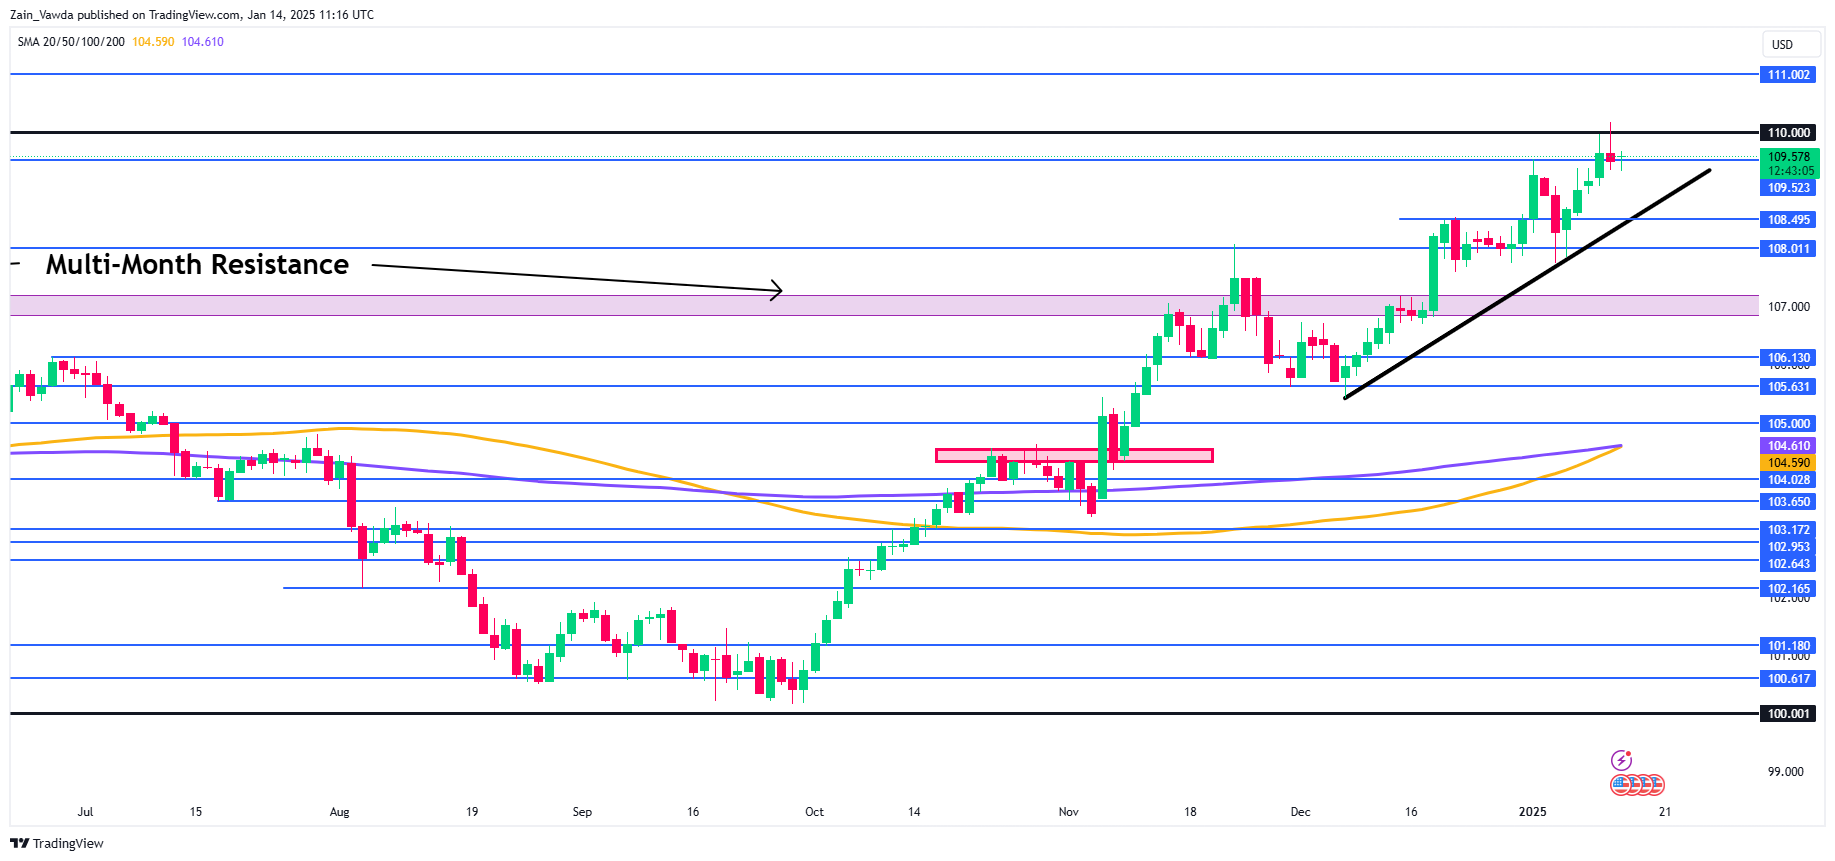
Source: TradingView.com (click to enlarge)
Support
- 109.57
- 108.49
- 108.00
Resistance
- 110.00
- 111.00
- 111.50
Nasdaq 100 Technical: Weak Market Breadth With Tightening Liquidity a Deadly Concoction
- The recent three-week slide in the Nasdaq 100 has almost wiped out its post-US presidential gains.
- The persistent uptrend of the 10-year US Treasury yield has made US equities unattractive and overvalued as measured by the S&P 500 Shiller excess CAPE yield.
- 20,790 remains the key downside trigger level for the Nasdaq 100.
Since our last publication, the Nasdaq 100’s price movements have failed to surpass its current fresh all-time high printed on 16 December 2024 and inched downward to challenge the key medium-term bearish trigger level of 20,790 on last Friday, and Monday, 13 January.
It printed an intraday low of 20,538 before it rebounded and closed at 20,784 at the end of the US session on Monday. The Nasdaq 100 has declined by 6% from its current all-time high level on 16 December last year which almost wiped out close to three-quarters of its ex-post US presidential election gains.
Finally, the bond vigilantes have evoked their “mightiness” on the US stock market where the higher long-term cost of borrowings via the relentless uptrend seen in the 10-year US Treasury yield increased the fear of lesser net profit margins that override the positive aspects of the incoming Trump administration’s deregulation and steep corporate tax cut policies.
Tighter liquidity translates into higher opportunity costs for holding US equities
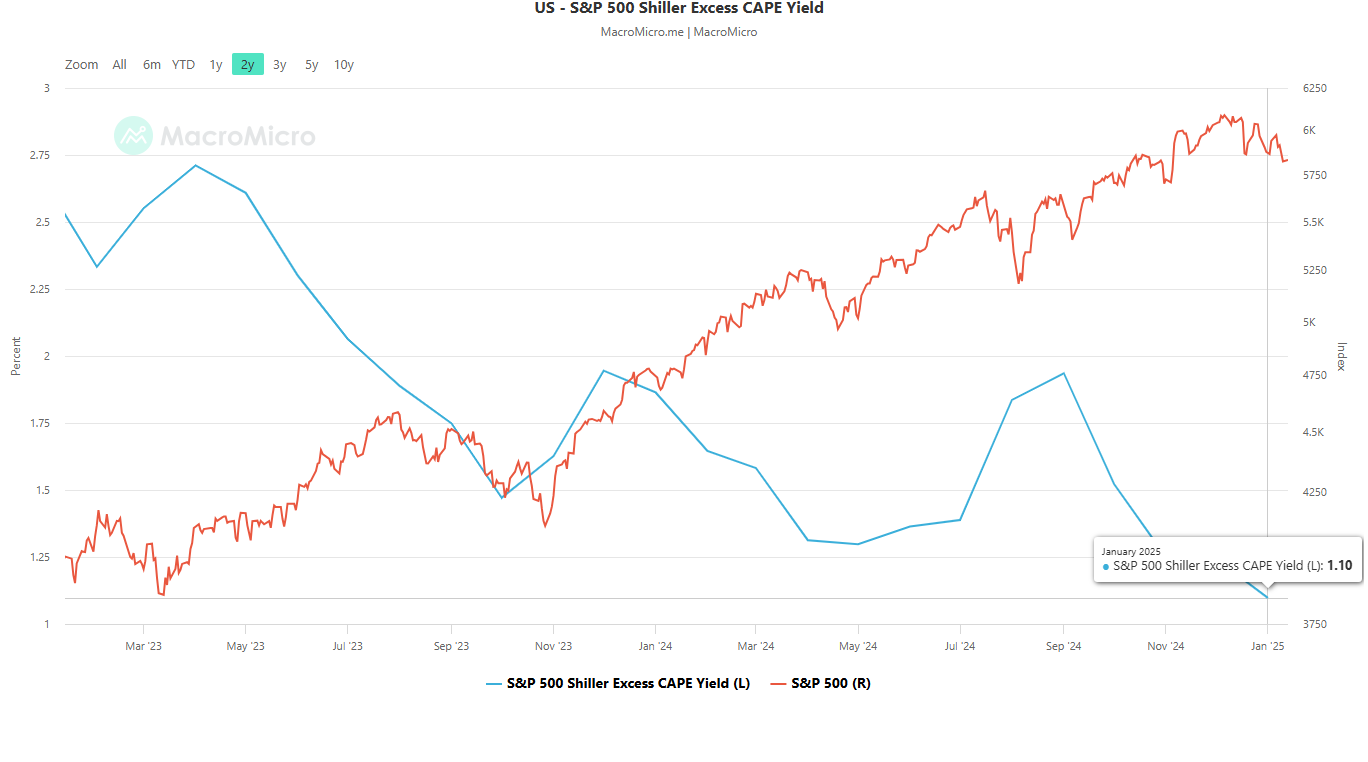
Fig 1: S&P 500 Shiller excess CAPE yield with S&P 500 as of 13 Jan 2025 (Source: MacroMicro, click to enlarge chart)
The S&P 500 Shiller excess CAPE yield is calculated by the S&P real earnings yield (inverse of CAPE) subtracted by the 10-year US Treasury real yield which represents a gauge of the real excess earnings return of the S&P 500 relative to the yield of a long-term US Treasury bond.
The excess CAPE yield has been declining steadily since September last year from 1.94 to a current value of 1.10 in January which implies that the S&P 500 is overpriced versus US Treasury bonds (see Fig 1).
A further decline in the excess CAPE yield is likely to make it harder to justify investing in risk assets such as equities as opportunity costs increase relatively unless growth continues to be a high conviction theme play. Also, a higher 10-year US Treasury yield tends to have a tightening effect on the economy which in turn reflects generally tighter monetary policy and liquidity conditions.
Longer-term market breadth has deteriorated
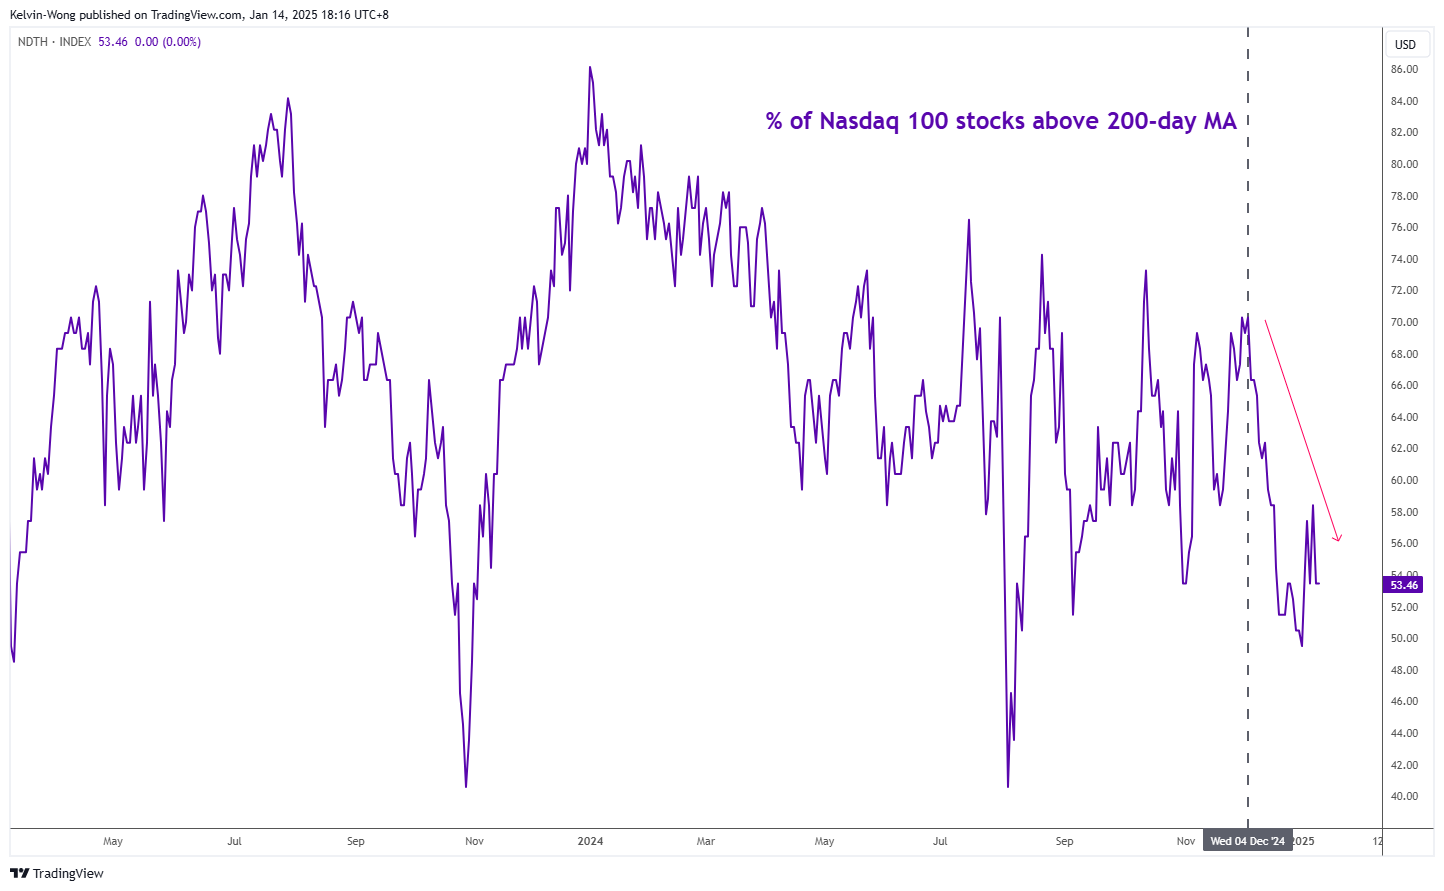
Fig 2: Percentage of Nasdaq 100 component stocks above 200-day moving averages as of 13 Jan 2025 (Source: TradingView, click to enlarge chart)
Right now, the percentage of Nasdaq 100 component stocks trading above their respective key long-term 200-day moving averages has plummeted from its ex-post US presidential election peak of 70% on 4 December 2024 to 53% as of Monday, 13 January (see Fig 2).
This set of weak market breadth indicator of the Nasdaq 100 does not bode well for its major uptrend phase in place since October 2022 as the Nasdaq 100 is still holding above its 200-day moving average since late January 2023 while its internals (component stocks) have weakened in strength.
Bearish medium-term momentum
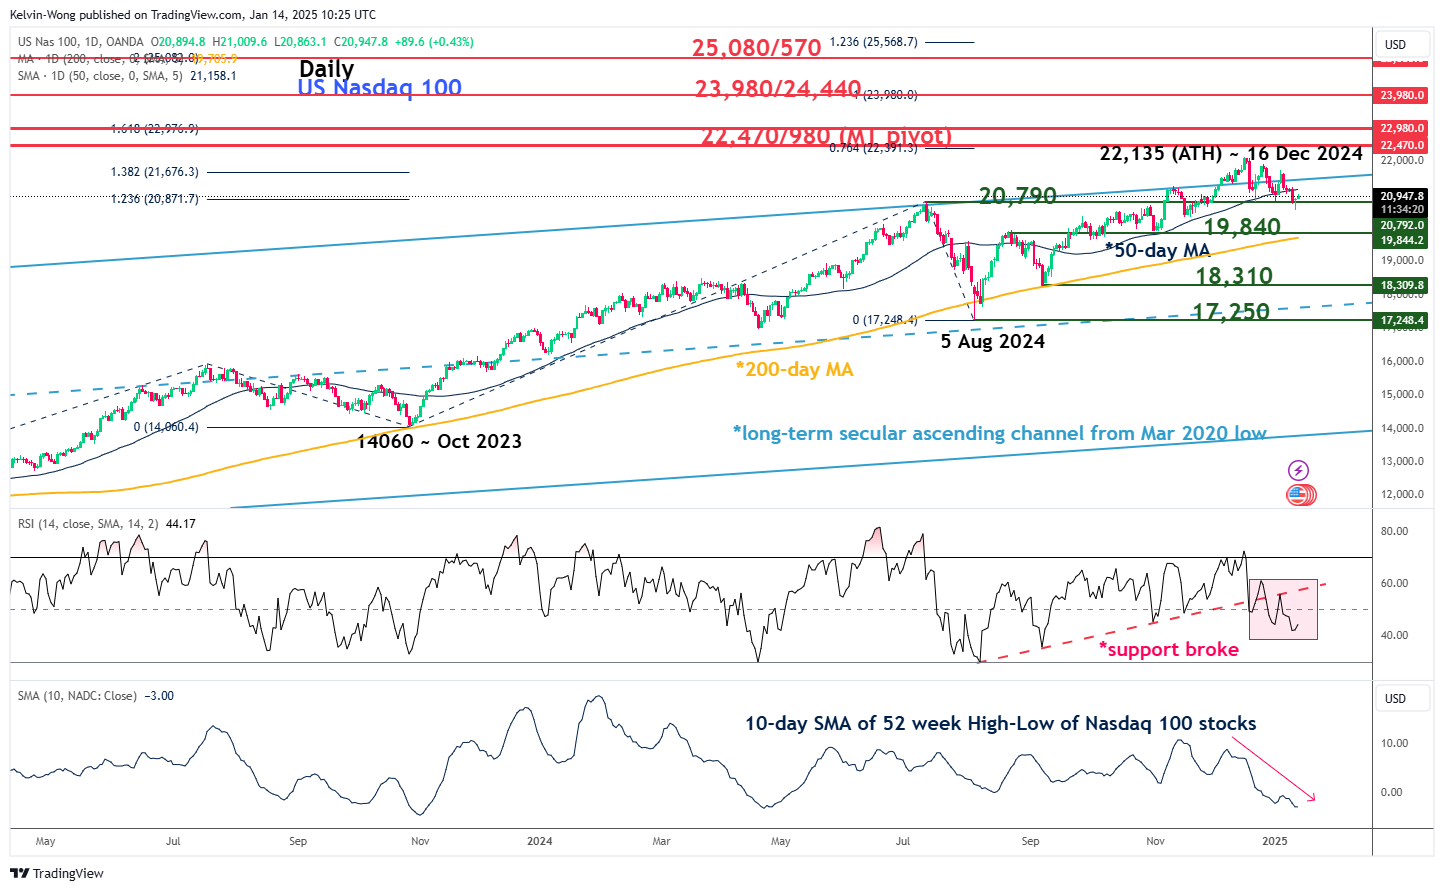
Fig 3: Nasdaq 100 CFD major & medium-term trends as of 14 Jan 2025 (Source: TradingView, click to enlarge chart)
Since 24 December 2024, the daily RSI momentum indicator of the Nasdaq 100 CFD Index (a proxy of Nasdaq 100 E-mini futures) has continued to shape a series of “lower highs and lower lows” and has not reached its oversold region.
This observation suggests medium-term bearish momentum remains intact. Watch the key 20,790 intermediate support, and a daily close below it may trigger a multi-week corrective decline sequence to expose the medium-term supports of 19,840 and 18,310 in the first step (see Fig 3).
However, clearance above the 22,470/980 medium-term pivotal resistance zone invalidates the bearish scenario for the continuation of its impulsive upmove sequence for the next medium-term resistances to come in at 23,980/24,440 and 25,080/570.