Sample Category Title
Optimism Out of the Window?
The bond selloff continues. The US 2-year yield on Monday spiked to 4.42% - the highest level since July – before easing, the US 10-year yield hit 4.80% for the first time in more than a year before easing. As such, the bond yields in the US on average returned to their pre-subprime crisis levels and bond world’s heavyweights expect the 10-year yield to reach the 5% mark sooner rather than later. In Europe, the German 10-year yield advanced to the highest levels since summer and the French 10-year yield spiked past 3.45%. In Japan, the Japanese 10-year yield jumped to 1.25% - a level that hasn’t been seen since 2011.
The global bond selloff is fueled by concerns over soaring debt levels leading to political turmoil and uncertainty in developed economies. This is compounded by major central banks' struggles to bring inflation down to their 2% target, amid various economic and political developments that could trigger a reversal in consumer prices worldwide. Consequently, the yields are rising and the expectations of further rate cuts from some major central banks are melting putting equities under pressure. The S&P500 plunged below the 100-DMA yesterday to the level it ended on November 5th just before Donald Trump’s nomination as the next US president. The selloff below the 100-DMA attracted some dip buying and led to a meagre 0.16% gain at the end of the session, but the Trump gains are now fully wiped away. Nasdaq 100 extended losses below the 50-DMA and is aiming to test the 100-DMA to the downside as well. The Dow Jones, however, is better bid near the levels it was trading when Trump got elected, supported by a rally in energy stocks on the back of rising energy prices and a rebound in financial stocks ahead of the upcoming bank earnings announcements. The American mid caps are near the Trump election levels while the small caps are already below. In Europe, the Stoxx 600 dived below its 50-DMA, while the FTSE 100 slid despite a rise in energy and bank stocks.
Are optimistic market bets already out of the window?
For the stock market rally to broaden beyond the tech companies and beyond the US, the yields must come down and let the lower borrowing costs benefit to more cyclical and non-tech pockets of the market. But the yields’ positive direction today puts that forecast at risk. If yields continue to climb and remain high, the rally is unlikely to extend beyond the tech sector, and even within tech, it could falter due to already high valuations. Magnificent 7 companies can not afford bad press at the current levels, but the news on the wire weren’t great yesterday. ‘Information’ reported that Nvidia’s customers face delays in getting their chips and have even cut some orders. The stock fell 2% yesterday. Apple’s iPhone sales dropped 5% globally this year, the Chinese rivals increase their market share, the AI applications are not coming fast enough and the upcoming trade war between the US – and the rest of the world – is not painting a rosy picture for the iPhone maker. Apple shares traded below the 50-DMA for the second day and tipped a toe below the 100-DMA yesterday.
Data sensitivity to rise
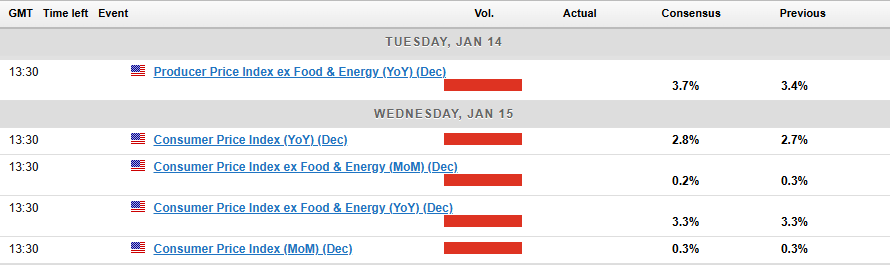
Markets’ sensitivity to major economic data will likely rise as policy uncertainties mount and appetite weakens. Due today, the US will release its latest PPI numbers, and the headline PPI may have risen from 3% to 3.4% in December and core PPI is seen rising from 3.4% to 3.7% during the same month. Rising price pressures are not good news for the Federal Reserve (Fed) doves. Stronger-than-expected inflation figures could further accelerate the US treasury selloff and support the US dollar.
The EURUSD remains under a decent selling pressure below the 1.03 mark, while Cable is in a freefall mode on another round of appetite loss in the government’s fiscal plans and amid rising bets for a further selloff. Positions in the options market suggest that some investors are betting that sterling could slip to 1.12 level against the US dollar if Rachel Reeves can’t restore confidence rapidly.
This being said, there is an increasing amount of triggers for the contrarians to join the game, slow and eventually reverse the dollar rally. Hedge funds, for example, have increased their bullish US dollar positions to the highest levels since 2019. Meanwhile, net speculative shorts in the euro appear stretched. Therefore, we could see some major currencies regain field against the dollar. But the data will say the last word for price moves.
US December PPI Sets Stage for CPI Tomorrow
In focus today
From the US, the December PPI data will provide markets with an early sense of what to expect when the key December CPI is released tomorrow afternoon. We will also keep an eye on the NFIB's December small business optimism index after a notable uptick in November following the election results. In the evening, Kansas City Fed's Schmid (voter) and NY Fed's Williams (voter) will be on the wires.
In Sweden, Riksbank Governor Aino Bunge is participating in a seminar at the Stockholm Chamber of Commerce where she will discuss the outlook for the Swedish and Global economies. There may be the odd snippet of monetary policy discussions as well.
Economic and market news
What happened overnight
In Sweden, the house price data from this morning reveals that the Swedish housing market concluded 2024 with decreasing prices in December, showing -1.1% m/m for condominiums and -0.8% for houses. However, for the full year 2024, we saw an uptick of 5.9% and 5.0% y/y, respectively, fully in line with our in-house housing indicator.
Progress in Gaza ceasefire talks: Negotiations for a ceasefire in Gaza have taken a step forward as outgoing US president Biden said that parties were on the brink of reaching an agreement (see Reuters). While the deal would include the release of 33 hostages and phased withdrawal of Israeli troops, it reportedly still lacks concrete plan for the future governance of Gaza.
FX top trades 2025: This morning, we published our annual FX Top Trades for 2025, in which we discuss both tactical and strategic drivers of currency markets with 8 trade ideas.
What happened yesterday
The continuous rise in bond yields slowed down yesterday amid quiet macro data calendar. Looking ahead, we still expect yields to move lower over the coming year in our updated forecasts out yesterday. We anticipate an ECB depo rate of 1.5% by September and a Fed Funds target of 3-3.25% by March 2026. Our 12-month forecast for the 10Y US Treasury yield remains at 4.20%, but we have increased the 10Y Bund target from 2.00% to 2.25%. See Yield Outlook - The Pendulum has swung too far, 13 January.
Equities: Global equities were lower yesterday; however, sentiment improved significantly during the day, with most US indices ending higher. This is a classic example of how a negative reaction to a strong labour market report is typically not a long-lasting response for investors. This is also why we emphasise that the macro data we have received lately from the US has been very positive from an equity perspective, despite equities not having performed particularly well. That said, it is important to note that it was not just cyclicals making a strong comeback yesterday. Some growth stocks, which are sensitive to yields, are attracting increased awareness from investors. In the US yesterday, the Dow rose by 0.9%, the S&P 500 increased by 0.2%, the Nasdaq fell by 0.4%, and the Russell 2000 rose by 0.2%. Most Asian markets are higher this morning, with the exception of Japan. Both European and US futures are higher this morning.
FI: With very little news to trade on, markets yesterday extended the upward move in yields following Friday's super strong NFP figures. The 10Y US Treasury yield rose a couple of basis points, getting closer to the 4.80% mark, which added renewed pressure on risky assets. Long-end EGB yields also edged up with peripherals such as Italy underperforming. In the inflation space, yesterday's US announcement of aggressive sanctions on Russian oil added to the upward trend in energy prices. For the first time since October, Brent closed above 80 USD/barrel.
FX: Yesterday's session was characterised by a slight rally in treasuries, a stabilisation in risk appetite and a further rally in oil. This lead oil FX incl. NOK to be among the outperformers while the USD saw a slight setback with EUR/USD rebounding back to the 1.0250 level on tighter rate spreads. EUR/GBP also edged lower during the US hours while USD/JPY moved sideways. Finally, EUR/SEK moved back above 11.50.
GBP/USD Crashes: Bears Dominate The Market
Key Highlights
- GBP/USD declined heavily below the 1.2350 and 1.2250 support levels.
- A key bearish trend line is forming with resistance at 1.2480 on the 4-hour chart.
- EUR/USD extended losses below the 1.0220 support.
- Gold prices climbed above the $2,650 and $2,660 levels.
GBP/USD Technical Analysis
The British Pound remained in a bearish zone below 1.2500 against the US Dollar. GBP/USD started another decline below the 1.2350 and 1.2250 levels.
Looking at the 4-hour chart, the pair settled below the 1.2200 level, the 100 simple moving average (red, 4-hour), and the 200 simple moving average (green, 4-hour). The pair tested the 1.2100 zone and is currently consolidating losses.
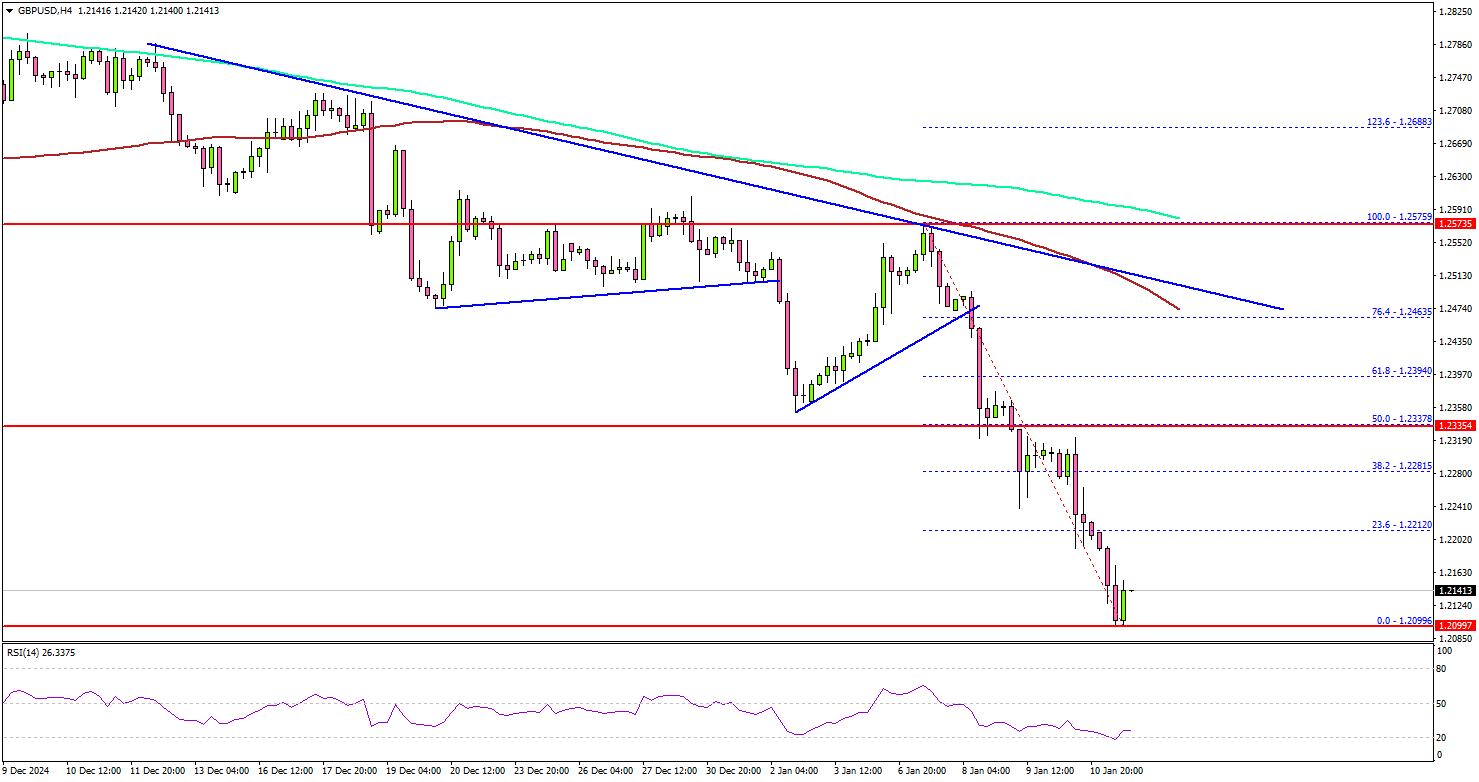
On the upside, the pair is facing hurdles near the 1.2180 level. The first major resistance is near the 1.2210 level. The next major resistance is near the 1.2280 level.
A close above the 1.2280 level could set the tone for another increase. In the stated case, the pair could rise toward the 1.2350 resistance. The main hurdle could be a key bearish trend line with resistance at 1.2480 on the same chart.
On the downside, immediate support sits near the 1.2080 level. The next key support sits near the 1.2050 level. Any more losses could send the pair toward the 1.2000 level.
Looking at EUR/USD, the pair started another decline and the bears were able to push the pair below the 1.0220 support.
Upcoming Economic Events:
- Fed's Schmid speech.
Elliott Wave View: Silver (XAGUSD) Double Three Correction in Progress
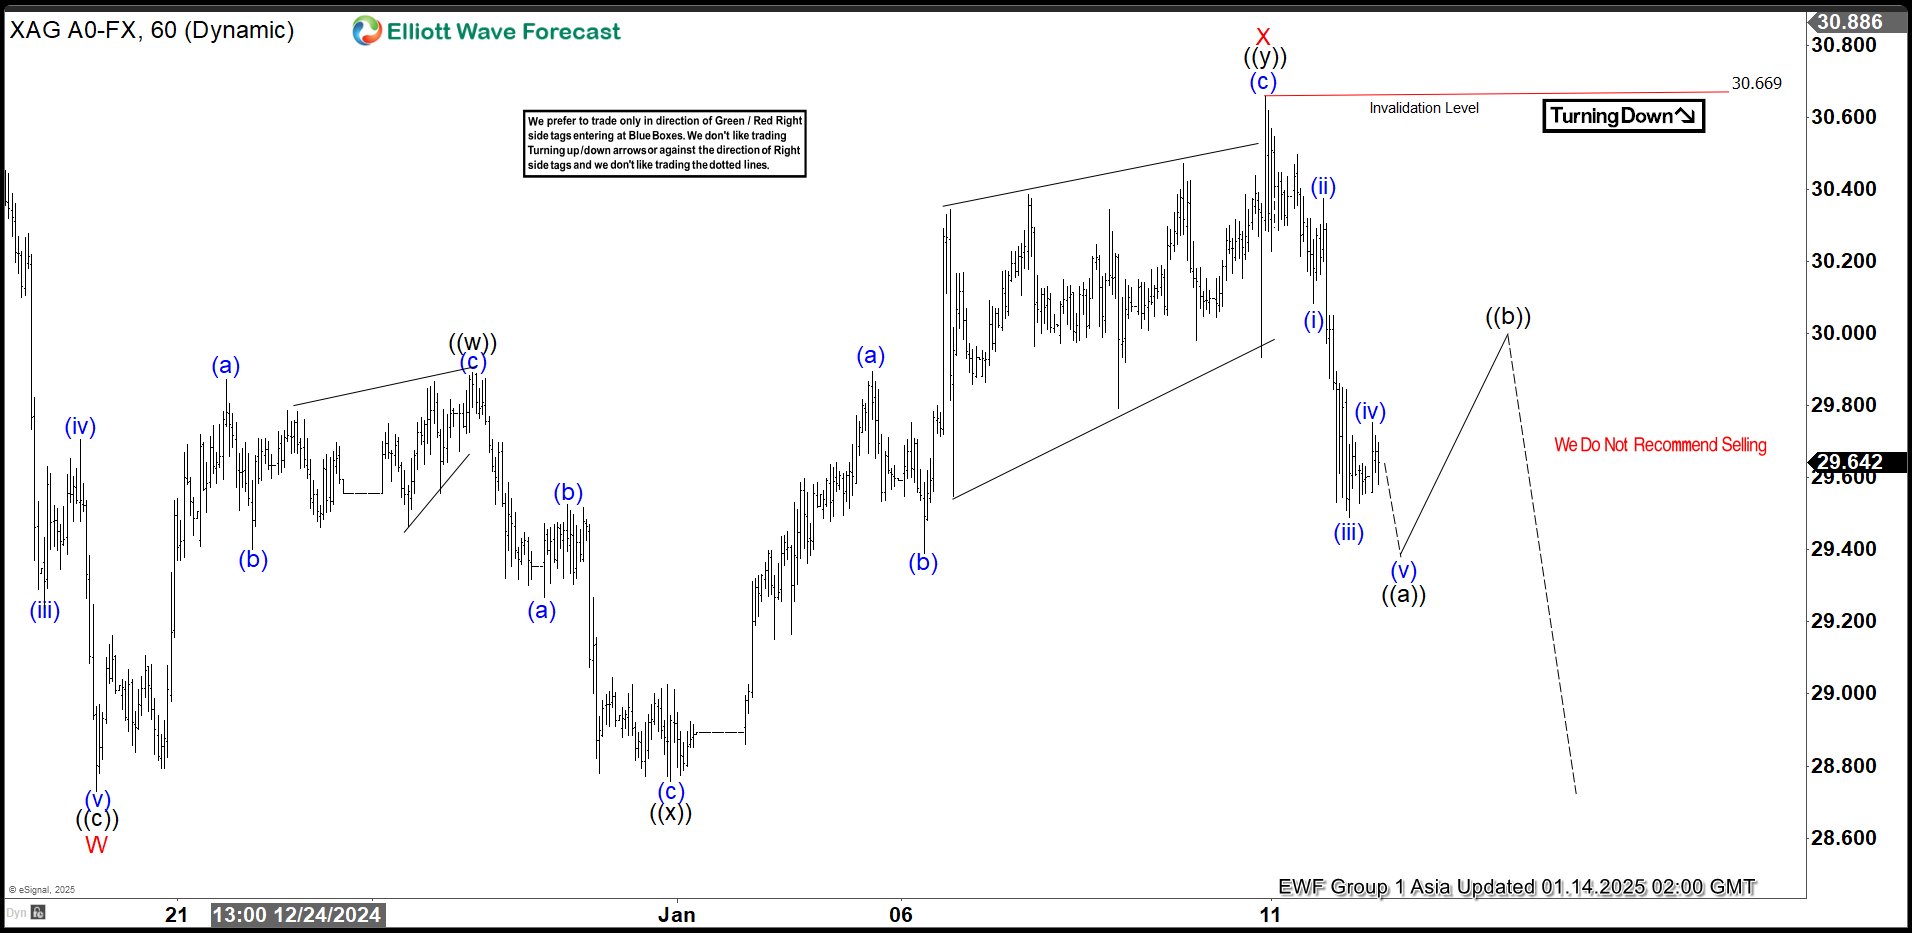
Short Term Elliott Wave view in Silver (XAGUSD) suggests cycle from 10.22.2024 high is in progress as a double three Elliott Wave structure. Down from 10.22.2024 high, wave (W) ended at 29.68 and wave (X) rally ended at 32.32 Wave (Y) lower is in progress and unfolding as another double three Elliott Wave structure in lower degree. Down from wave (Y), wave W ended at 28.73 as the 1 hour chart below shows.
Up from wave W, wave ((w)) ended at 29.88 and wave ((x)) ended at 28.75. Wave ((y)) higher ended at 30.67 which completed wave X in higher degree. The metal has turned lower in wave Y. Down from wave X, wave (i) ended at 30.08 and wave (ii) rally ended at 30.37. Wave (iii) lower ended at 29.49 and wave (iv) rally ended at 29.75. The metal should extend lower in wave (v) to complete wave ((a)). Then it should rally in wave ((b)) to correct cycle from 1.10.2025 high for further downside. Near term, as far as pivot at 30.67 high stays intact, expect rally to fail in 3, 7, 11 swing for further downside.
XAGUSD (Silver) 60 Minutes Elliott Wave Chart
XAGUSD Elliott Wave Video
https://www.youtube.com/watch?v=cwDxHOOoRtU
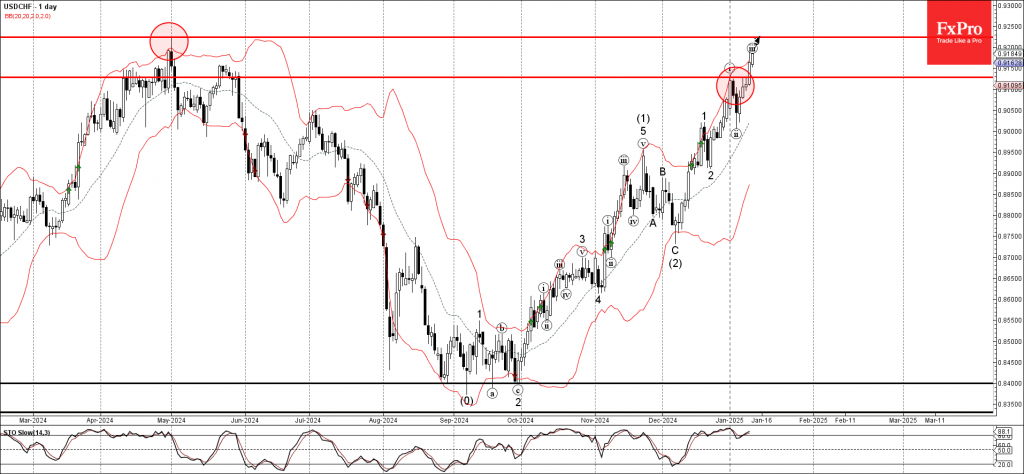
USDCHF Wave Analysis
- USDCHF broke resistance level 0.9130
- Likely to rise to resistance level 0.9225
USDCHF currency pair recently broke the resistance level 0.9130, which stopped the previous impulse wave i at the start of January, as can be seen below.
The breakout of the resistance level 0.9130 accelerated the active impulse wave iii, which belongs to the higher impulse waves 3 and (3).
Given the sharp daily uptrend, strongly bullish US dollar sentiment, USDCHF currency pair can be expected to rise to the next resistance level 0.9225 (former multi-month high from April of 2024 and the target for the completion of the active wave 3).
EURCHF Price Action Breakdown
The USDCHF pair trades around 0.9170, marking its fifth day of gains during Monday's early European session. A stronger US Dollar is supported by better-than-expected US job data for December, which has eased worries about further interest rate cuts from the Federal Reserve. Markets are now waiting for the US Producer Price Index (PPI) report, due Tuesday, for more economic clues.
Meanwhile, geopolitical tensions, including ongoing conflicts in the Middle East, are driving demand for the safe-haven Swiss Franc. Concerns about President-elect Donald Trump's policies are also adding uncertainty, but for now, the stronger US Dollar is supporting the USDCHF pair. Based on this, let's see how the price lines up on the EURCHF charts.
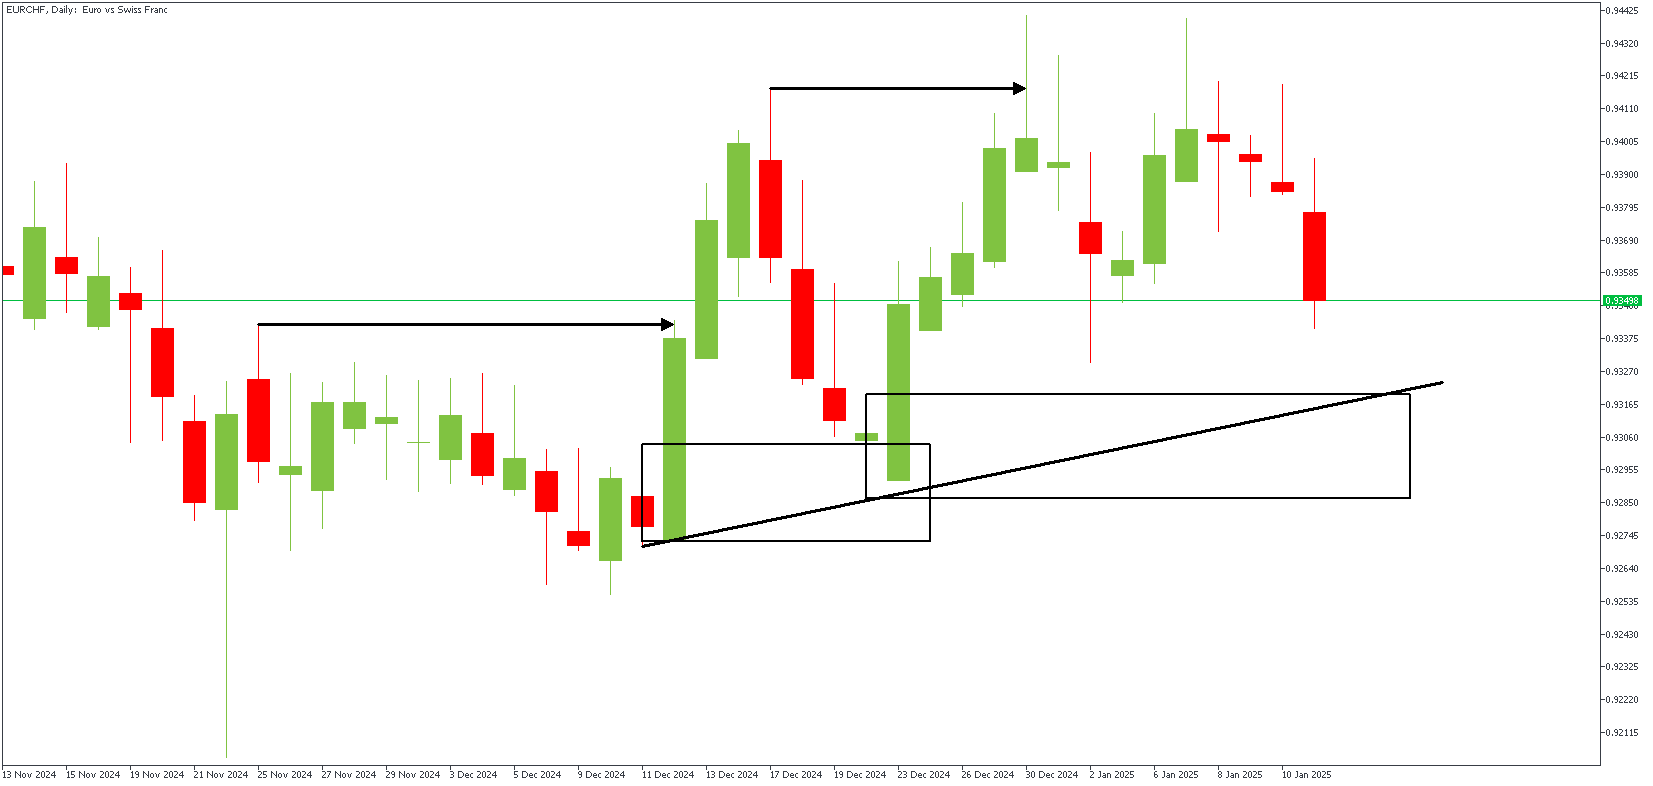
EURCHF – D1 Timeframe
There has been a recent bullish break of structure on the daily timeframe chart of EURCHF as the price broke above the previous high, leaving behind a supply zone and a Fair Value Gap region. From the daily timeframe chart perspective, the price is expected to attempt a retest of the FVG region before continuing bullish. Now, let's see how this looks on the entry timeframe.
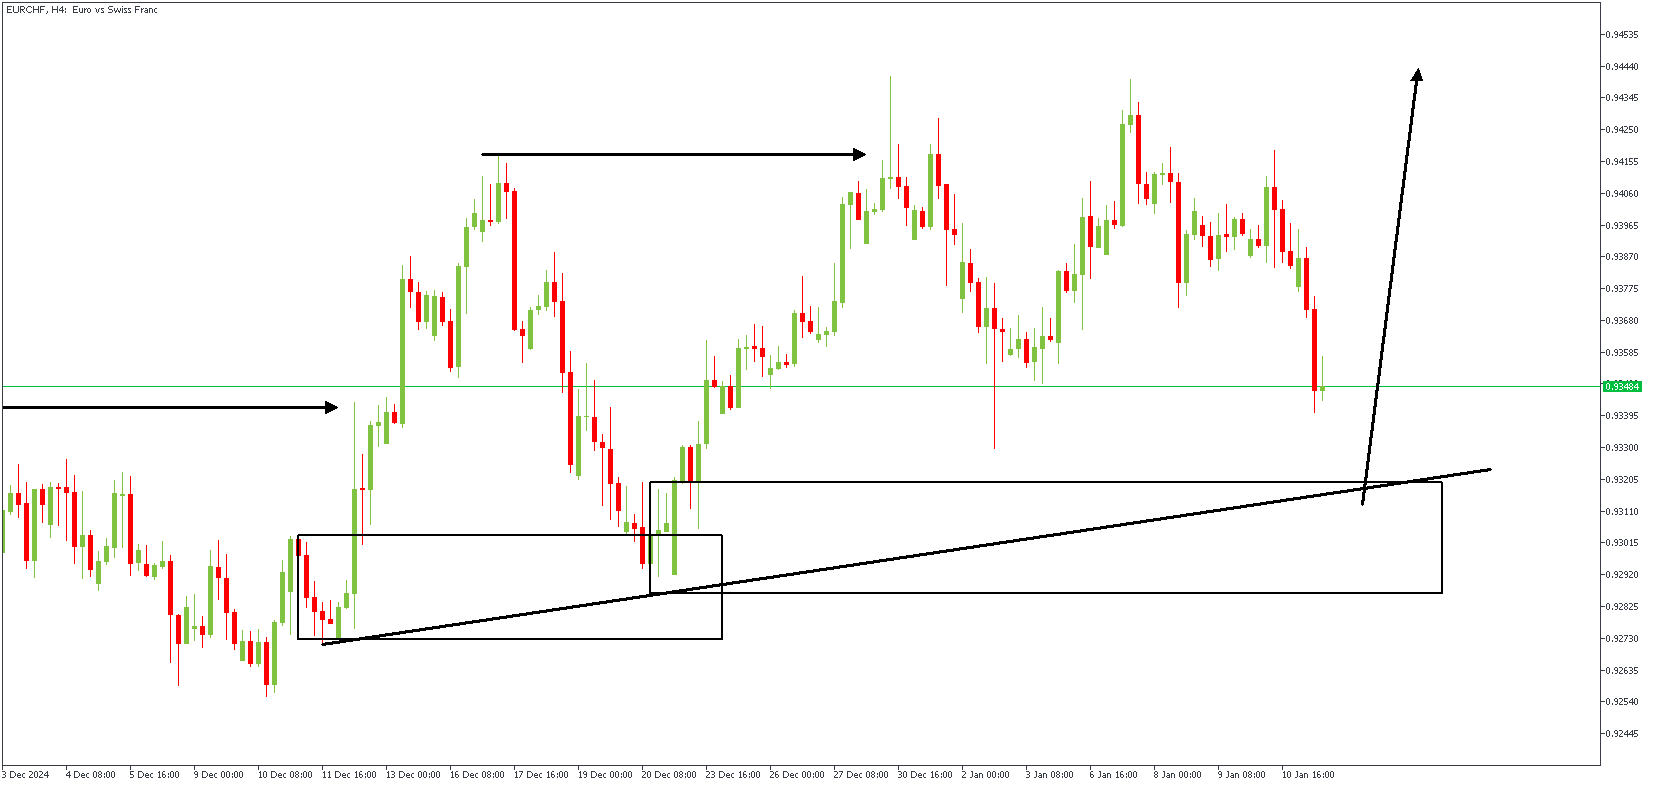
EURCHF – H4 Timeframe
As seen on the daily timeframe, my sentiment as touching EURCHF is bullish. The confluence of the trendline support and the drop-base-rally demand zone is my expected area of entry, with targets highlighted below.
Analyst's Expectations:
- Direction: Bullish
- Target: 0.94397
- Invalidation: 0.92589
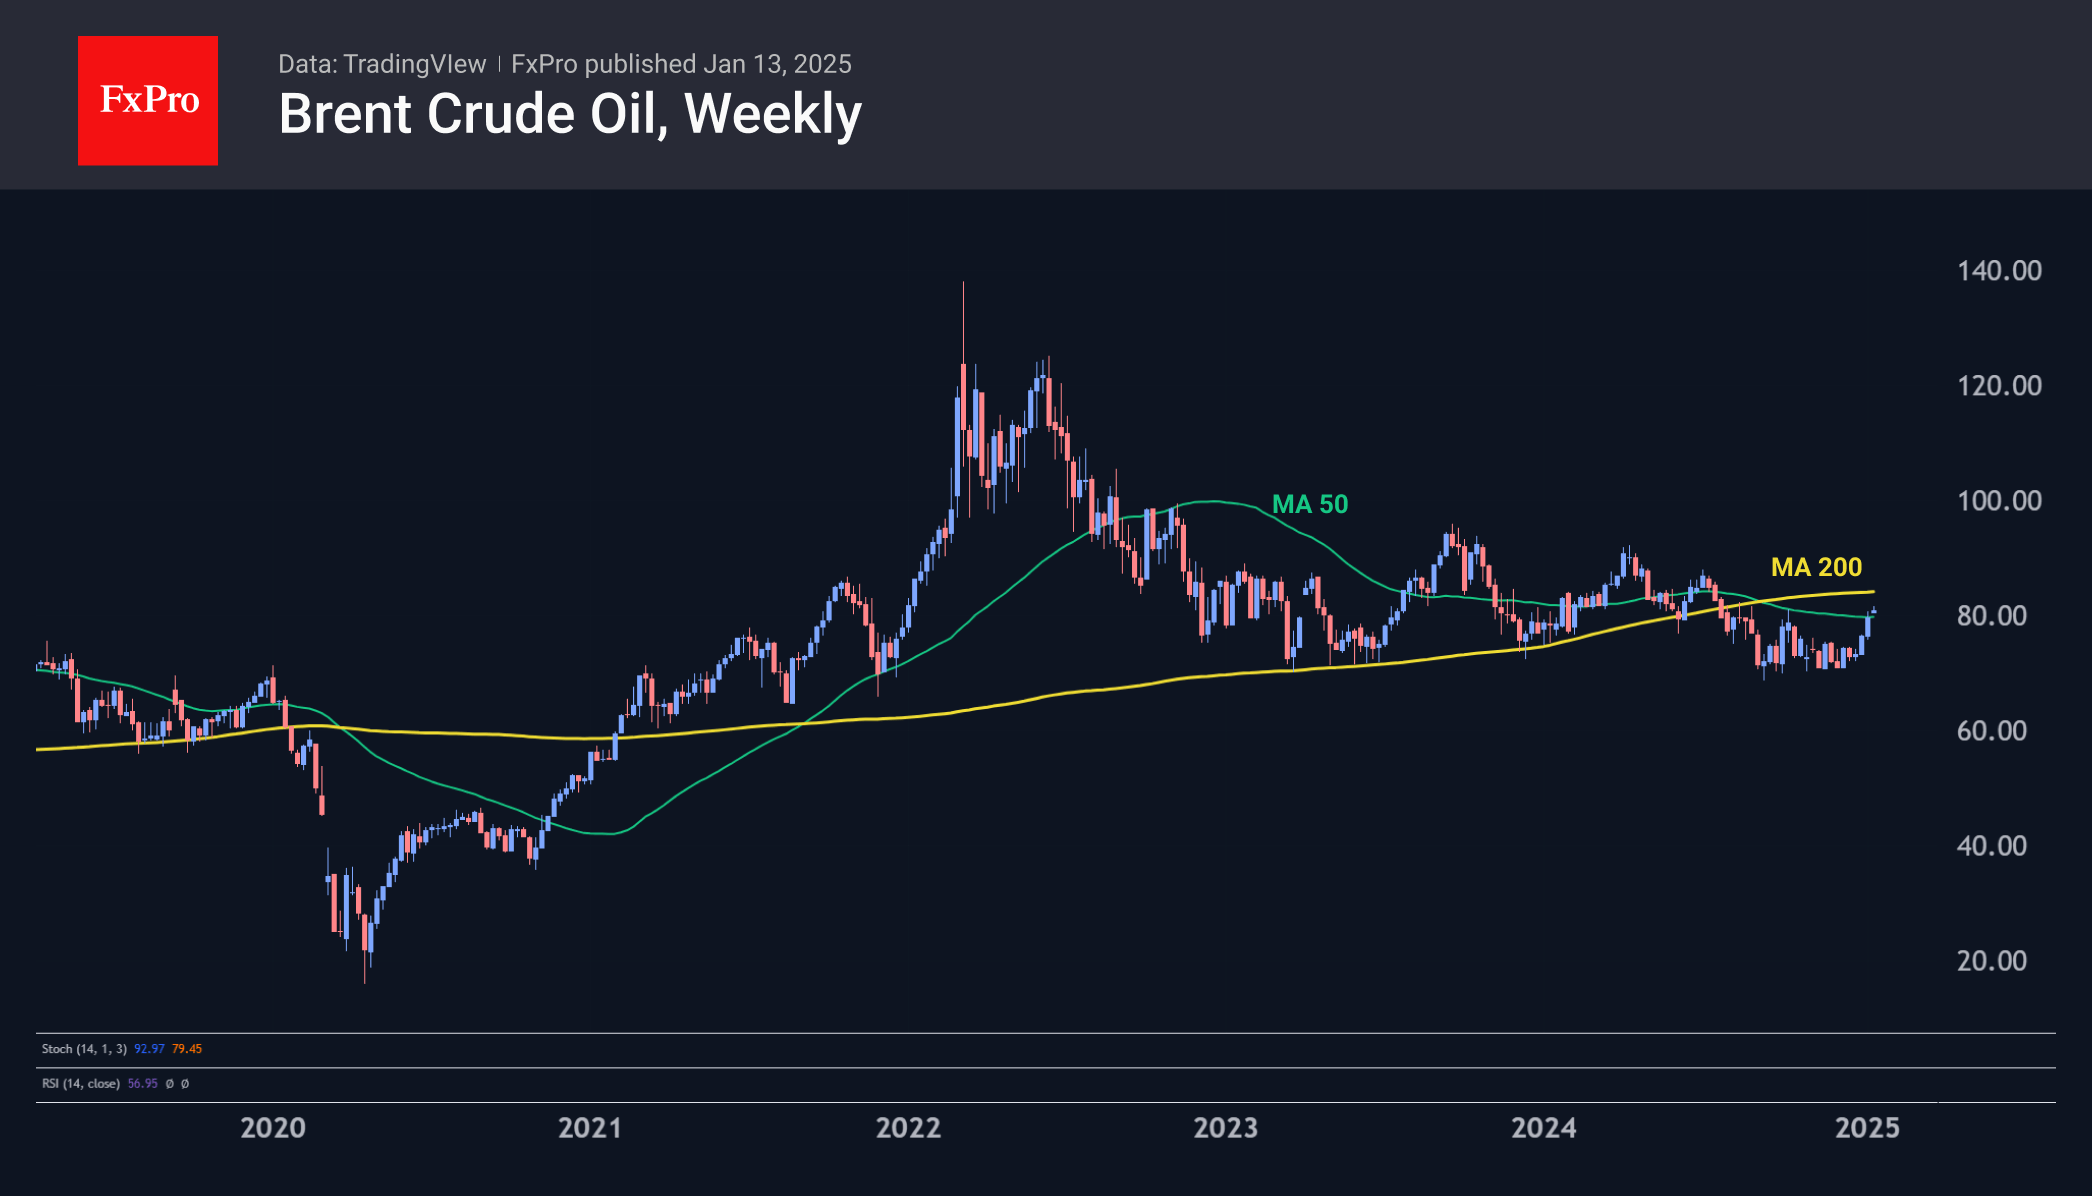
Increasingly Bullish Technical Picture for Crude Oil
Oil closed the previous three weeks higher and is rising at the start of the new week, driven by various bullish factors. Most of them are temporary, but they are altering the long-term technical picture, changing speculators’ attitudes towards oil and attracting bulls.
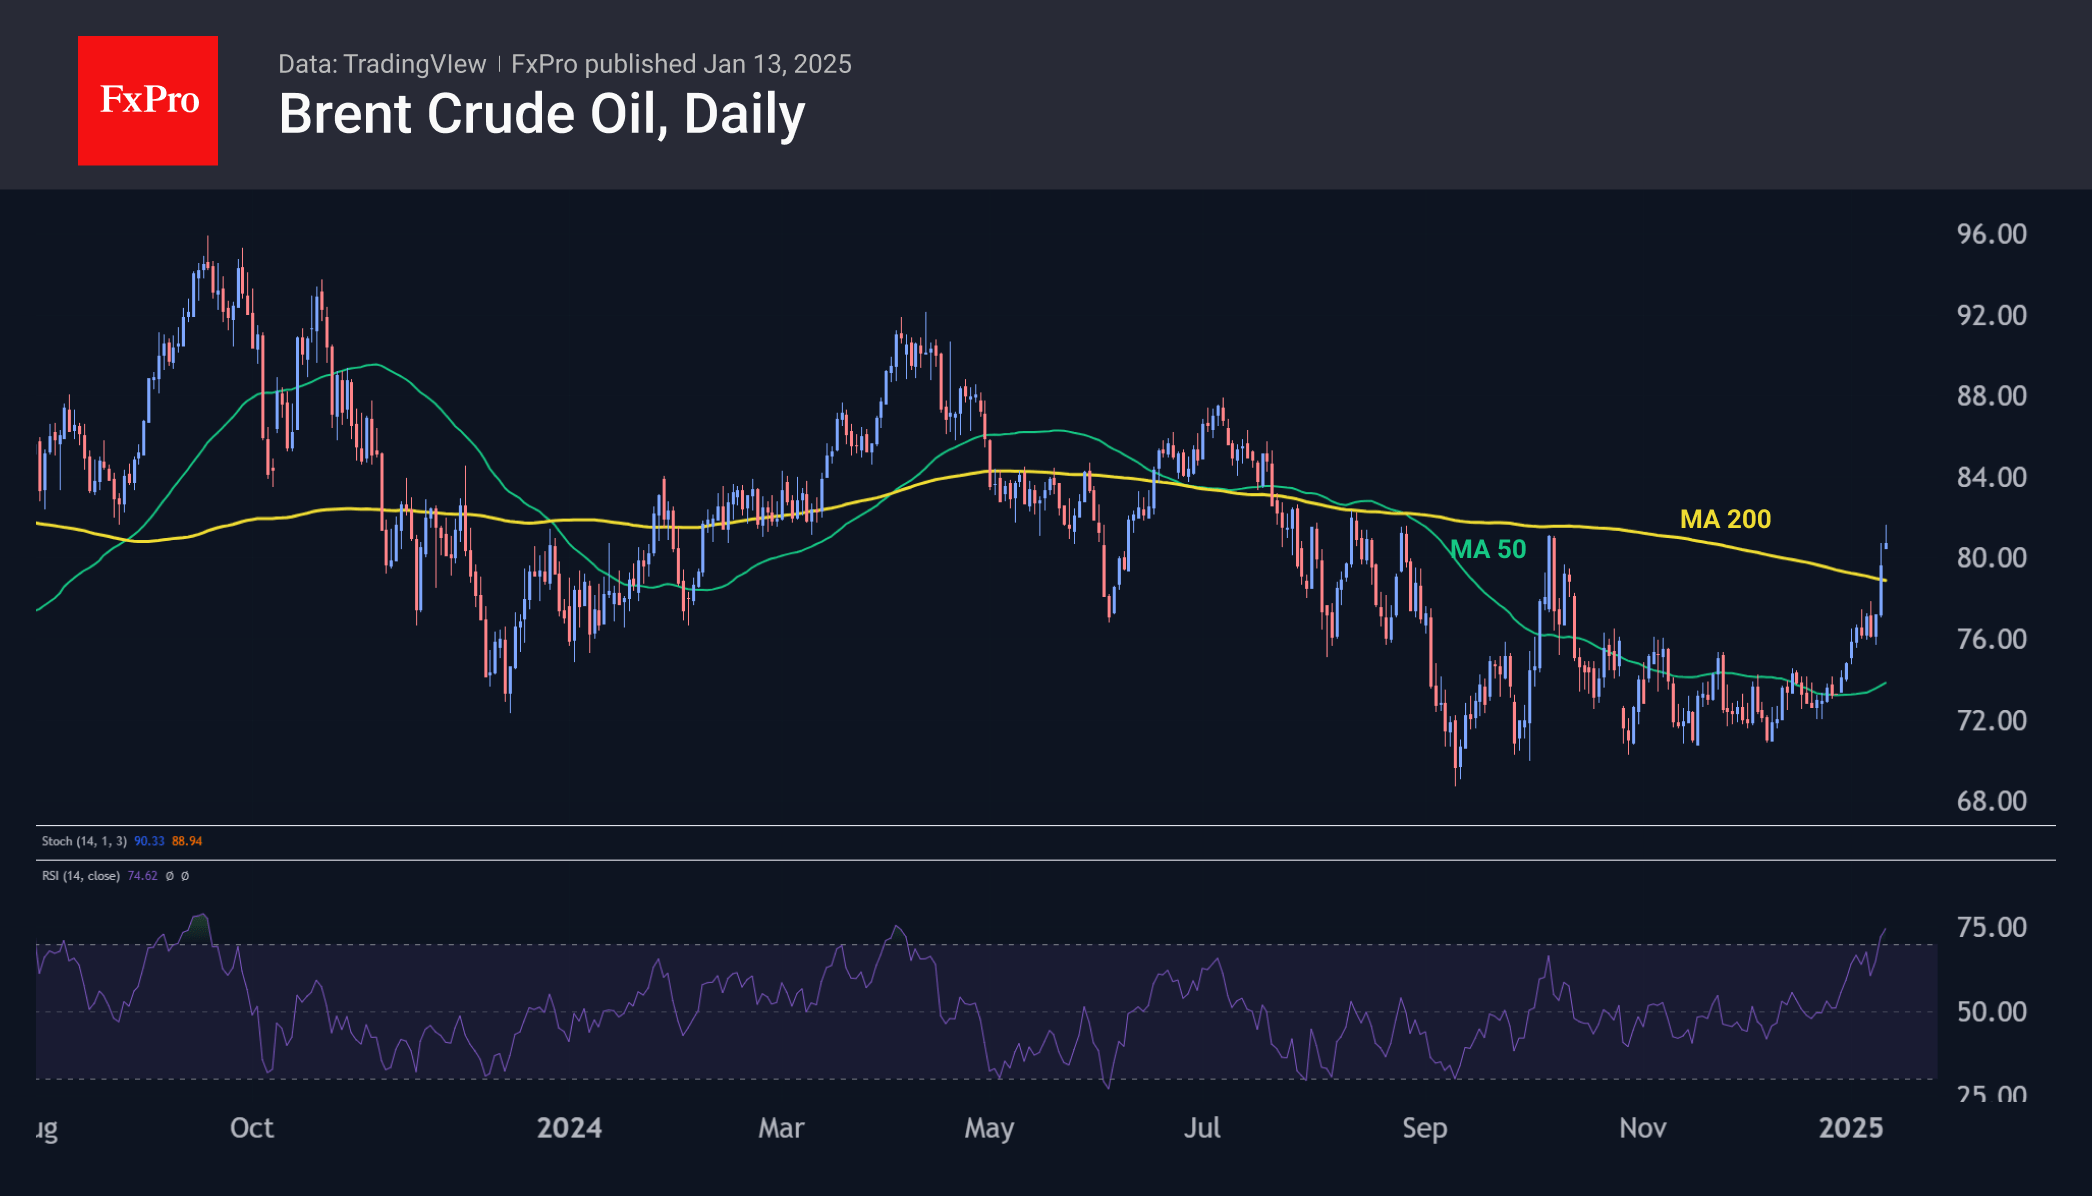
Brent oil is moving steadily above $80, entering the peak area of October last year. Last week, Brent closed near its 50-week moving average. Further gains at the start of the week indicate the strength of buyers, who are not deterred by the general risk apprehension that is causing a sell-off in equities and bonds.
The main reason for this dynamic is the return of interest in oil. The US has tightened sanctions against Russia’s oil and gas sector, lifting demand for affordable alternatives. While these were sanctions of the outgoing Biden administration, Trump may continue this policy as he often promotes the interests of US producers in an attempt to turn around trade balance dynamics.
Extreme weather in parts of Europe and the US is pushing energy prices higher. Weather is a highly speculative factor; reports often have a greater impact on prices than actual changes in supply and demand. Nevertheless, market sensitivity to this factor should not be underestimated: it may continue to pull quotes upwards despite the headwinds in the form of risk sell-off.
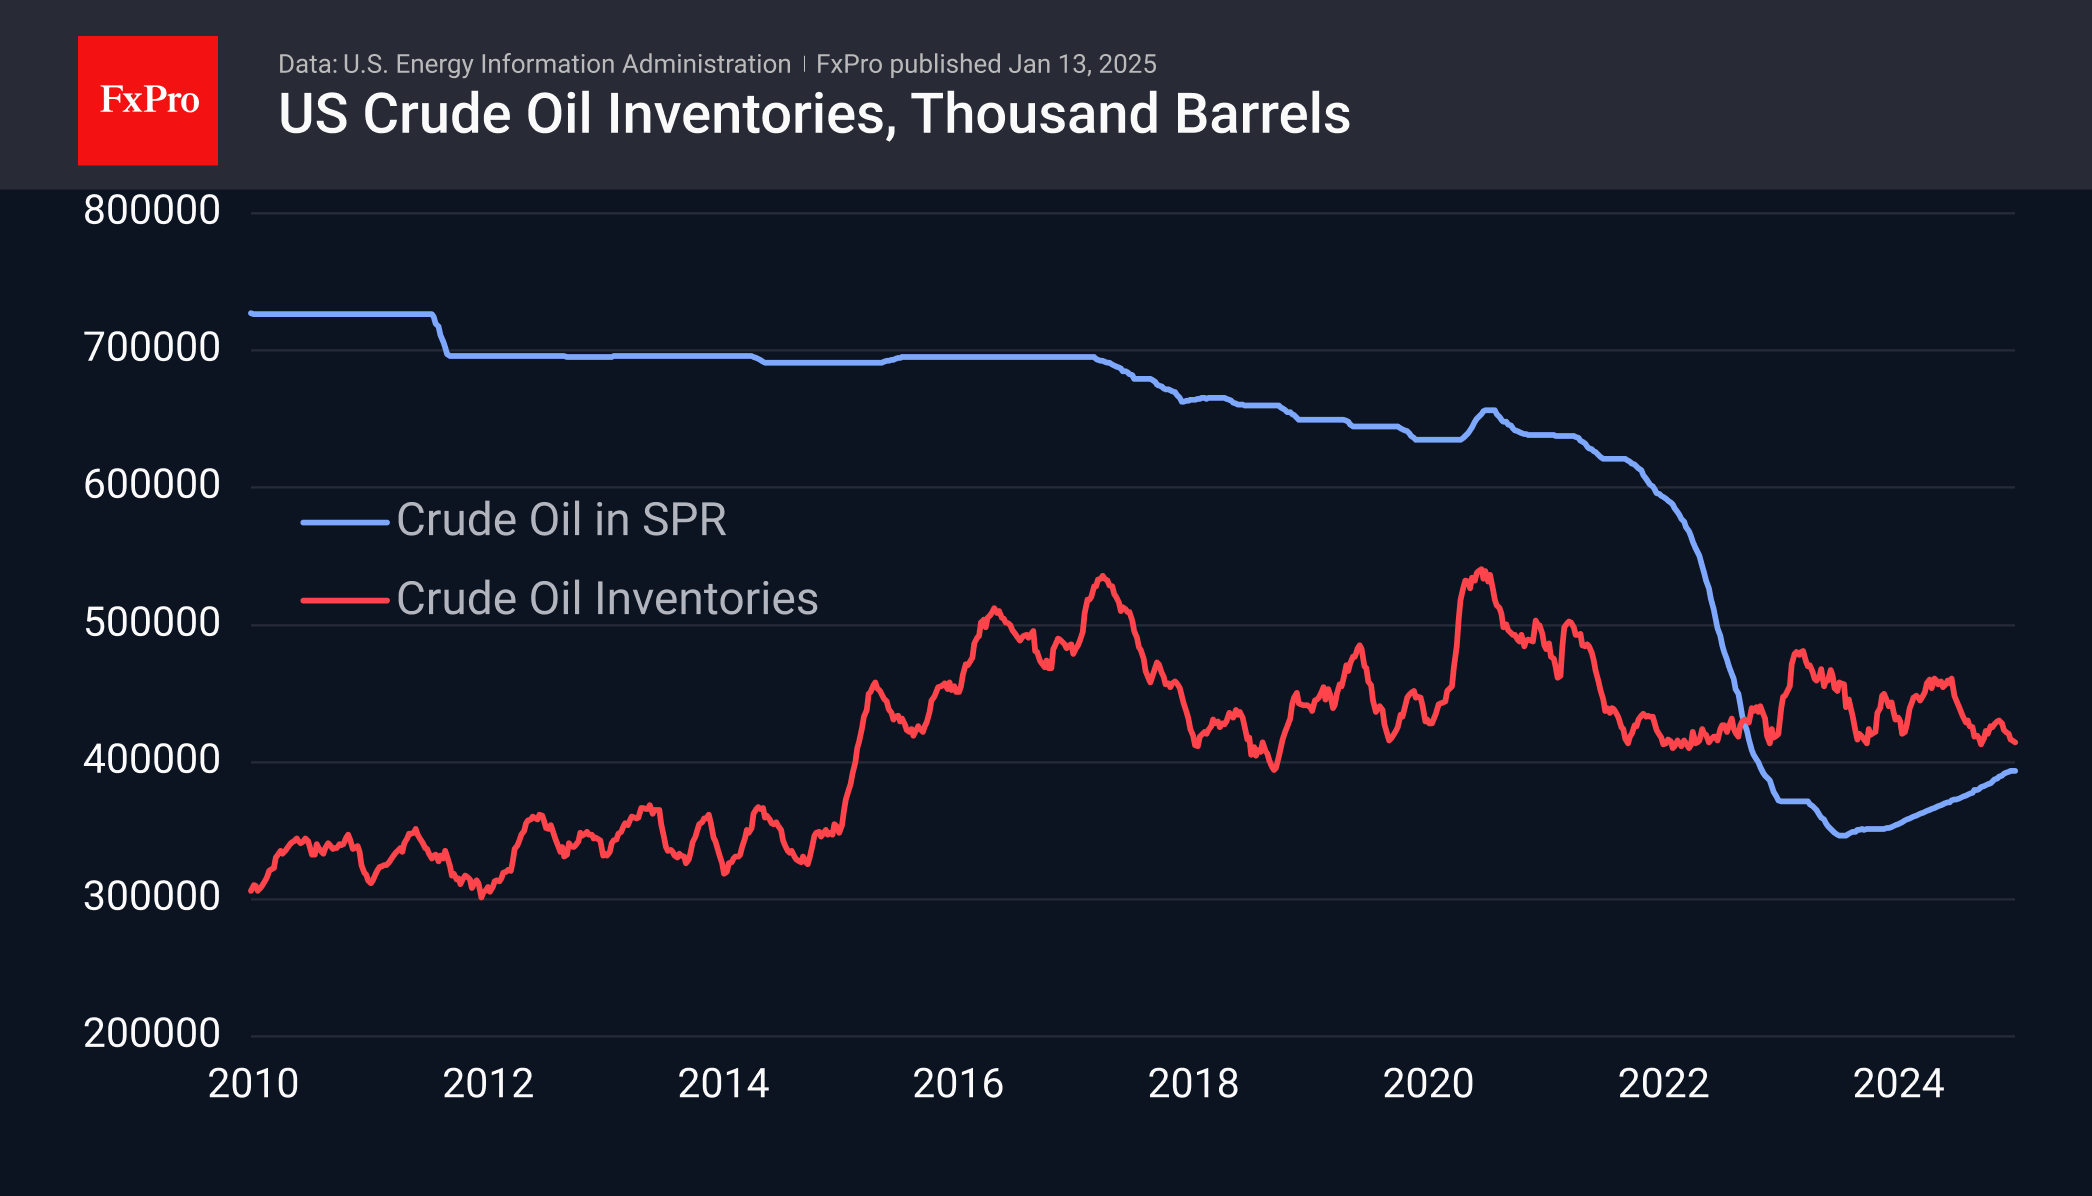
The dynamics of commercial inventories in the USA also temporarily support stock bulls. In the last seven weeks, a decline in inventories has been recorded, bringing their total level closer to 400 million barrels. This is not a magic line, but the impact of inventory levels on the oil price is growing as it approaches this mark, which has been the lower boundary of inventories for almost 10 years.
Brent is moving above the 50-week moving average, but the most important test will be the 200-week moving average, now at $83.60, which could be reached as early as this week. A rise above this level may not be an easy task. However, if the price confidently overcomes this level, it may become a prologue to the return of prices to the territory above $100.
Brent Crude – Oil Advances on Russian Sanctions. Will 100-day MA Cap Gains?
- Oil prices rose due to new US sanctions on Russian oil and tankers.
- The Kremlin warned these sanctions could destabilize global energy markets.
- Indian ‘sources’ stated it would avoid purchasing Russian oil from sanctioned entities and vessels.
- Markets are assessing the potential for a supply shock and whether OPEC+ will increase output.
Oil prices continued their rise this morning following a harsh batch of sanctions by the US on Russian Oil and tankers. The sanctions are the harshest yet and include producers Gazprom Neft SIBN.MM and Surgutneftegaz SNGS.MM, as well as 183 vessels that have shipped Russian oil, targeting revenue Moscow has used to fund its war with Ukraine.
The Kremlin responded this morning, warning that such decisions are bound to destabilize global energy and oil markets. The Kremlin also reiterated its stance to minimize the impact of US sanctions.
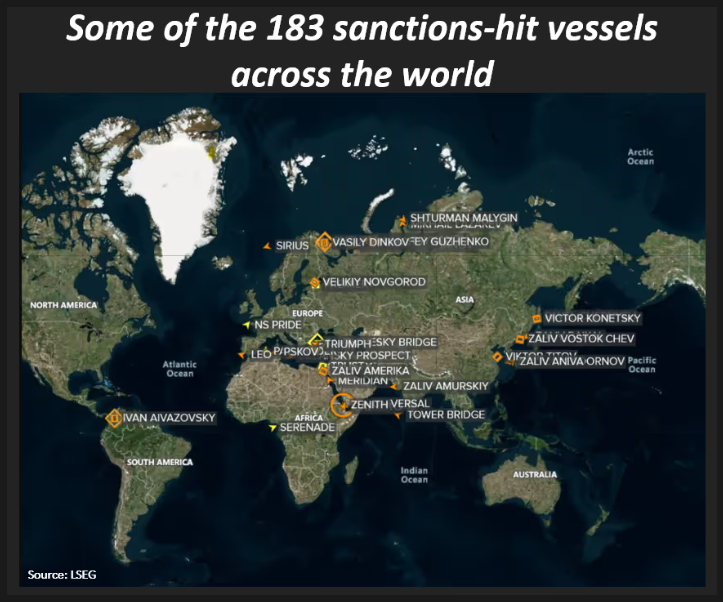
Source: LSEG (click to enlarge)
India and China to Buy Oil Elsewhere?
There have been rumors since Friday’s announcement of the sanctions that countries who were still purchasing Russia will cease to do so under the new sanctions. This morning an Indian Government source stated that India won’t take Russian oil from sanctioned entities and in sanctioned vessels.
However, this has not been confirmed by official channels. Several tankers listed in the new sanctions have been transporting oil to India and China. This shift happened after Western sanctions and a price cap set by the Group of Seven in 2022 redirected Russian oil trade from Europe to Asia. Some of these ships have also been carrying oil from Iran, which is also under sanctions.
The move comes just as proceeds from oil and gas sales for Russia’s federal budget in 2024 jumped by more than 26% to 11.13 trillion roubles ($108.22 billion). Many see the oil industry as the main source of funding for the war in Ukraine with oil and gas proceeds accounting for about a third to half of the total Federal Budget.
Markets are now weighing up a potential supply side shock following sanctions. However, given that OPEC+ have been waiting to increase output, will they now do so if Russian output is taken off the market?
For now, it appears markets are adopting a more cautious approach and hence the increase in Oil prices. Markets do not appear to be sold yet on the idea that OPEC + will bridge any supply deficits.
Intriguing to see how this develops in the coming weeks as President Trump assumes office.
The Week Ahead – Inventories Data and US inflation
Higher Oil prices may not be ideal for Financial Markets after last weeks US jobs data smashed estimates. The result has seen market participants expecting inflationary pressure in 2025 especially in the US which could halt interest rate cuts.
An increase in Oil prices could have a similar impact and see market participants price in more inflationary pressure globally in 2025. Such a move would no doubt stoke demand concerns as well.
US inflation data is due this week and any significant uptick in the inflation print will also add to the market’s growing concern. On the inventory front markets will be paying attention to stockpile levels from both the EIA and API, due on Tuesday and Wednesday respectively.
Technical Analysis
However, given the length of time Oil prices remained in consolidation, i for one was not surprised by the aggressiveness of the breakout.
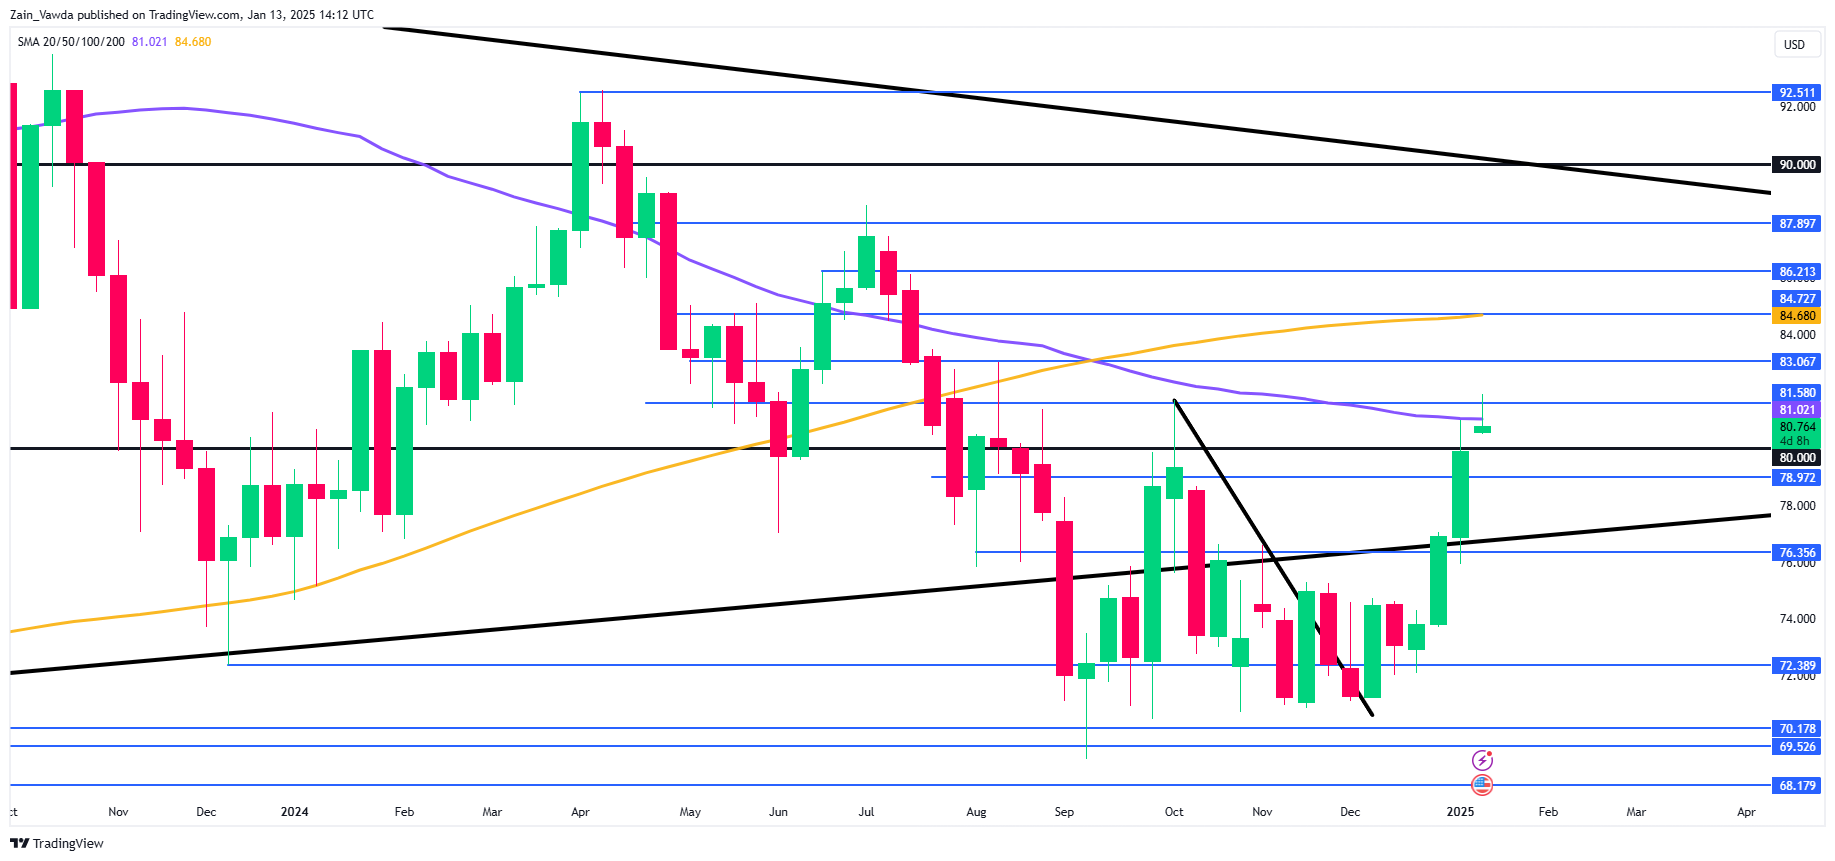
As things stand, Oil has run into a spot of bother on the weekly chart below. The Oil price is currently rejecting of the 100-day MA which could leave Oil prices with some downside in the coming days.
Brent Crude Oil Weekly Chart, January 13, 2025
Source: TradingView (click to enlarge)
Dropping down to a daily timeframe and immediate support rests at $80 a barrel mark with the 200-day MA resting below at 79.28.
A break of this level could open up a retest of the 76.35 before the 75.00 psychological level.
If bulls were to seize control of the narrative then Oil could eye resistance at 81.58 and 83.00 respectively.
Brent Crude Oil Daily Chart, January 13, 2025

Source: TradingView (click to enlarge)
Support
- 80.00
- 79.28
- 76.35
Resistance
- 81.58
- 83.00
- 84.72
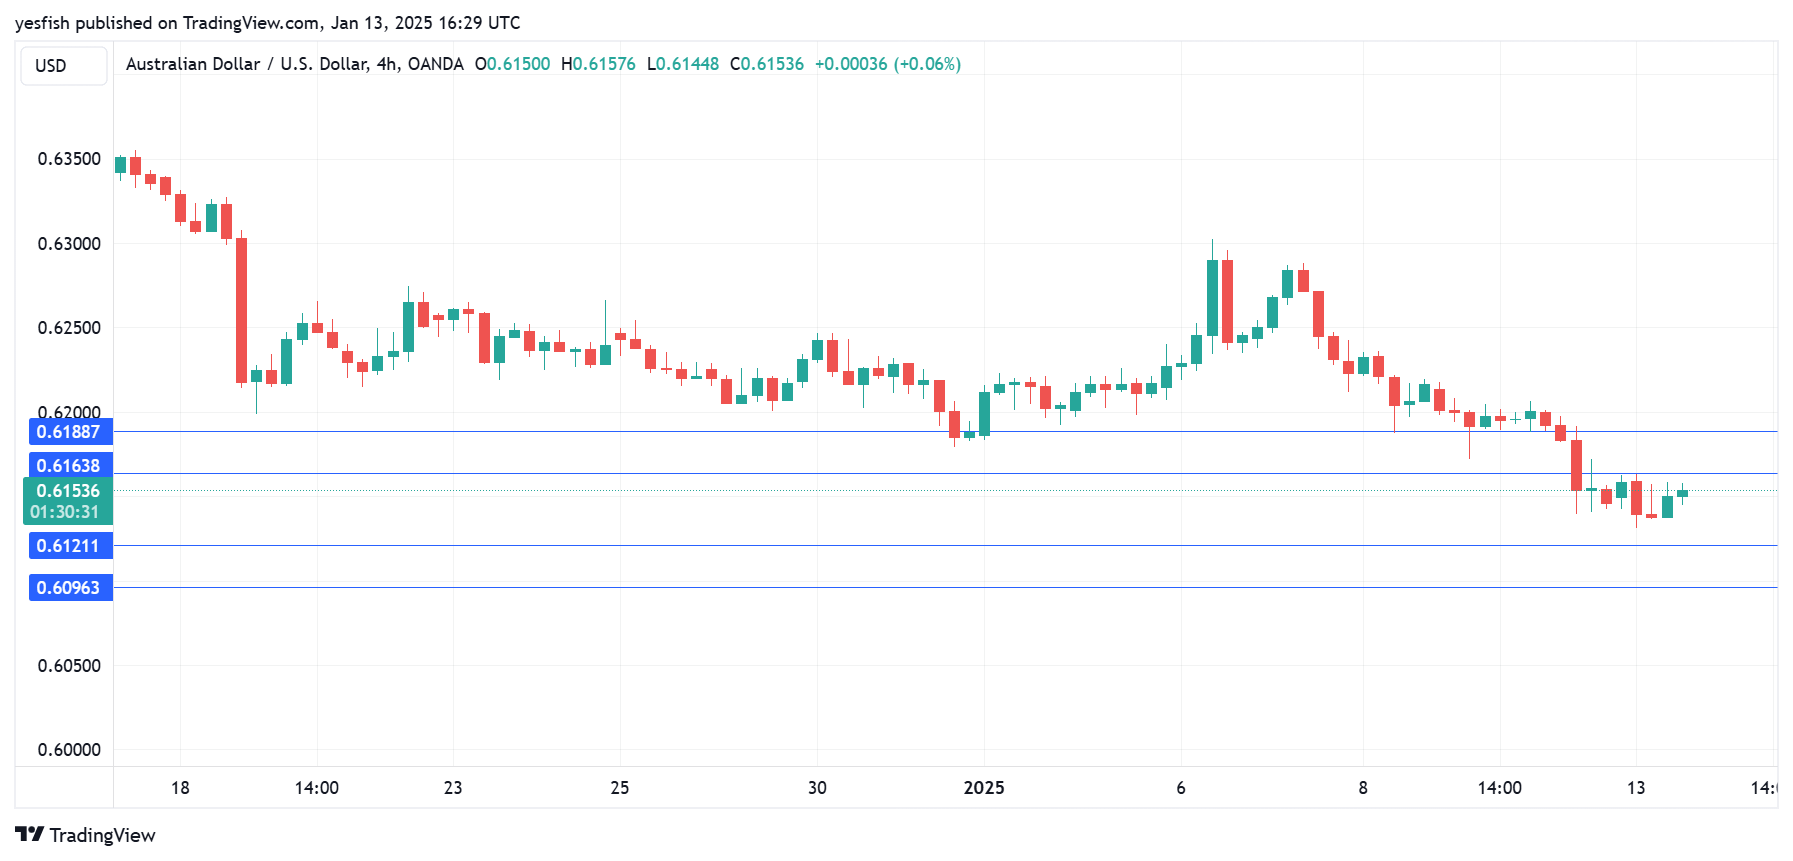
AUD/USD Stabilizes After Post-NFP Slide
The Australian dollar has started the week quietly. In the North American session, AUD/USD is trading at 0.6151, up 0.07% at the time of writing. Earlier, the Australian dollar fell as low as 0.6130, its lowest level since April 2020.
It was another rough week for the Australian dollar, which declined 1.7% last week. The Aussie can’t find its footing and has plunged 10.4% in the past three months.
Strong US nonfarm payrolls sends Aussie tumbling
The week ended with a surprisingly strong US jobs report. In December, the economy added 256 thousand jobs, the most since March 2024. This followed a downwardly revised 212 thousand in November and easily beat the market estimate of 160 thousand. The unemployment rate eased to 4.1%, down from 4.2% in November. Wage growth also ticked lower, from 4% y/y to 3.9% and from 0.4% to 0.3% monthly.
The upshot of the jobs report is that the US labor market remains solid and is cooling slowly. For the Federal Reserve, this means there isn’t much pressure to lower interest rates in the next few months. That will suit Fed policy makers just fine as it awaits Donald Trump, who has pledged tariffs against US trading partners and mass deportations of illegal immigrants. Either of those policies could increase inflation and the Fed will try to get a read of the Trump administration before cutting rates again. The latest Fed forecast calls for only two rate cuts in 2025 but that could change, depending on inflation and the strength of the labor market.
The strong employment numbers boosted the US dollar against most of the majors on Friday and the Australian dollar took it on the chin, falling 0.8%, its worst one-day showing in three weeks. With interest rates likely on hold in the near-term and high tensions in the Middle East, the safe-haven US dollar should remain attractive to investors in the coming months.
AUD/USD Technical
- AUD/USD tested resistance at 0.6163 earlier. Above, there is resistance at 0.6188
- 0.6121 and 0.6096 are providing support